Characterisation of the interleukin-4
signalling cascade involved in the
induction of cyclooxygenase-2 and the
polarisation of macrophages into an
anti-inflammatory phenotype
Sivanjaa Manoj
School of Health Sport and Bioscience, University of East London
January 2018
Abstract
activated kinase (MAPK) in the signalling pathways through which IL-4 could potentially induce COX-2 protein and other mediators of resolution.
The experiments were designed to investigate whether there are similarities between the induction of COX-2 and the polarisation of macrophages down an anti-inflammatory line. As such, the macrophage J774.2 cell line was treated with 1μg/ml lipopolysaccharide (LPS), 500μM diclofenac or 10ng/ml IL-4 for 24 and 48 hours. These cells were assessed for COX-2 expression and activity, the production of the pro-inflammatory cytokine, tumour necrosis factor alpha (TNFα) and the anti-inflammatory cytokine, interleukin 10 (IL-10) respectively and the anti-inflammatory mediator, cAMP. The importance of p38 and PPAR was assessed using the specific p38 inhibitor, SB203580 and a PPAR antagonist, Bisphenol A diglycidyl ether (BADGE). Following preliminary pharmacology experiments, the working concentration of each drug was decided: 10μM SB203580 and 150μM BADGE. In a subset of experiments, the effect of inhibition of COX-2 by 0.1-100μM acetaminophen,
1-100μM indomethacin and 1-5μM dexamethasone (DEX) was also investigated; with
the aim of identifying differential effects depending on the stimulant.
LPS treated macrophages produced high levels of TNFα and low levels of
IL-10 within 24 hours of exposure. By contrast IL-4 produced high IL-IL-10 and low TNFα
levels at 48 hours. This confirms the opposing phenotypic state of the macrophages
post-stimulation. Following IL-4 stimulation, the studies identified a possible sequence
of events leading up to the induction of COX-2 and prostaglandin E2 (PGE2) synthesis.
Adding antagonists of cAMP, PPAR or p38 MAPK to cells stimulated with IL-4
factors become activated upstream to COX-2 induction by IL-4. In addition, cAMP was
regulated at the level of both PPAR and p38 while PPAR was regulated by p38.
Exposure to indomethacin reduced and blocked TNFα and IL-10 induced by LPS and
IL-4 respectively. DEX specifically blocked TNFα secretion but induced IL-10
secretion.
Blocking both p38 and PPAR in IL-4 treated cells, prevents secretion of
anti-inflammatory cytokine IL-10. The novel finding that the p38 kinase and PPAR receptor
are required for both the induction of COX-2 and secretion of IL-10, suggests an
overlap between macrophage polarisation to an anti-inflammatory phenotype and late
COX-2 induction pathways. P38, PPAR and cAMP would therefore be reasonable
drugs targets to induce resolution. These studies suggest that in addition to being
involved in driving inflammation, COX-2 may also drive resolution; however, this is yet
to be confirmed with further experiments. These studies may go some way to
explaining the adverse reactions and an impaired immune response reported in some
Abstract……….. ii
List of Figures……… viii
Abbreviations………. x
Acknowledgements……….. xiii
Chapter 1: Introduction….………...………..1
1.1 The inflammatory response……….. 1
1.1.1 Acute Inflammation……….. 2
1.1.2 Chronic inflammation………... 3
1.2 Macrophages in inflammation……… 4
1.2.1 Macrophage polarisation………. 5
1.2.2 Signalling pathways involved in macrophage polarisation ……… 7
1.2.3 IL-4 signalling……… 8
1.3 Production of prostaglandins (PG)……… 10
1.4 The discovery of the COX-2 protein and its role in inflammation………. 11
1.5.1 Biphasic expression of COX-2……… 13
1.5.2 COX-2 inhibition amplifies inflammation………... 13
1.6 Sensitivity of COX-2 for inhibition.………. 16
1.6.1 Inhibition of COX-2 by acetaminophen………. 16
1.6.2 Inhibition of COX-2 by Indomethacin………. 17
1.6.3 Inhibition of COX-2 by dexamethasone……….………... 18
1.7 Transcription factors involved in COX-2 induction………. 20
1.7.1 NFĸB in inflammation……….. 20
1.7.2 PPARγ transcription factor……….. 21
1.7.3 Relevance of PPARγ and NFĸB in COX-2 induction……….. 22
1.8 Mediators involved in the induction of COX-2………... 23
1.8.1 Mitogen-activated protein kinases (MAPK) ………. 23
1.8.1.1 p38 MAPK……….. 24
1.8.2 cAMP as a second messenger……….. 26
1.8.2.1 The role of cAMP in macrophage polarisation………. 27
1.9 Hypothesis……… 29
1.10 Aims and objectives……….. 29
Chapter 2Methods.………. 32
2.1 Cell culture……… 32
2.1.1 General maintenance of the macrophage J774.2 cells……….. 32
2.1.2 Experimental cell stimulations……… 32
2.1.3 Inhibitory assays………... 33
2.2 MTT assay……… 34
2.3 Bradford assay………. 35
2.4 SDS-PAGE and immunoblotting……… 37
2.5 Enzyme immunoassay (EIA) for PGE2 ……… 39
2.6 cAMP quantification………. 41
2.7 PPARγ transcription factor activity assay……… 42
2.8 Cytokine profile ELISA……… 43
2.9 Statistical analysis……… 43
Results and Discussion
Chapter 3 Induction of COX-2 in vitro with temporal variations…………..……….. 46
3.1 Induction of COX-2 by LPS and diclofenac with temporal variations……….. 46
3.2 Induction of COX-2 by an anti-inflammatory cytokine, IL-4……….. 49
3.3 Selective inhibition of the late induced COX-2 by acetaminophen……….. 54
3.4 Cell viability following stimulations of macrophage J774.2 cells……….. 58
3.5 Discussion to results chapter 3: Induction of COX-2 protein in vitro with temporal variations………. 60
3.5.1 Induction of an early and late COX-2 by LPS and diclofenac………... 60
3.5.2 Evidence of macrophages that express COX-2 following IL-4 treatment ……….. 62
3.5.3 Selective inhibition of COX-2 by acetaminophen……… 66
3.6 Chapter conclusion……….. 69
Chapter 4 Signalling pathway involved in the induction of COX-2 by IL-4…..…... 71
4.1 PPARγ is required for the induction of COX-2 by IL-4……….. 71
4.2 Induction of PPARγ by LPS and IL-4……… 75
4.3 P38 MAPK involvement in LPS, diclofenac and IL-4 inductive COX-2………... 79
4.4 Role of cAMP in the polarisation of macrophages into an M2 phenotype………….. 84
4.4.1 Requirement of cAMP in IL-4 induced COX-2……….… 84
4.4.2 Role of p38 and PPARγ in LPS and IL-4 induced cAMP……….. 86
4.5 Discussion to results chapter 4: Signalling pathway involved in the induction of COX-2 by IL-4……….. 90
4.5.1 Activation and requirement of PPARγ in the IL-4 induced COX-2 pathway……… 90
4.5.2 Involvement of P38 MAPK in COX-2 induction……… 93
4.5.3 Role of cAMP in the induction of COX-2 by IL-4………. 96
4.6 Chapter conclusion……….. 102
Chapter 5 Phenotype of the macrophage expressing COX-2 following stimulations with LPS and IL-4..……… 104
5.1.1 Macrophage polarisation………. 104
5.1.2 Cytokine profiling as a measure of macrophage phenotype state……… 105
5.2 Phenotypic state of the macrophage following IL-4 treatment………. 106
5.3 Effect of p38 inhibition and PPARγ antagonism on 4 induced production of IL-10………... 107
5.4 Effect of SB203580 and BADGE on IL-4 and LPS induced TNFα levels…………... 109
5.5 Suppression of cytokine release by COX inhibitor………. 113
5.6 Discussion to results chapter 5: Macrophage polarisation following treatment of cells with LPS and IL-4………... 116
5.6.1 Cytokine profile following treatment of cells with LPS and IL-4……… 116
5.6.2 IL-4 treated macrophages produce IL-10 cytokine………. 117
5.6.3 LPS, but not IL-4 transform macrophages to produce TNFα……… 119
5.6.4 Inhibition of cytokine production by Indomethacin……….. 123
5.6.5 Indomethacin inhibitory effect on IL-10………. 124
5.6.6 Indomethacin inhibitory effect on TNF……….. 124
Chapter 6 Effect of dexamethasone in macrophages stimulated with LPS, diclofenac
and IL-4………..………. 128
6.1 Antagonistic relationship between dexamethasone and LPS……….. 128
6.2 Effect of dexamethasone on COX-2 induction by LPS, diclofenac and IL-4……….. 128
6.3 Dexamethasone inhibition of cytokine release by LPS and IL-4 in macrophages… 131 6.4 Discussion to results chapter 6: The role and effect of dexamethasone on IL-4 treated cells………... 134
6.4.1 Effect of dexamethasone on COX-2 expression………. 134
6.4.2 Effect of dexamethasone on IL-10 and TNFα production following stimulations... 136
6.5 Chapter conclusion……….. 137
7.0 Final conclusion……… 139
8.0 Further work………..……… 142
9.0 References……… 144
List of figures
Figure 1.2.1.1: Diagram portraying the macrophage polarisation paradigm whereby macrophages take an anti-inflammatory or pro-inflammatory phenotype depending on the
stimulus……… 6
Figure 1.4.1: Diagram showing the induction of COX-2 when LPS binds to its receptor..12 Figure 3.1.1: Induction of COX-2 expression with increasing concentrations of a) LPS and
b) diclofenac………... 48
Figure 3.1.2: Induction of COX-2 activity via a) LPS at 24 hours with only 10μg/ml LPS
inducing activity at 48 hours. COX-2 activity was induced by b) high concentrations of
diclofenac at 48 hours………... 49
Figure 3.2.1: Induction of COX-2 expression with increasing concentrations of IL-4 at 48
hours……… 51
Figure 3.2.2: 5 and 10ng/ml IL-4 induced COX-2 activity at 48 hours but not at 24
hours……… 53
Figure 3.3.1: Graph showing the inhibitory effects of acetaminophen on COX-2 activity at a) 24 hours and b) 48 hours. COX-2 induced by diclofenac and IL-4 were sensitive to
inhibition by acetaminophen but LPS induced COX-2 was not………. 57
Figure 3.4.1: MTT assay showing high concentrations of diclofenac to reduce cell
viability……….... 59
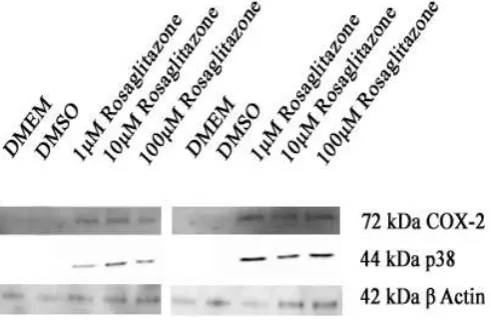
Figure 4.1.1: Rosiglitazone induced COX-2 expression whilst activating P38……… 73 Figure 4.1.2: BADGE completely blocked expression of COX-2 induced by a) diclofenac
and b) IL-4 at 48 hours……….. 74
Figure 4.1.3: At 48 hours, BADGE significantly reduced diclofenac and IL-4 induced COX-2
activity but had no effect on LPS induced COX-2 activity………... 75
Figure 4.2.1: LPS reduced PPARγ activity at 24 and 36 hours with no effect at other time
points……….. 76
Figure 4.2.2: PPARγ activity was induced by a) IL-4 at 30 minutes and 48 hours. The
addition of b) SB203580 completely blocked PPARγ activity……….... 78
Figure 4.3.1: p38 inhibitor did not block LPS induced COX-2 expression at a) 24 hours. High concentrations of SB203580 inhibited COX-2 expression induced by b) LPS and c) diclofenac at 48 hours. Low concentrations of SB203580 inhibited d) IL-4 induced COX-2
expression at 48 hours………. 81
Figure 4.3.2: LPS required p38 to induce COX-2 activity at 24 hours. SB203580 increased LPS induced COX-2 activity but reduced diclofenac and IL-4 induced COX-2 activity at 48
hours……….... 83
Figure 4.4.1.1: cAMP is not required for a) LPS induced COX-2 at 24 hours, but is critical
for b) IL-4 induced COX-2 at 48 hours………... 86
Figure 4.4.2.1: The effect of SB203580 and BADGE on cAMP levels following treatment of cells with 1μg/ml LPS, 500μM diclofenac and 10ng/ml IL-4 for a) 24 hours and b) 48 hours……………... 89 Figure 5.2.1: Increasing concentrations of IL-4 caused an increase in IL-10 levels between
2 and 48 hours………... 107
Figure 5.3.1 IL-4 induced IL-10 levels was significantly reduced at both 24 and 48 hours in
Figure 5.4.1: IL-4 did not induce TNFα in macrophage J774.2 cells. The addition of a)
SB203580 did not impact this however, at 24 hours, b) BADGE increased TNFα. LPS
required c) p38 and d) PPARγ to produce TNFα 24 hours………. 112
Figure 5.5.1: Indomethacin of increasing concentrations blocked a) IL-10 produced by IL-4
and reduced b) TNFα produced by LPS………. 115
Figure 6.2.1: Low DEX concentrations reduced while high DEX concentrations increased LPS induced COX-2 expression respectively at a) 24 and b) 48 hours. High concentrations of DEX reduced c) diclofenac induced COX-2 while DEX reduced IL-4 induced COX-2
expression……….. 130
Figure 6.3.1: DEX induced IL-10 production and had no additive effect on a) IL-4 induced
Abbreviations
12-HEPE 12-hydroxyeicosatetraenoic acid
AA Arachidonic acid
AAM Alternatively activated macrophages
AC Adenyl cyclase
AChE Acetylcholinesterase
AD Alzheimer’s disease
ANOVA Analysis of variance
Arg-1 Arginase-1
BADGE Bisphenol A diglycidyl ether
BMDM Bone marrow derived macrophages
BSA Bovine serum albumin
CAM Classically activated macrophages
cAMP Cyclic adenosine monophosphate
CEF Chick embryonic fibroblasts
CHD Coronary heart disease
COX Cyclooxygenase
CTFB Complete transcription factor binding assay buffer
CVD Cardiovascular disease
cyPG Cyclopentanone PG
db-cAMP Dibutyryl cyclic adenosine monophosphate
DEX Dexamethasone
DMEM Dulbecco's modified eagle medium
DMSO Dimethyl sulfoxide is an organosulfur
DSS Dextran sodium sulfate
DTT Dithiothreitol
EIA Enzyme immunoassay
FABP4 Fatty acid binding protein
FBS Fetal bovine serum
GC Glucocorticoid
GDP Guanine diphosphate
GPCR G protein-coupled receptor
GR Glucocorticoid receptor
GREs GC-response elements
GTP Guanine triphosphate
Gαs G protein alpha subunit
HRP Horseradish peroxidase
IFNγ Interferon gamma
Ig Immunoglobulin
IĸB Inhibitor of NFĸB
IKK IĸB kinase
IL Interleukin
JAK Janus kinase
KLF4 Kruppel-like factor 4
LHP Lipid hydroperoxide
LPS Lipopolysaccharide
MAPKAPK MAPK-activated protein kinase
MHC major histocompatibility complex
MK2 MAPKAPK-2
MK3 MAPKAPK-3
MR Mannose receptor
mRNA messenger ribonucleic acid
NSB Non-specific binding
p38 MAPK p38 mitogen activated protein kinase
PBS Phosphate buffered saline
PDE Phosphodiesterase
PEC Peritoneal exudate macrophages
PG Prostaglandin
PGDF Platelet-derived-growth-factor
PGG2 Hydroperoxy endoperoxide prostaglandin G2
PGI2 Prostacyclin
PKA Protein kinase A
PLA2 Phospholipase A
PMN Polymorphonuclear
PPARγ Peroxisome proliferator-activated receptor gamma
PTGS Prostaglandin-endoperoxide synthase
PTZ Pentylenetetrazole
PVDF Polyvinylidene difluoride
RA Rheumatoid arthritis
STAT Signal transducer and activator of transcription
TGFβ Tumour growth factor-beta
TMB 3,3',5,5'-Tetramethylbenzidine
TNFα Tumour necrosis factor
Acknowledgements
I would first like to express my deepest gratitude to both my supervisors: Dr Samir S Ayoub and Dr Winston A Morgan for their tremendous guidance and support throughout my Ph.D. I sincerely appreciate my acceptance on this programme of study and the wonderful opportunities given to me throughout my Ph.D. I would also like to offer profound gratitude to a number of academics within the Health, Sport and Bioscience department at UEL and my colleagues Mrs Divya Shah and Dr Shazma Bashir, who have continued to provide invaluable advice and carry out stimulating discussions in research.
Chapter 1: Introduction
1.1 The inflammatory response
Inflammation is a protective host response to physical stress, microorganisms or foreign bodies with the intention of eliminating the noxious stimuli. Discovery of mediators such as cytokines and eicosanoids has improved the current understanding of the complex nature of the immune response. The inflammatory response aims for survival during infection in order to uphold tissue homeostasis (see review: (Kopitar-Jerala, 2017)). Typically, there are 4 parts to the inflammatory response. The signal inducer (bacteria), the sensor (macrophage), the inflammatory mediating molecule (tumour necrosis factor (TNFα)) and the target infected tissue (skin).
There are 5 cardinal signs of inflammation: dolor (pain), rubor (redness), tumor (swelling), calor (heat) and functio laesa (loss of function). Inflammation is characterised by changes in microcirculation, fluid exudation and the movement of leukocytes from blood vessels into tissues (see for reviews: (Lawrence et al., 2002, Maskrey et al., 2011)). Immune cells involved in this process include: neutrophils, monocytes, macrophages, basophils, mast cells, T cells and B cells amongst others (see for review: (Punchard et al., 2004)). The sequential cascade of events control the inflammatory process.
accumulation of polymorphonuclear (PMN) leukocytes and chemical mediators such as acute phase proteins. Resolution includes apoptosis of PMN leukocytes, removal of pro-inflammatory mediators and the production of anti-inflammatory mediators and cytokines such as interleukin (IL)-10 (See for reviews: (Lawrence et al., 2002, Osiecki, 2004, Maskrey et al., 2011)). Neutrophil and macrophage production and secretion of cytokines are highly regulated at a transcriptional level and in some cases post-transcriptional level (see review: (Kopitar-Jerala, 2017)).
1.1.1 Acute Inflammation
(see for review: (Osiecki, 2004)), rheumatoid arthritis (RA) (see for review: (Chimenti et al., 2015)) and Alzheimer’s disease (AD) (see for review: (Rubio-Perez and Morillas-Ruiz, 2012)).
1.1.2 Chronic inflammation
Chronic inflammation is a result of continuous drive of the adaptive immune system. Ineffectual efficiency in the dampening of pro-inflammatory signals sustains and perpetuates inflammation. This leads to failed tissue healing (see for reviews: (Lawrence et al., 2002, Maskrey et al., 2011)). Chronic inflammatory diseases remain a human, economic and social burden on a global scale. Examples of chronic conditions include arthritis. According to Arthritis Research UK, 400,000 people in the UK suffered from arthritis with 2.46 million sufferers of hip osteoarthritis in England (Arthritis Research UK, 2014). In England, the prevalence of coronary heart disease (CHD) remained at 3% and hospital admissions increased by over 46,000 between 2010 and 2014 (Bhatnagar et al., 2016). In 2012, CVD was the leading cause of death in women. England spent approximately £6.8 billion between 2012 and 2013 (Bhatnagar et al., 2015) highlighting the need to control these conditions. Both RA and CHD reflect a chronic inflammatory condition, through activation of a circuit of signalling molecules, which, via positive feedback mechanisms, perpetuate disease (see for reviews: (Chimenti et al., 2015, Kraakman et al., 2016)).
therapeutic targets to instigate the resolution phase by understanding the transition from acute to chronic inflammation.
1.2 Macrophages in inflammation
The immune cell of interest in the current study was macrophages. This project was carried out using the macrophage J774.2 cell line. These are semi-adherent macrophages obtained from BALB/C mouse which partially adhere to the surface of the flask but can also be grown in suspension. Monocytes are derived from bone marrow progenitor cells and move from the blood into specific tissues. Here, they differentiate into macrophages and survey their immediate surroundings. Macrophages are imperative in physiology and pathophysiology as they contribute to a multitude of bodily changes. These cells form part of the innate immune system and are present in essentially all tissues; serving a diverse range of functions (see for review:(Chen and Zhang, 2017)). One such function which highlights the relevance of macrophage is wound healing. Wound healing is comprised of 4 stages: haemostasis (blood clot), inflammation (activation of the immune cells), proliferation (proliferation of keratinocytes and fibroblasts) and remodelling (macrophage release enzymes which remodel the extracellular matrix). Removal of macrophages during the mid-healing stage impairs the process whilst inducing haemorrhages. This highlights the importance of macrophages here (see for review: (Hesketh et al., 2017)).
(see for review: (Oishi and Manabe, 2016)). Despite being present in the resolution phase of inflammation, macrophages have typically been observed as the pro-inflammatory immune cell that produce pro-pro-inflammatory cytokines and further activate other immune cells. In several chronic conditions, activated macrophages have been reported. Recent focus has been on macrophage phenotype present during the pro-inflammatory and resolution phase of inflammation.
1.2.1 Macrophage polarisation
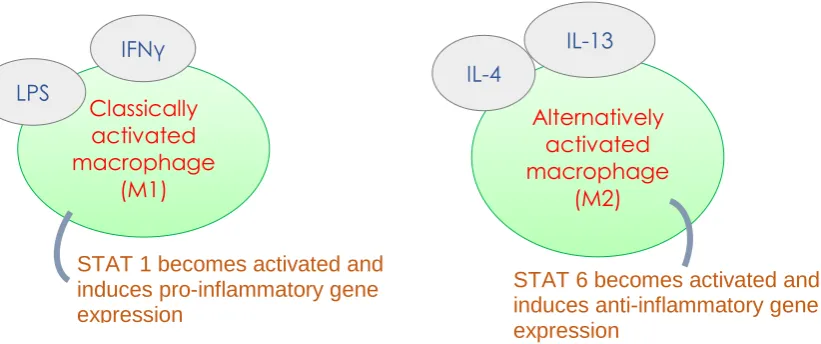
Figure 1.2.1.1: Diagram portraying the macrophage polarisation paradigm whereby macrophages take an anti-inflammatory or pro-inflammatory phenotype depending on the stimulus.
Interferon Gamma (IFNγ) and lipopolysaccharide (LPS) bind to their receptors, interferon gamma receptor and toll like receptor 4 respectively. This polarises the macrophages to classically activated M1 macrophages. This requires activation of STAT1. Alternatively activated M2 macrophage are obtained following IL-4 and IL-13 via STAT6 activation.
Both macrophage phenotypes express differential markers that facilitate the identification of the macrophage present (see for review: (Liu et al., 2014)); Following both in vivo and in vitro experiments, it has been suggested that the macrophage phenotype is dictated by the dominating inflammatory microenvironment (see for reviews: (Italiani and Boraschi, 2014, Van Overmeire et al., 2014)) which includes the cytokine profile (see for review: (Italiani and Boraschi, 2014)), lipid mediators (see for review: (Lawrence and Natoli, 2011)) and the other immune cells present (see for review: (Lawrence and Natoli, 2011, Italiani and Boraschi, 2014, Van Overmeire et al., 2014)). This highlights the role of the stimuli on the macrophage phenotypic nature.
Although cAMP was shown to be a critical determinant for the conversion of macrophages from a pro-inflammatory to an anti-inflammatory phenotype (Ghosh et al., 2016), this molecule was shown to be downstream to the initiation of resolution
Classically activated macrophage
(M1)
IFNγ
STAT 1 becomes activated and induces pro-inflammatory gene expression
LPS
Alternatively activated macrophage
(M2)
IL-4
STAT 6 becomes activated and induces anti-inflammatory gene expression
[image:19.595.82.493.71.243.2](Bystrom et al., 2008). Bystrom et al. (2008) used an in vivo model for acute inflammation and showed that the macrophages found during the resolution phase are the same as the cells that had migrated into the inflamed site during the pro-inflammatory phase (~24 hours from onset of inflammation). This was determined using the phagocyte-specific dye PKH26-PCLred and PKH26-PCLgreen, as a tool to identify macrophage trafficking. There appears to be a novel induction pathway for both macrophage phenotypes through the activation of specific transcription factors such as signal transducer and activator of transcription (STAT) (see for review: (Chen and Zhang, 2017)) (fig 1.2.1.1). Despite this M1 M2 paradigm, depending on the site of inflammation, a mixed population of macrophages was reported. This macrophage heterogeneity showed embryonic and haematopoietic macrophages each with different receptors (see for review: (Gordon and Pluddemann, 2017)). The adaptability and plasticity of macrophages came from their receptor repertoire and versatile responsiveness to heterogenic environments (see for review: (Geissmann et al., 2010)). Use of antibodies for these receptors have strengthened the notion for macrophage heterogeneity (see for review: (Gordon and Taylor, 2005)).
1.2.2 Signalling pathways involved in macrophage polarisation
becomes phosphorylated by JAK and dimerises; allowing translocation into the nucleus where it can drive the expression of pro-inflammatory genes.
To achieve the anti-inflammatory M2 phenotype, IL-4 (or IL-13) binds to its receptor. This activates JAK to phosphorylate and activate the STAT6 transcription factor which drives anti-inflammatory gene expression such as mannose receptor (see for reviews: (Lawrence and Natoli, 2011, Hoeksema et al., 2012, Tugal et al., 2013, Liu et al., 2014, Chen and Zhang, 2017). For robust polarisation to M2 macrophages by IL-4, cyclic adenosine monophosphate (cAMP) is critical, as it has been shown to increase expression of arginase (Arg-1) in microglial cells (Ghosh et al., 2016), and production of anti-inflammatory cytokines (Bystrom et al., 2008).
1.2.3 IL-4 signalling
IL-4 was initially regarded a stimulator of B cells and a survival factor for lymphocytes by protecting them from apoptosis (Luzina et al., 2012). Th2 cells, the analogy for M2 macrophages, produce IL-4, however, IL-4R was found on various cell types in addition to haematopoietic cells (Nelms et al., 1999). The tight control of IL-4 induced tissue repair was evaluated in bone marrow derived macrophages (BMDM), where apoptotic neutrophils were required for IL-4 mediated repair. Macrophages can detect these apoptotic cells by identifying phosphatidylserine (Bosurgi et al., 2017) which signals them to engulf the cells. This highlights the importance of IL-4 during the resolution of inflammation.
parasitic infection. These effects are primarily mediated via STAT6 transcription factor activation (Levings and Schrader, 1999). This cytokine regulates a profusion of biological functions e.g. proliferation and apoptosis. Thus, the pleiotropic downstream effects of IL-4 highlight its importance in immune responses. IL-4 has been reported to be protective in collagen induced RA murine models, which is an example of chronic inflammation (Morita et al., 2001), by dampening Th1 mediated responses. It mediates its effects via IL-4R which is expressed on a variety of haematopoietic and non-hematopoietic cells (see for review: (Zamorano J, 2003)).
The type 1 receptor consists of IL-4R with an α and γ chain. The IL-4Rα chain does not possess enzymatic activities until IL-4 activation. The γ chain associates with IL-4Rα following binding of the ligand. The heterodimerisation of the subunits initiate a signalling machinery via activation of kinases that associate with this complex.
1.3 Production of prostaglandins (PG)
In the early 1990s, lipopolysaccharide (LPS)-treated human monocytes in vitro (Fu et al., 1990) and mouse peritoneal macrophages in vivo (Masferrer et al., 1990) were shown to up-regulate PG synthesis in inflammation. Lipid compounds called prostanoids are derived from the poly-unsaturated fatty acid, arachidonic acid (AA). AA is enzymatically obtained from the phospholipid through cleavage by phospholipase A (PLA2). Prostanoids consist of PG, prostacyclin (PGI2) and thromboxane (TXA2). AA is metabolised by COX enzymes, also known as prostaglandin-endoperoxide synthase (PTGS). COX is an integral membrane glycoprotein that is abundant in the nuclear envelope and endoplasmic reticulum. COX has two active sites: the COX active site and the peroxidase active site (see for reviews: (Bjorkman, 1998, Simmons et al., 2004)). COX enzymes must be in their oxidised state to be active. Tyrosine-385 in the COX active site of the enzyme is oxidised by a tyrosyl radical (Hanel and Lands, 1982). This is generated at the peroxidase active site through the reduction of a lipid hydroperoxide (LHP) substrate. Constant supply of LHP therefore sustains COX in its oxidised state. This generates hydroperoxy endoperoxide prostaglandin G2 (PGG2) which is reduced to PGH2 via the peroxidase reaction. PGH2 is the precursor for the synthesis of PGE2, PGI2, PGD2, PGF2α and TXA2 which are ubiquitously produced and biologically active (Bjorkman, 1998).
of inflammation (see for review: (Ricciotti and FitzGerald, 2011)). PGE2 has been shown to have a key role in exudate formation in acute inflammation (Katori et al., 1998). PGD2 is predominant in the brain and is metabolised into the J series cyclopentanone PG (cyPG), 15-Deoxy-Delta-12,14-prostaglandin J2 15d-PGJ2, via a dehydration step (see for review: (Scher and Pillinger, 2005)). Thus, it is clear that there is temporal emphasis on PG synthesis and this is key to impacting the course of inflammation.
1.4 The discovery of the COX-2 protein and its role in inflammation
Two COX isoforms have been identified: COX-1 which is expressed constitutively and COX-2 which is inducible (Xie et al., 1991, Katori et al., 1998). Constitutive COX-1 has primary roles in physiological function such as gastric cyto-protection by producing PGE2 and PGI2 which mediate vasodilation and reduced gastric acid secretion (see for reviews: (Bjorkman, 1998, Simmons et al., 2004)). COX-2 enzymes are induced by pro-inflammatory cytokines and are highly expressed and active during the inflammatory response (Lawrence et al., 2002). Ongoing research has provided mounting evidence for the involvement of COX-2 in pyrexia, pain, CVD, cancer and AD (see for review: (Simmons et al., 2004)). This knowledge has been a key clinical advancement, as it provided a new drug target for several inflammatory conditions.
Figure 1.4.1: Diagram showing the induction of COX-2 when LPS binds to its receptor.
1.5.1 Biphasic expression of COX-2
In rat carrageenan induced pleurisy model for acute inflammation, during the early phase, high levels of PGE2 were observed followed by a shift towards PGF2α as the response waned (Capasso et al., 1975). This again, highlights the temporal factor of PG synthesis throughout the course of inflammation. Using the same model as Capasso et al. (1975), Gilroy et al. (1999) reported induction of COX-2 protein with maximal PGE2 release at 2 hours, where PMN leukocytes are dominant. This was followed by marginal PGE2 synthesis and a second peak in COX-2 protein expression at 48 hours; 350% greater than that observed at 2 hours. This biphasic paradigm of COX-2 induction was previously reported in chicken embryo fibroblasts (CEF) at 1 hour and again to a higher level at 4 hours (Xie et al., 1991). This again highlights the temporal regulation on the expression of COX-2. Gilroy et al. (1999) showed that PGD2 and 15d-PGJ2 levels peaked at 2 hours followed by a decline during the course of inflammation and a subsequent incline at 48 hours. It is yet to be clarified, whether endogenous concentrations of 15d-PGJ2, being a natural ligand for peroxisome proliferator activated receptor gamma (PPAR), initiates an anti-inflammatory route for COX-2 function. Bystrom et al. (2008) reported COX-2 expression on what was regarded as resolution macrophages, despite its expression being observed on pro-inflammatory macrophages (see for review: (Sica and Mantovani, 2012)).
1.5.2 COX-2 inhibition amplifies inflammation
was detected at 48 hours with reduced 15d-PGJ2 levels, following treatment with NS-398. The authors were unable to detect COX-1 and suggested late induced COX-2 to govern the resolution phase. These findings agree with Chan and Moore (2010) who reported COX-2 mRNA to be elevated during the resolution phase in murine collagen induced arthritis, another inflammatory model. NS-398, given in early stages, attenuated arthritic symptoms while inflammation was perpetuated when given in later stages (Chan and Moore, 2010). These key findings emphasise the temporal importance of COX-2 expression and the time of NSAID administration.
Pulmonary expression of COX is elevated in ovalbumin induced allergic inflammation and it was commonly conceived that COX products had pernicious effects on the lung. Despite this, PGE2 was found to subdue immunoglobulin (Ig)E production and block allergen induced asthmatic responses (Gavett et al., 1999). Lungs from COX-2 deficient mice exhibited inflammation of greater intensity compared to the wild-type mice. These mice also displayed impaired alveolar septae. When measuring the degree of lung inflammation, it was evident that COX-2 deficient mice had a significantly greater degree of lung inflammation (Gavett et al., 1999). This was in many ways similar to work carried out by Wallace et al. (2000). Wallace et al. (2000) showed COX-2 derived PG to contribute to the gastric defense system. It was made clear that non-steroidal anti-inflammatory drug (NSAID) blockage of COX-2 as well as COX-1 contributed to mucosal damage. Collectively, these studies highlight the role of COX-2 and PGE2 in the resolution of the acute inflammatory response.
dextran sodium sulfate (DSS) induced colitis. COX-2 deficiency showed reduced PGE2, as expected. Morteau et al. (2000) found lack of COX-2 to accelerate severe colitis, as shown by aggressive injury; whilst also increasing death. This may have been driven by COX-2 deficient IL-1β induction, which is produced as part of the innate immune response (Morteau et al., 2000). Morteau et al. (2000) predicted that COX-2 derived PGE2 is therefore critical in aggressive colitis, as it assists with the healing process and encourages mucosal protection.
Skeletal muscle cells that were exposed to palmitate and NS-398 exhibited increased levels of IL-6 and TNFα mRNA with reduced PGE2, compared to cells treated with palmitate alone (Coll et al., 2010). Furthermore, when PGE2 was co-treated with NS-398 and palmitate, induction of nuclear factor kappa B (NFκB), a transcription factor involved in pro-inflammatory pathways, was attenuated. This was not observed in the absence of PGE2,thus suggesting PGE2 to mediate this anti-inflammatory effect. PGE2 was also able to reduce TNFα when these cells were treated with NS-398 and palmitate. Coll et al. (2010) proposed that increased AA, due to blockage of COX, was available to be metabolised into 12-hydroxyeicosatetraenoic acid (12-HEPE) which evokes pro-inflammatory effects (Coll et al., 2010).
1.6 Sensitivity of COX-2 for inhibition 1.6.1 Inhibition of COX-2 by acetaminophen
Simmons et al. (1999) gave evidence for acetaminophen (paracetamol) to inhibit diclofenac induced COX-2 activity in a dose dependent manner; however, this effect was not observed in LPS-induced COX-2. Furthermore, LPS induced COX-2 was more sensitive to NSAIDs compared to the diclofenac induced COX-2 (Simmons et al., 1999). Ten years later, Ayoub et al. (2009) observed comparable findings, suggesting two induced COX-2 proteins which possess different selectivity for inhibition.
COX-2, in J774.2 macrophages to be inhibited by acetaminophen regardless of the LHP tone (Ayoub et al., 2011). A high LHP tone induced by J774.2 macrophages treated with diclofenac and a LHP donor (T-butyl hydroperoxide), did not antagonise the inhibition of diclofenac induced COX-2 by acetaminophen. On the other hand, acetaminophen did not inhibit LPS-induced COX-2 where the LHP remained relatively low (Ayoub et al., 2011). NSAIDs, however, behaved as potent inhibitors of LPS induced COX-2 but not diclofenac induced COX-2 (Simmons et al., 1999). This suggests that diclofenac induced COX-2 may be biochemically different hence the differential selectivity for inhibition by acetaminophen.
1.6.2 Inhibition of COX-2 by Indomethacin
COX-2 is the target for NSAIDs and has been accepted in the medical community for the treatment of chronic inflammatory diseases (Maskrey et al., 2011). The clinical efficacy of NSAID and their inhibitory properties on prostanoids stress the precedence of these mediators in pain, fever and inflammation (see for review: (Ricciotti and FitzGerald, 2011)). This class of drugs produce both therapeutic (Katori et al., 1998, Kotilinek et al., 2008) and toxic activities (see for review: (Hoppmann et al., 1991)) by inhibiting PG synthesis.
therapeutic aspect of aspirin was targeted by the pharmaceutical industry. To this end, indomethacin was produced to serve this purpose. Inhibition of COX-1 by NSAIDs interfere with the cellular function and cause adverse side effects such as gastrointestinal toxicity (see for review: (Kawai, 1998, Ricciotti and FitzGerald, 2011)). Selective COX-2 inhibitors such as celecoxib, have been developed to achieve antipyretic, analgesic and anti-inflammatory effects, without the side effects seen with non-selective COX inhibition (Warner et al., 1999).
Wallace et al. (2000) confirmed that celecoxib inhibited COX-2 without impacting COX-1, while SC-560 inhibited COX-1 without impacting COX-2. Of interest, indomethacin, the drug used by Gilroy et al. (1999), was reported to inhibit COX-1 and COX-2 to similar amplitudes. Thus, indomethacin behaves as a pan COX inhibitor. Derivatives of indomethacin were found to bind to COX (Remmel et al., 2004). Although IL-1β and COX-2 were induced in pentylenetetrazole (PTZ) evoked seizures in zebra fish, exposure to indomethacin before PTZ treatment forced a down-regulation in both IL-1β and COX-2. Administration of indomethacin also reduced the behavioural signs associated with seizures (Barbalho et al., 2016). Thus, indomethacin was used in this project to inhibit COX-2.
1.6.3 Inhibition of COX-2 by dexamethasone
some other inflammatory conditions (see for review: (Coutinho and Chapman, 2011)). Furthermore, a drawback of cortisol and synthetic GC agents like DEX was that they produced therapeutic effects at supra-physiological concentrations therefore, adversities were ineluctable (see for review: (Punchard et al., 2004)).
GC exerts its effects by binding to glucocorticoid receptor (GR) which behave as a regulator of gene expression. GR homodimerization allow it to bind to GC-response elements (GRE)s. GR activation was reported to dampen PPARγ expression (Inoue et al., 2000), a receptor which was shown as a requirement for COX-2 induction by diclofenac (Ayoub et al., 2009). It is believed that GC mediated immunosuppressive effects are attributed to repressed transcription of immunomodulatory factors such as NFκB. GC reduce vasodilation and oppose increased permeability which is seen during inflammation. Furthermore, GC was reported to reduce leukocyte emigration (see for review: (Coutinho and Chapman, 2011)). DEX exerts some of its anti-inflammatory effects, such as IL-10 production, via phosphorylation of ERK (Xia et al., 2005). GC induced IL-10 has been commonly noted in monocytes and macrophages (see for review: (Coutinho and Chapman, 2011)). Furthermore, it remains enigmatic whether IL-10 is produced because of GC induced differentiation or whether this IL-10 amplifies some of GC effects (see for review: (Coutinho and Chapman, 2011)).
chemokinesis and chemoxtaxis; thus, positing its anti-inflammatory effects are mediated by impacting the cytokine release. Therefore, DEX may exert its anti-inflammatory effects on COX-2 in a similar manner.
On top of the anti-inflammatory role of DEX, this GC has also been associated with COX-2. Masferrer et al. (1992) gave evidence for DEX to regulate only inducible COX in sham-adrenalectomised kidneys. This steroid had no effect on the constitutive COX. LPS is an entrenched inducer of COX-2. Typically, DEX has been regarded to work antagonistically to LPS induced effects (Fu et al., 1990, Barrios-Rodiles and Chadee, 1998, Inoue et al., 2000, Abraham et al., 2006, Yano et al., 2007). As such, DEX blocks COX-2 induction (Barrios-Rodiles and Chadee, 1998). As we characterize the LPS induced ‘early COX-2’ and the ‘late COX-2’ as different, the effect of DEX on these two inductions of COX-2 is key.
1.7 Transcription factors involved in COX-2 induction
The transcription factors NFĸB and PPARγ are believed to be involved in COX-2 protein induction, depending on the stimuli (Ayoub et al., COX-2009). NFĸB was shown to shut down PPARγ (Chistyakov et al., 2015) suggesting a paradoxical relationship as both transcription factors are associated with the induction of COX-2.
1.7.1 NFĸB in inflammation
(IĸB) kinase (IKK) phosphorylation-directed degradation of IĸB activates NFĸB which translocates to the nucleus and induces pro-inflammatory gene expression. Such target genes include TNFα and IL-1 which contribute to tissue damage (see for review: (Luo and Zhang, 2017)). Through a positive feedback program, TNFα increases NFĸB by binding to the TNFα receptor (see for review: (Luo and Zhang, 2017)).
1.7.2 PPARγ transcription factor
PPARγ is one of three types of steroid nuclear receptors with roles in glucose metabolism and inflammation. Following activation, PPAR-γ forms heterodimers with retinoid-X receptor to drive gene transcription and has pro-apoptotic properties (Wick et al., 2002). A class of drugs, called thiazolidines, are used in the treatment of diabetes. These drugs primarily increase insulin secretion from the pancreas by targeting PPARγ.
Low levels of PPAR-γ have been reported in unstimulated macrophages followed by a subsequent increase in activated peritoneal macrophages (Rossi et al., 2000). In AD brains, increased hippocampal PPARγ during inflammation was suggested to be a compensatory mechanism for a decrease in anti-inflammatory mediators (Wang et al., 2014). This suggests a potentially anti-inflammatory role for this receptor in inflammation.
2012, Tugal et al., 2013)). Furthermore, IL-4 induced STAT6 activates kruppel-like factor 4 (KLF4), another transcription factor. This was found to induce PPARγ (Liao et al., 2011) (see for reviews: (Sica and Mantovani, 2012, Tugal et al., 2013)). Thus, whereas LPS reduced KLF4, IL-4 significantly increased this (Liao et al., 2011); reiterating a signalling pathway between IL-4 and PPARγ. STAT6 deficiency stops the ability to inhibit pro-inflammatory cytokines such as TNFα (Levings and Schrader, 1999) and showed the inability to express M2 markers such as Ym1 (Szanto et al., 2010) (fig 1.2.2.1). Similarly, KLF4 deficient macrophages significantly reduce PPARγ levels (Liao et al., 2011). This emphasises the anti-inflammatory role of both IL-4 and PPARγ in inflammatory cell phenotype.
IL-4 binding to its receptor has been shown to increase 12/15-lipoxygenase activity which produces the endogenous ligand for PPAR-γ, 15d-PGJ2 (Szanto et al., 2010). Interestingly, repression of LPS-induced NFkB transcription was noted in the presence of PPAR-γ and the COX-2 product, 15d-PGJ2, which activates PPAR-γ (Ricote et al., 1998). This implies a signalling axis between the anti-inflammatory cytokine and nuclear receptor that shuts down the pro-inflammatory transcription factor NFĸB.
1.7.3 Relevance of PPARγ and NFĸB in COX-2 induction
only induce COX-2 at 48 hours and this COX-2 was termed the ‘late COX-2’ (Ayoub et al., 2009). In the diclofenac induction of COX-2 pathway, NFkB inhibition had no notable effect on COX-2 expression but blocked LPS induced COX-2 (Ayoub et al., 2009). The PPARγ antagonist, Bisphenol A diglycidyl ether (BADGE), reduced diclofenac, but not LPS-induced COX-2 expression. These results suggest PPARγ is required for diclofenac-induced COX-2 protein induction while NFĸB is key in the LPS pathway leading to the expression of COX-2 (Ayoub et al., 2009). This study along with research conducted by Gilroy et al. (1999) and Lawrence et al. (2001) provide compelling evidence towards a pool of ‘late COX-2’ distinct from the ‘early COX-2’.
1.8 Mediators involved in the induction of COX-2 1.8.1 Mitogen-activated protein kinases (MAPK)
growth factors, hypoxia, ischaemia and cytokines (see for review: (Zarubin and Han, 2005(Huang et al., 2009)).
There are 3 evolutionarily conserved kinases which act in a sequential manner. MAPK, MAPK kinase (MAP2K) and MAPKK kinase (MAP3K). Following activation by a stimulus, example TNFα, MAP3K becomes activated. This phosphorylates ser/thre region and activates the MAP2K: either MKK3 or MKK6. MAP2K activate p38 via phosphorylation. This phosphorylation occurs on the activation loop at the Thr-Gly-Try motif. Activated p38 phosphorylates and activates MAPKAPK-2 (MK2), MAPKAPK-3 (MK3) as well as various other transcription factors. These are collectively termed MAPK-activated protein kinase (MAPKAPK).
1.8.1.1 p38 MAPK
A large body of evidence pointed towards p38, specifically the isoform, to be pro-inflammatory. This led p38 to be considered as a promising drug target in chronic inflammation. Korb et al. (2006) used immunoprecipitation to show the and isoform to be activated and expressed in RA synovial fluid but not in the control. The compound SB203580 acts as a specific competitive ATP binding inhibitor for p38 α and β (Davies et al., 2000).This compound has been used in animal models for RA, AD, inflammatory bowel disease among others, due to its ability to reduce pro-inflammatory cytokine expression (see for review: (Kumar et al., 2003, Fisk et al., 2014)). Nevertheless, safety risks reflected p38 MAPK as a poor therapeutic target (Denise Martin et al., 2012).
p38 MAPK has been associated with PPARγ making it highly relevant in this project. Schild et al. (2006) showed that p38 inhibition reduced PPARγ activity in human primary trophoblasts whereas PPARγ did not affect p38 MAPK expression. Moreover, p38 was required for PPARγ stability as p38 inhibition reduced the expression of this transcription factor. Thus, Schild et al. (2006) gave evidence for p38 MAPK to regulate PPARγ expression and activity. Correspondingly, both Yano et al. (2007) and Chistyakov et al. (2015) corroborated the regulatory control of p38 on PPARγ because the introduction of SB203580 inhibited PPARγ.
1.8.2 cAMP as a second messenger
PGE2 is a ligand for G protein-coupled receptor (GPCR). Being a product of COX-2, it is believed to possess pro-inflammatory properties. Binding of PGE2 to its 7 transmembrane-spanning GPCR leads to the exchange of a phosphate molecule from guanine triphosphate (GTP) to guanine diphosphate (GDP). The ligand binding forces a conformational change and the disassociation of G protein alpha subunit (Gαs) from the β and γ subunit; which, activates adenyl cyclase (AC). AC is responsible for the generation and modulation of cAMP by catalysing the conversion of adenosine triphosphate (ATP) to cAMP (see for review:(Serezani et al., 2008, Yan et al., 2016)). Activated cAMP can bind the regulatory subunit of protein kinase A (PKA). The catalytic subunit of PKA serves to phosphorylate serine and threonine sites of target cAMP response element binding proteins. H89 is an inhibitor of PKA which blocks LPS induced PGE2 and blocks MAPK by inhibiting the CREB mediated mRNA (see for review: (Yan et al., 2016)). Thus, the significance of cAMP in both PGE2 and p38 mediated effects, makes this molecule key in the project.
1.8.2.1 The role of cAMP in macrophage polarisation
macrophage phenotype to be altered by variations in the intracellular cAMP levels by using agonists. The conversion from M1 to M2 may be mediated by PKA, as PKA specific cAMP analogs co-treated with IL-4, induced Arg-1 in M1 microglial cells (Ghosh et al., 2016).
It is evident that cAMP provides synergism with IL-4 in polarising macrophages from an M1 to an M2 phenotype. This gave impetus to further understand the relevance of cAMP in macrophage polarisation and the expression of COX-2 in the anti-inflammatory macrophages.
(Ratcliffe et al., 2007). Collectively, this shows a strong and potentially significant relation between COX-2 induced PGE2, EP4 and cAMP.
1.9 Hypothesis
Selective inhibition of the late induced COX-2 but not the early COX-2 by acetaminophen in vitro, suggests the two COX-2 proteins to possess different biochemical properties. Opposing responses from in vivo inhibitory experiments leads us to believe these COX-2 proteins are in fact different; with tight temporal regulation for expression in vitro. We believe that the induction pathway for COX-2 by IL-4 is different to the classical LPS induced COX-2 induction pathway. Despite p38 commonly being associated with COX-2 in pro-inflammatory pathways, we sought to find an anti-inflammatory role for p38 in IL-4 induced COX-2. Furthermore, interest in PPARγ developed from its requirement for the induction of COX-2 by diclofenac. As both diclofenac and IL-4 induce COX-2 at a later time point, we hypothesise PPARγ to also be a requirement for IL-4 induced COX-2 in vitro. We hypothesise the nature of the COX-2 to be dependent on the microenvironment and phenotype of the macrophages present. As such, we believe p38 and PPARγ to also be required for the production of the anti-inflammatory cytokine, IL-10. The relevance of cAMP in macrophage polarisation has been well established. In this project, we predict cAMP to be relevant for the induction of COX-2 by IL-4 in macrophages that we assume to be anti-inflammatory.
1.10 Aims and objectives
dependent on both p38 MAPK and PPAR-γ. Understanding this will facilitate our understanding on how resolution fails in chronic inflammation. Furthermore, the dependency of p38 and PPARγ to induce a catalytically active COX-2 with anti-inflammatory properties, will open new drug targets.
This study aimed to draw parallel between the induction of COX-2 and the polarisation state of the macrophage. Accordingly, this work will analyse the effect of COX inhibition by an NSAID and GC on the polarisation state; as defined by the cytokine profile of the macrophage. The role of cAMP in both the LPS induced pro-inflammatory pathway and the IL-4 induced anti-pro-inflammatory pathway will be examined.
1) Identify an endogenous inducer of a late COX-2 protein in macrophage J774.2 cells.
2) Analyse the sensitivity of inhibition for COX-2 that is induced by LPS, diclofenac and IL-4 in an attempt to identify the potentially different biochemical properties.
3) Determine the sequence of events that lead to the activation of COX-2 and the production of PGE2 by IL-4.
4) Clarify the role of cAMP in COX-2 induction by IL-4.
5) Confirm the effect of both LPS and IL-4 on the cytokine profile of the macrophage as a measure of the phenotype.
Chapter 2: Methods
2.1 Cell Culture
2.1.1 General maintenance of the macrophage J774.2 cells
All cells were cultured in` the same way unless otherwise stated. Macrophage J774.2 were grown in Dulbecco's modified eagle medium (DMEM) (Lonza) that contained high glucose (4.5g/l), 10% fetal bovine serum (FBS) (Sigma), 5% antibiotics (penicillin and streptomycin) and antifungal (Amphotericin B) (Sigma). To dislodge cells from the surface of the flask, scrapers were used. The content was spun at 500g at 4°C for 5 minutes. The supernatant was decanted and the pellet re-suspended in a volume of DMEM. A percentage of this volume was distributed into new flasks for sub-culturing or experimental purposes. The flasks containing the cells were placed in incubators with the following conditions at all times: 5% CO2, 5% humidity and 37°C.
2.1.2 Experimental cell stimulations
Depending on the nature of the experiment and the required total cell number, either a T25 flask or plates with 6 or 24 wells were used. In T25 flasks, 2.5x10⁶ cells were added while in 6 and 24 well plates, 9.5 x 10⁵ and 1.9 x 10⁵ cells were added respectively following counting of the cells with Trypan blue (Sigma). Trypan blue was used to ensure the right number of viable cells were available for the stimulations per experiment.
in pharmacological experiments, when measuring the dose dependent effect of drugs, a range of concentrations were used and this is stated in the results chapters. Once these stimulants were added, cells were harvested at the end of 24 or 48-hour incubations, unless otherwise stated. To obtain a cell pellet, post-stimulation, the cells were scraped and spun at 500g at 4°C for 5 minutes. The supernatant was decanted and a volume of phosphate buffered saline (PBS) was used to re-suspend the pellet. Cells grown in T25 flasks were re-suspended with 500μl PBS while cells grown in plates were re-suspended with 200μl PBS, to prevent over-dilution. The cells were
spun at 500g, at 4°c for 5 minutes and the cell pellet was stored at -20C.
For experiments where the supernatant contents were measured, the medium post stimulations, were collected in Eppendorf tubes and stored in -80C until use. The cell pellet was obtained from these samples to standardise supernatant content to protein concentration.
2.1.3 Inhibitory assays
In COX-2 activity inhibitory assays, the relevant inhibitor was added at the end of the 24 and 48-hour stimulation. Firstly, at the end of the 24 and 48-hour stimulation, the supernatant was removed with the detached cells and serum-free media was added to the wells for 5 minutes. Serum-free media was added to ensure all the residual diclofenac was washed off. This step was also included in LPS and IL-4 treated cells to maintain consistency in the steps. The plate was placed in the incubator for 5 minutes. Subsequently, this media was removed and the inhibitor, prepared in DMEM immediately before use, was added for 30 minutes. This was followed by the addition of the inhibitor made in medium, with 30μM arachidonic acid, also prepared in DMEM, for 15 minutes. The supernatant was collected and immediately stored in -80C until further analysis.
2.2 MTT assay
cells are incapable of converting MTT to formazan therefore, the colour change is not visible.
Following on from cell stimulations as indicated in the relevant results chapters, 10μl of 5mg/ml (prepared in PBS) MTT (Sigma) was added to 100μl medium in each well. This was incubated for 2 hours at 37°C, 5% CO2. The contents of the wells were removed and 100μl DMSO was added to each well and mixed thoroughly. The plate was covered in foil until the absorbance was measured at 570nm. The MTT assay was carried out 4 times to determine whether any of these compounds have toxic or proliferative effects on the macrophage J774.2 cell line.
2.3 Bradford assay
Cells were lysed using a mammalian cell lysis kit (Sigma) with protease inhibitor cocktail (Sigma). Following copious preliminary experiments, it was concluded that a total volume of 100μl and 250μl cell lysis buffer was quintessential for cell lysis
obtained from a 24-well plate or T25 flask respectively. The cell pellets stored at -20C (see 2.1) were re-suspended in either 100 or 250μl cell lysis buffer, depending on the starting number of cells. This was left on a shaker on ice for 15 minutes, as per manufacturer’s guide. Following this, samples in cell lysis buffer were added to 4x sample buffer (Biorad) with dithiothreitol (DTT) (Biorad) at a 3:1 ratio to make a total volume of 200μl. The remaining sample in cell lysis buffer was used to measure protein concentration.
2.4 SDS-PAGE and Immunoblotting
Cells were grown in T25 flasks and stimulated for the appropriate time course. For SDS-PAGE analysis of cell lysates, cells were scraped and then spun (see 2.1) before being stored at -20C until use. The pellet was re-suspended in cell lysis buffer for 15 minutes on ice (see 2.3). A proportion of this content was used to assay for protein concentration using Bradford reagent (Bio-Rad) (see 2.3); while the remaining was added to 4x sample buffer (Bio-Rad) containing DTT at a 3:1 ratio. The samples in sample buffer were placed in a thermomixer and heat blocked for 5 minutes at 100C to denature the proteins.
The protein samples were separated by SDS-PAGE using the Mini-PROTEAN 3 gel electrophoresis system (Bio-Rad). The resolving gel was prepared immediately before use, using 3.33ml protogel 30%, 2.5ml 4x resolving buffer, 4.06ml deionized water, 1μl of 10% ammonium per sulfate (APS) per 100ml and 0.1ml tetramethylethylenediamine (TEMED) per 100ml solution. Once the resolving gel solidified, the stacking gel was prepared using 1.3ml protogel, 2.5ml protogel stacking buffer, 6.1ml deionized water, 0.05ml 10% APS and 0.01ml TEMED, and added on top of the resolving gel with 10 well combs. The gels were placed in the tank and filled with running buffer. Twenty microgram proteins were loaded on the 10% polyacrylamide gels.
weight in the sizes: 250, 150, 100, 75, 50, 37, 25, 20, 15, 10 kDa.
After SDS-PAGE, proteins were transferred from gels to 0.2m pore size polyvinylidene difluoride (PVDF) (G E Healthcare) using the wet transfer method. The transfer buffer constituted of 24mM tris base, 194mM glycine and 10% methanol made in water. A filter sandwich method was used where at the cathode end, a sponge was placed followed by cellulose blot paper (Bio-Rad). On top of this, the SDS-PAGE gel was placed with PVDF that had been activated with 100% methanol. Finally, another cellulose blot paper was added followed by a sponge at the anode end. This transfer sandwich was assembled whilst totally immersed in transfer buffer. The sandwich was secured in cassettes after air bubbles were removed. Ice blocks were added to prevent the cassette from overheating. The cassette was placed in a Mini Trans-Blot electrophoretic transfer cell (Biorad), and run at 100V for 60 minutes. Membranes containing the transferred proteins were referred to as blots.
which the primary antibody was raised (see 2.10). After washing the membranes with wash buffer (3 x 5 minutes), the membrane was visualised using enhanced chemiluminescence (ECL) (Bio-Rad) using a developer (Bio-Rad).
Following 5-minute incubations with ECL, blots were placed in a gel imaging system (Chemidoc). Initially, the ladder was scanned using a colometric auto-exposure setting to ensure the band analysed is of the correct molecular weight. Secondly, a high sensitivity setting was used to scan for specific protein bands between 1 and 300 seconds of exposure.
2.5 Enzyme immunoassay (EIA) for PGE2 quantification
At the end time point for the cell stimulations, serum-free media was used to wash the wells of the 24 well plate. This was incubated at 37C, 5% CO2 for 10 minutes. The media was aspirated and 30M arachidonic acid (Sigma) was added to each well and incubated for 15 minutes (see 2.1). The plate was placed on ice to collect the media into Eppendorf tubes and stored in -80C until the day of analysis. The plates were stored in -20C until the Bradford assay was conducted (see 2.3). In inhibitory assays, after serum-free media was used to wash the wells, the appropriate concentration of inhibitor was added to each well for 30 minutes. This was followed by the simultaneous addition of the inhibitor with 30M arachidonic acid for 15 minutes (see 2.1). At the end of this incubation, the media and plate was stored as mentioned above.
samples and PGE2 acetylcholinesterase (AChE) conjugate (PGE2 tracer), which is constant in all the wells, determines the concentration of PGE2 in each treatment group. Thus, the PGE2 concentration is inversely proportionate to the amount of PGE2 AChE conjugate that binds to the antibody. The antibody bound PGE2 can bind to the goat anti-mouse IgG antibody coated in each well. Ellman’s reagent contains AChe substrate which allows a colour change to be observed at 405nm after 1 hour of incubation.
Initially, standards from 15.6pg/ml to 2000pg/ml were made via a 1:2 serial dilution in EIA buffer. This was prepared using Ultra-pure water. Each tube containing the standards were vortexed thoroughly to ensure accuracy. The experimental samples were diluted between 1:10 to 1:50 in EIA buffer and vortexed to mix well.
To calculate the PGE2 levels per sample, the NSB value was subtracted from B0. This is referred to as the corrected binding. The NSB absorbance was deducted from absorbance values for standards and samples and divided by the actual binding and then multiplied by 100 to convert to percentage binding. This percentage binding value for the samples was calculated on Graphpad Prism using Log standard concentration and the percentage binding of the standards. The anti-log of these values gave the concertation of the samples. The concentration was multiplied by the dilution factor and divided by 1000 to express the PGE2 levels in ng/ml. Dividing this value by the protein concentration in the same samples allows the PGE2 levels to be expressed in ng/mg protein.
2.6 cAMP quantification
2.7 PPARγ transcription factor activity assay
Nuclear extractions were carried out on pellets made from the stimulations which were stored in -20° (see 2.1). Pre-extraction buffer containing DTT and protease inhibitor (AbCam) was used to resuspend the pellet and left on ice. The contents were vortexed and spun 500g, 4°C for 5 minutes. The pellet was resuspended with extraction buffer containing DTT and protease inhibitor cocktail in a 1:1000 dilution. The supernatant was used to measure the activity of PPARγ transcription factor via ELISA (AbCam).
2.5). The readings were divided by the calculated protein concentration.
2.8 Cytokine profile ELISA
TNFα and IL-10 levels were quantified with quantitative sandwich EIA (R&D Systems) using supernatants stored at -80°c. Plates purchased from R&D systems were coated with monoclonal antibodies for TNFα or IL-10. Standards were prepared from concentrations ranging from 15.6pg/ml-1000pg/ml for IL-10 ELISA and 10.9pg/ml-700pg/ml for the TNFα ELISA. Fifty microliters standards and undiluted samples were added to each well so the cytokine of interest can bind to the immobilised antibody. The plate was sealed with adhesive tape before placing it on a shaker for 2 hours at room temperature. The contents were aspirated and the plate was washed 4 times to remove all unbound substances. On the final wash, the plate was dabbed on a paper towel to remove excess wash buffer. One hundred microlite conjugated polyclonal antibody for mouse TNFα/IL-10 was added to each well and left on a shaker for 2 hours at room temperature. This was washed with wash buffer 4 times before adding 100μl of prepared substrate solution to each well for 30 minutes at room temperature; protected from light. This reaction produces a blue colour. Stop solution provided in the kit was added which allowed the wells to turn yellow. The colour intensity is proportionate to the amount of cytokine bound in the first step. This was read in a spectrophotometer at 450nm. All concentrations were divided by the protein concentration obtained from the Bradford Assay (see 2.3), to standardise the readings.
2.9 Statistical analysis
analysis of variance (ANOVA) was employed to measure any statistical difference between the average of the different groups; where more than 2 conditions were involved. This method of analysis was typically adopted when measuring the effect of multiple concentrations of a stimulant or drug on a particular occurrence.
Similarly, the unpaired T test was used to measure the mean between 2 groups. This was typically between a negative and positive control or vehicle control. Dunnett’s post hoc test was performed after the ANOVA to scrutinise deeply, whether the mean from each group was statistically different to the control group, thus the Dunnett’s post hoc test is a many-to-one comparison analysis.
2.10 Antibodies used in experiments:
Experiment Antibody Species Dilution Manufacturer
Western blots
Primary
Antibody
COX-2 Rabbit 1:1000 Cayman
Chemicals
β-actin Mouse 1:10,000 Sigma
Phospho-p38 Rabbit 1:1000 Cell signalling
Secondary
Antibody
HRP-conjugated
anti-Mouse
Goat 1:10,000 Cambridge
Bioscience
HRP-conjugated
anti-Rabbit
Goat 1:10,000 Cambridge
Bioscience
PPARγ
transcription
factor activity
assay
Primary
Antibody
PPARγ Rabbit 1:100 Abcam
Secondary
Antibody
HRP-conjugated
Anti-rabbit
Chapter 3: Induction of COX-2 in vitro with temporal variations
3.1 Induction of COX-2 by LPS and diclofenac with temporal variations There are 2 pools of COX enzymes: 1, the constitutive enzyme and COX-2, the inducible enzyme. COX are enzymatic proteins that are responsible for prostanoid synthesis. NSAIDs function by blocking COX-1 and COX-2 and therefore, PG production. These drugs have analgesic, antipyretic and anti-inflammatory properties. Despite the therapeutic effects, NSAID usage elicits a wide range of toxic side effects(Hoppmann et al., 1991, Katori et al., 1998, Kotilinek et al., 2008).