2018 International Conference on Modeling, Simulation and Analysis (ICMSA 2018) ISBN: 978-1-60595-544-5
Simulation and Visualization System of Power Grid Security Checking
Zhi-qiang WANG
1, Ying JIANG
1, Zhen CHEN
1and Yang YANG
21
State Grid Information & Telecommunication Co., Ltd. (SGIT), ZheJiang Branch, Hangzhou, ZheJiang, China, 310015
2
School of Automation, Nanjing University of Sci. & Tech., Nanjing, JiangSu, China, 210094
Keywords: Security checking, CIM, Simulation, Visualization.
Abstract. Power grid dispatching plays an important role in the safe and stable operation of power
grid. Integrated dispatching system monitor and analysis substation equipment, transmission equipment in a unified mode. Simulation model of power grid dispatching safety checking system is built, to realize the stability analysis and safety monitoring function for checking and validation. According to the grid’s CIM data, a node merging algorithm of network topology is proposed for building power grid topology rapidly. The power grid safety analysis and visualization platform is designed, with a graphical data management. The research results are applied in the State Grid Taizhou Electric Company dispatching integration system, and it works fine.
Introduction
Integrated dispatching system has been widely in power grid. The most common construction mode that integrated dispatching used is the one-to-one mode, namely a set of dispatching system and a set of control system corresponding to each other. The two systems run independently, assuming their respective task of dispatching and monitoring. The characteristics of the system architecture is simple and easy to implement; it is a typical model of the early integrated dispatching. As the scale of the power grid is more and more big, traditional one-to-one control integration mode can not meet the requirements of the safe and stable operation of power grid. Utilizing the principle of network technology in the set control system of data acquisition, dividing the original unified data acquisition system into several data acquisition subsystem, each of the subsystem share data acquisition task, namely introduced the mode of integrated dispatching system of city and country.
With the increasingly expands of power system scale, the data surge from the control center, an rapid analysis and evaluation of vast amounts of data has been the important technical problems of security checking system. Visualization technology provide a possible way to it, it can extract the concerned information rapidly and accurately in an intuitive, friendly and efficient way to complicated objective physical nature and law that hidden behind the data provided to workers. Recent research shows that the visualization technology has become one of the most important means to improve all kinds of electric power system analysis. Visual content mainly includes: the basic running data (power flow and node voltage, etc.), failure analysis and calculation results, the running status of important equipment, etc. The article developed a set of integrated visualization display platform of integrated dispatching system of city and country and realized the graphic display, graphical data management and plug-in tube.
The Security Check System Framework
Integrated Dispatching System
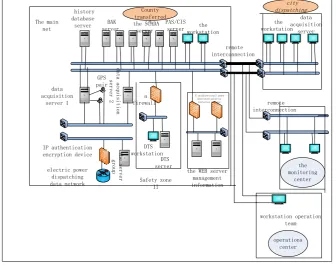
Currently, power grid dispatching mainly adopts the integrated dispatching system of city and county, the diagram of the structure is as follows:
can better use the original channel resources and avoid waste of resources, it can also save money. By forming a complete system on physical, so as to satisfy the city and county dispatching equipment resource sharing and resource load balancing requirements.
the monitoring center 。 。 。 。 。。 。 。 。 。 。 。 。 。 。 。 。 。 。 。 。 。 operations center County transferred history database
server server BAK the SCADA
server
PAS/CIS
serverworkstationthe
city dispatching the workstation data acquisition server remote interconnection remote interconnection
E unidirectional power dedicated security isolation devices a firewall DTS workstation DTS server Safety zone II
the WEB server management information electric power dispatching data network IP authentication
encryption device the
[image:2.595.130.467.115.380.2]se rv er gr ou p data acquisition server 1 GPS pair da ta a cq ui si ti on se rv er 2 The main net workstation operation team
Figure 1. County control integrated system structure.
Integrated dispatching mode makes the control center to grasp equipment operation information more timely, comprehensive, accurate, accident exception handling orders more efficiently. Shorten the management chain, the using of human resources efficiency is higher, the organizational structure is more compact, the expanding of monitoring scope will be more adapt to the rapid development of power grids and substations. The fusion of two modes of Integrated dispatching and Integration of city and country is complying with the new mode of development, having good features of practical and functional.
The Security Check Function of Integrated Dispatching System
The general functions of integrated dispatching system of city and countyinclude graphic tools, reporting tools, curvetools, commercial database services, real-time database model (database) management, power grid maintenance interface, alarm service, rights management, WEB browsing, CASE management, research tools, system management, etc. The functions which closely related to the security check features include:
(1) The function of advanced application software PAS: it is composed of six function modules, network topology, state estimation, dispatcher optional tidal current, load forecasting, static state security analysis and network equivalent, providing an interface support to reactive voltage optimization and control system.
(2) Web subsystem of EMS: has a dual function like data services and information release, using the ways of tight coupling and loose coupling to provide grid data access, these data include grid model information, real-time data, the operation of the historical datagrid, alarm grid and event data, etc. The data is completely work area of the EMS data image. At the same time, the use of the description of the storage data, graphicsdata, real-time data in the form of Web pages published grid operation of the relevant data.
simulation training system, providing EMS system which is completely consistent with actual application operating environmentfor dispatching and management personnel.
Power Grid Modeling Based on CIM
International electrotechnical commission IEC enacted IEC61970 standard makes it implement componentization when in the face of power system application software, It also reduce the system development costs and shorten the development time, it facilitate different manufacturer of energy management system (EMS) within each application integration, EMS system and other systems of dispatching center and the Internet model interchange between different dispatch center of EMS system. The Common Information Model CIM (Common Information Model) is the important basis of the standard, it is an abstract model, with the object classes, attributes and the relationship between them to describe electric power enterprises of various objects.
The Simulation Model of Power Grid Based on CIM
For the traditional DTS application, the CIM model can be used to describe the equipment, network, data, implement the DTS system based on CIM integration:
At present, the DTS integration of application of CIM has the following several solutions:
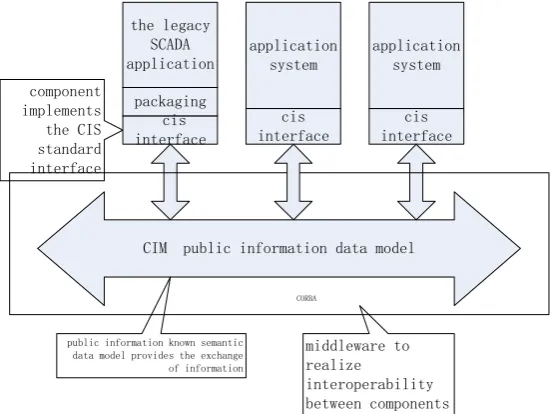
CIM public information data model component
implements the CIS standard interface
the legacy SCADA application
packaging cis interface
application system
cis interface
application system
cis interface
public information known semantic data model provides the exchange of information
middleware to realize
interoperability between components
[image:3.595.160.440.327.534.2]CORBA
Figure 2. Grid simulation modeling based on CIM.
(1) The CIM as a system of internal and external model, DTS platform using CORBA component containeras the system integration framework, DTS application completely designed according to component model, this practice did not absorb the original results, engineering pile; the cycle is too long.
(2) Packaging the original system as a whole, the whole system as a major component, it can be based on CIM import/export to solve the problem of interoperability between the systems, but it can't solve the application of DTS plug and play.
(3) The DTS platform completely based on CIM, using the object-oriented database management model, database definition with the CIM model, using CORBA middleware as a system integration framework, the original application of DTS by encapsulating access, reforming step by step, the natural connection of new applications according to the object-oriented component.
Topology Modeling Method Based on CIM
The grid a wiring processing into application in the analysis and simulation algorithm of computing nodes model and form a new form of network connection is the process of network topology. Literature [4] introduced a depth first search strategy based on adjacency matrix of network topology method, transformers and feeder as edge, with switch and T contact for node, connected relations through the subordinate relations to express, so get the grid node adjacency matrix of topological relations, finally using the algorithm of depth first to calculate. This approach requires repeated to search the node and the equipment, the low efficiency is suitable for network structure system which is more simple.
Online Safety Inspection
System implementation of online security check function mainly includes ground state power flow calculation, the static analysis and N - 1 check function.
The ground state power flow calculation and analysis got the voltage of each bus, the power distribution network. Giving an alarm when it harms the limit safety of the normal operation of power system. Dispatching personnel can through the power flow calculation of parameter configuration screen to manual control flow calculation more convenient and quickly. At the end of the calculation, it can through intuitive visual interface to view and analysis the result of the power flow calculation.
Analysis method is an important approach for the analysis of voltage stability, and PV curve analysis is one of them. Accurate to calculate the PV curves is very important in the study of power system static voltage security and stability; it can assess the voltage security problems under a certain voltage security and stability criteria and effective evaluation of the current system voltage stability margin. Through recent years’ research, the way to accurately calculate the PV curves mainly include method of load growth and continuous wave method, etc. The shortage of this method is when the load increases, system operation point gradually closes to the limit point, closing to the trend equation of Jacobi matrix singular, causing iterative convergence and unable to draw a complete PV curve. Continuous method was introduced in the 1990s used to track the PV curve calculation method of the nonlinear. By introducing a parameter change and d calibration equation, ingeniously eliminates the saddle node bifurcation point trend of jacobian matrix singular phenomenon. This characteristic enables the continuous wave method to be widely used in the calculating of PV curve.
The basis data platform of security check has already integrate SCADA/EMS and other resources, such as network parameters, network topology, bus node load data, combined with the power curve, the curve of load forecasting and maintenance plan, tie lines planning, such as data, N-1 check function according to the data after the data integration platform, N-1 open circuit scanning analysis, making the ground state and the breaking of the limited information and trends in a friendly way for dispatching personnel to consult. For grid security and stability checking and enhance the scientific nature, rationality of daily power generation plan, to ensure the safe and stable operation of power grid.
Visualization Platform for Security Check
In order to help scheduling personnel Intuitive and accurately grasp the security and stability of power grid, improving the level of power grid security monitoring, this paper designed a set of power system security analysis visualization system, itestablish a general, open platform for themain rack visualization, presenting a large, complex power grid information with vivid and effective means.
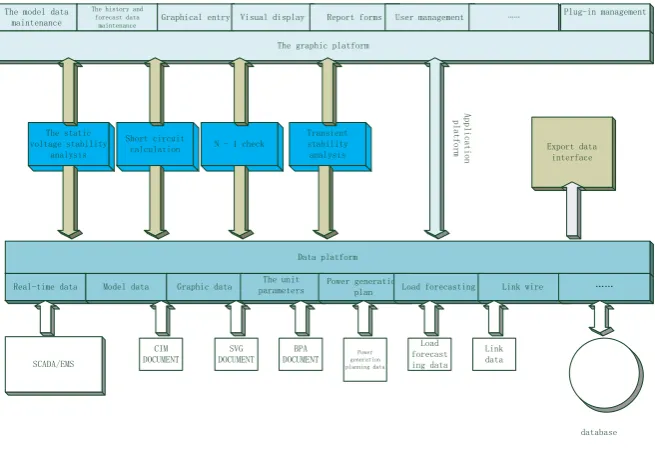
Overall Structure of the Visual Platform
automation system, data, graphics and without affecting security and stability of the operation of existing dispatching automation system. Adoption of SOA on the overall design system, visual display platform and business logic using plug-in architecture, making expansion of the business isolate with the function of platform and guarantee the function of platform under the condition of the continuous extension of business functions. The system architecture is shown as below:
Data platform The static
voltage stability analysis
Real-time data Model data Graphic data parametersThe unit Power generation plan Short circuit
calculation
Load forecasting Link wire …… N - 1 check
Transient stability analysis The model data
maintenance
The history and forecast data
maintenance Graphical entry Visual display Report forms User management ……
Plug-in management
The graphic platform
Export data interface SCADA/EMS CIM DOCUMENT SVG DOCUMENT BPA
[image:5.595.134.462.152.378.2]DOCUMENT generation Power planning data Load forecast ing data Link data database A p p l i c a t i o n p l a t f o r m
Figure 3. Grid security checking visual platform.
As the key part of visual intelligent dispatching system, power grid data visualization display platform adopts the plug-in architecture, namely basic visual representation of the environment, the reality of graphics, grid data acquisition, man-machine interaction function as a basic platform for the visualization, in this platform, building the interaction between the plug-in interface specification and develop visual display. Every visual display plugin through communicate with specific data provider, accordance with the determined business logic to defined visual display method, finally ,by calling the visualization platform provides a standard interface control of visual display. Visualization system is proposed for the theme of the visual display, based on the analysis of the huge amounts of state grid data according to the different sides by visual display platform, through specific means of visualization, showing the information on the dimension to the grid operator.
Security Check Visualization Platform Function
Security checking visual of SCADA system is deepening of monitoring functions, according to the region's operator’s attention to variables which can features grid security state, on one hand, adopting intuitive display to show the dispatcher to the operation situation of the above variables, on the other hand, according to this state to decide whether to start the monitoring auxiliary decision analysis. Visual results display mainly by means of three dimensional and alarm matters to the dispatcher feedback, let the operator have an accurately grasp of operation condition of power grid.
1) Real-time monitoring data of visual display
2) The man-machine interaction information statistics and visual display
Add the statistical computing subject in the visual interface in the form of theme plugin and provides support for operation statistics, based on the current of the selected application, implementation calculation and statistics of select data and visually show to dispatching or shipment party personnel, In order to make dispatching or party personnel state have a better understanding of the power grid. System need to realize the statistics, mainly realized query of load and the definition and monitoring of cross section.
Safety Checking Process
Security check visualization platform mainly contain data import editing, network topology modeling and visualization monitoring three basic functions. Data import function mainly involve data, load forecasting, power generation equipment information plan data and maintenance data. Network topology modeling is the core of data platform function, on the basis of cross section data, maintenance data and predicted data generation computing with the trend of the data. Visualization, including visualization scheme, system wiring diagram drawing, 3d graphics support and the alarm information management.
Data Import and Processing of Section
Data import subsystem including import of CIM model and BPA import generator unit parameters. Import of CIM model realizes importing the CIM/XML file into the system database, the database used to load the CIM specification data structure. Data refer to the 220 kv grid model data, 220 kv low voltage side model data and 110 kv transformer above all model data, including 110 kv transformer and 110 kv load. The import of BPA generator unit parameters realized BPA data imported into the system database, all the data of BPAinvolved.
System’s specified time intervals to form a cross section data, the data include the information of power grid topology, power grid operation of the current time (switch state and power data). Grid topology information is based on the switch of EMS system status information and equipment information, network topology analysis after the formation of the current section grid topology. The grid operation data provided by the EMS system and through the power system real-time data communication application layer protocol to realize the (DL476_92) real-time measurement data acquisition.
The section is divided into historical section and cross section. As the name implies, the history section refers to data section of the past time, namely power grid topology information and data is measured values in the past time. And predicting section refers to the power grid topology information reference some time in the past, using the section that formed by predictive power data.
Network Topology Analysis
In the CIM model, power system connection relationship is described by conductive device, endpoint, connection and the topological node. Join point is not actually exist in the physical equipment in power system, it just provide an associated equipment connection between nodes. Topological node is composed of a set of join points fusion and similar to "bus - branch" model of bus bar. Therefore, in the process of "transformation", all closed switch on both ends of the connection point in the grid can be merged into a bus topology node to create grid model. According to above analysis, the entire network topology analysis directly to all the closing of the switch in the power grid without the need for depth or breadth search, not only improved the efficiency of the network topology but also easy to realize principle.
properties need to be calculated based on the properties which CIM has given.
The Definition of Visualization Scheme
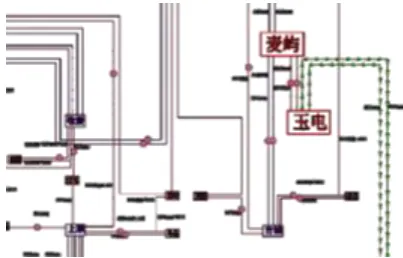
"Visualization scheme" refers to visualization option scheme which is set for a graphical platform, when platform choice and application of a set of visual solutions, it can be unified visual graphics of currently browsing option configuration, such as the scheme define results show: using the line associated flow arrow shows the active current and reactive current on the line, etc. the visual interface display as shown in Figure 4.
[image:7.595.192.394.261.390.2]Scheduling personnel can customize different display solutions and save it, in the process by selecting scheme file can be quickly cut between different display solutions, to change data which is shown on the platform. Visualization scheme information preservation using extensible mark language (XML) format, XML document notonly has a clear semantic but also structured, it has advantages of a simple, open, scalable, self-description, etc.
Figure 4. Grid tide visualization rendering.
Online Monitoring of Safety Check
For security check short-circuit calculation module can online application, fast computing system of all nodes three-phase short-circuit current level based on real-time state estimation data, real time data short-circuit current calculation results of each node can be on the system single line diagram by column graph visualization means such as direct display, it can also be in the form of a list of summary, It is convinent to use for personnel scheduling, according to the results with the combination of figure and text.
The analysis capabilities is also provide power grid real-time data by the data platform, generator dynamic parameters extracted from BPA data, data platform to establish library static parameters, the special maintenance of all units in the system dynamic parameters, such as transient reactance. This way also is able to provide data support for transient stability analysis and other functions.
Conclusion
Based on the research of Integrated dispatching system security check, the grid simulation model is designed according to CIM data. Introducing the realization of security monitoring mechanism, such as stability analysis, test and short circuit calculation, the network topology structure is built rapidly. A grid dispatching visualization platform with security analysis is developed, which has tested in ZheJiang Taizhou Electric Power Bureau. It not only provide a safety check to has a quantitative analysis of the results but also can provide intuitive 3d visualization, and has a good prospect of practical value and application.
Reference
[2] The W3C Recommendation. \"IEC61970-302, EMSAPI - Part302: Common Information Model (CIM) Financial draft\" [S].
[3] The W3C Recommendation. \"IEC61970-303, EMSAPI - Part303: Common Information Model (CIM) SCADA draft\" [S].
[4] Jia Yongwei, Kim wan chan. The electric power system based on CIM topology modeling of depth first search research [OL]. China science and technology papers online (2008).
[5] A. W. Quite, G. W. Ault, I. M. Elders, C. E. T. Foote et al., Translating CIMXML power system data to A proprietary format for system simulation [J] IEEE Trans. Power price, 19(1): 229 ~ 235 (2004).
[6] Yan-ping zhao. Power grid topology analysis based on CIM model [J] Journal of Anhui Technical College of Electrical Engineering, 11(1): 11 ~ 15(2006).
[7] Pradeep Y., P. Seshuraju, S.A. Khaparde et al. The CIM-based Connectivity Model for Bus - Branch the Topology Extraction and Exchange [J] IEEE the Transactions on SmartGrid,1 ~ 8(Mar. 2011).