2018 International Conference on Modeling, Simulation and Optimization (MSO 2018) ISBN: 978-1-60595-542-1
Optimal Repairman Assignment in Multi-level Repair Network for
Weapon System Based on Multi-agent Simulation
Shi-hui WU
1,*, Fa ZHANG
2, Zheng-xin LI
1and Xiao-dong LIU
11Equipment Management and UAV Engineering College, Air Force Engineering University,
Xi’an 710051, China
2Zhuhai College of Beijing Institute of Technology, Guangdong Zhuhai 519000, China
*Corresponding author
Keywords: Multi-agent simulation(MAS), Repairman assignment, Operational readiness rate (ORR), Optimization via simulation(OvS).
Abstract. Considering the complicated interactions among repairmen and spare parts in multi-level repair network, a multi-agent simulation (MAS) model is built to evaluate the system operational readiness rate (ORR) under certain repairman assignment. The MAS model treats all line replaceable units (LRUs), spare parts at each level, and repairmen as agents, which have their own properties and action rules that are designed by state charts and events. By means of optimization via simulation (OvS) tool, OptQuest in the software AnyLogic 7, the maximum ORR and the optimal repairman assignment at each level for certain amount of total repairmen are obtained. The optimal repairman assignment is determined as the amount of total repairmen increasing to a value that the corresponding maximum ORR reaches the required ORR level. At last, a three-level repair network experiment is carried out and the results demonstrate that the proposed method is feasible and more reliable and accurate than existing methods.
Introduction
Recent warfare illustrates the importance of quick repair and support system, which can restore the fighting capacity and seize the initiative during the war. The repairman assignment problem is one of the key issues for the repair and support system. Current maintenance scheme is usually a multi-echelon, multi-indenture (MEMI) spare parts repair and inventory system, and each repair level may need different amounts of repairmen to finish the repair tasks. As a result, good assignment of repairmen at different repair levels can lead to efficient repair work and keep the weapon system at a high operational readiness rate (ORR) by using minimum repairmen; on the contrary, a poor assignment of repairmen at different repair levels may lead to low utilities of repairmen.
The repairman assignment problem has been studied extensively. Many researchers have proposed different models to optimize this problem, such as queueing theory [1], nonlinear programming model[2], discrete event simulation[3], etc. For example, Wang et al(2007)[1] treated the maintenance system as M/M/C model of queueing theory, where the failed components are seen as consumer arriving events, and the repairmen are seen as servers, thus the problem to determine repairmen is transformed to determine the amount of servers of the queueing system. However, the basic assumption of queueing theory is that all components should follow same distribution rule, and the MTTR (mean time to repair) of repairman should also follow same distribution rule, which are not practical for the weapon system featured with many different components and different types of repairmen. Koole[4] assumed the times at which the repairman completes repair are generated by a Markov decision arrival process (MDAP). And Frostig[5] considered the time unit failure and its repair time are both exponentially distributed, and also uses Markov process to depict the repair process. However, these studies mainly focused on single echelon repair system.
independent issues. In fact, as main components of repair resources, both repairmen and spare parts are interacted, for instance, when the spare parts are sufficient, the operational readiness of the weapon can maintain a high level while the repairmen amount can be reduced. In other words, we should study repairman allocation problem while considering the spare parts. Especially for MEMI system, the interactions between spare parts in different levels and repairman in different echelons become so complicated that discrete event simulation [3] may not be able to handle it in detail.
In our paper, we developed a multi-agent simulation (MAS) model using AnyLogic 7, to determine the optimal repairman assignment schemes for multi-level spare parts repair and inventory system. The rest of the paper are organized as follows: In the following section, we give assumptions and simple introductions of the repair process for MEMI system, as well as the definition of operational readiness rate (ORR). The Model Design Section describes the MAS simulation design, where detailed agents and events design are illustrated, and the optimization procedure based on simulation is also presented. A numerical example is given to illustrate the method in the Experiments and Results Section. The final section summarizes this paper.
Problem Description
As stated earlier, current repair and support system for weapon equipment is a typical MEMI spare parts repair and inventory system, and in most cases it is a three-level repair and inventory system consisting of organization level (O_Level), intermediate level (I_Level) and depot level (D_Level), and each level includes a repair unit and an inventory unit. Figure 1 illustrates how the system works.
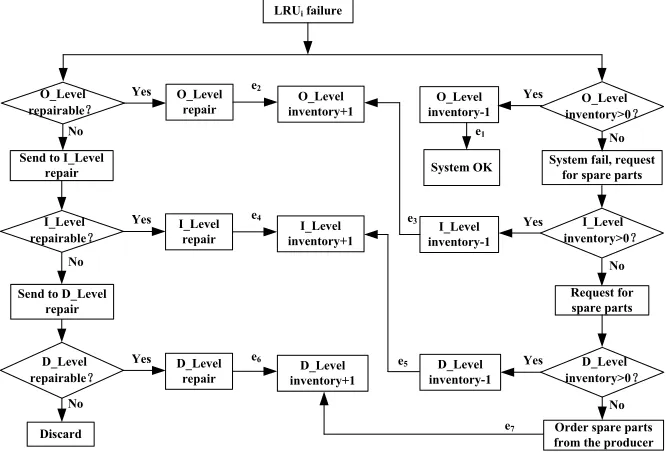
LRUi failure
O_Level inventory>0 Yes O_Level inventory-1 O_Level repairable No Yes O_Level
repair inventory+1O_Level
Send to I_Level
repair System fail, request for spare parts
I_Level inventory>0 I_Level inventory-1 No I_Level repairable Yes I_Level
repair inventory+1I_Level
Send to D_Level repair D_Level inventory>0 No D_Level inventory-1 D_Level repairable No Yes D_Level
repair inventory+1D_Level
[image:2.612.140.473.348.574.2]Discard from the producerOrder spare parts System OK e1 e2 e3 e4 e5 e6 e7 No Yes Request for spare parts Yes No
Figure 1. The flowchart to illustrate how a three-level repair and inventory system works.
In Figure 1, e1 means a spare part in O_Level inventory is used to replace the failed LRU, and the
system is OK; e2 means the failed LRU is repaired and stored in O_Level inventory; e3 means a spare
part in I_Level inventory is used to replenish the O_Level inventory that requested for spare parts; e4
means the failed LRU is repaired and stored in I_Level inventory; e5 means a spare part in D_Level
inventory is used to replenish the I_Level inventory that requested for spare parts; e6 means the failed
LRU is repaired and stored in D_Level inventory; e7 means the new bought spare part is stored in
D_Level inventory.
In the MAS model, we use the following equations to calculate ORR. Let A0 denotes the ORR of
O 0
O
( )
( ) ( )F
E T A
E T E T
. (1)
Where TO denotes the time that the system is workable, TF denotes the time that the system is in
failure, E(▪) denotes the mathematical expectation time (or mean time).
Here are some assumptions for the convenience of this study: 1. All spare parts are repairable;
2. Only corrective maintenance is considered, that is, there is no preventive maintenance;
3. One repairman can only repair one failed component at a time, and the repaired component is as good as new;
4. Each repair level uses (S1, )S inventory strategy, where S denotes the current inventory level.
When the inventory level is below S1, requests or orders for spare parts will send to the upper level
or the spare parts producer to make the inventory back to S.
Model Design
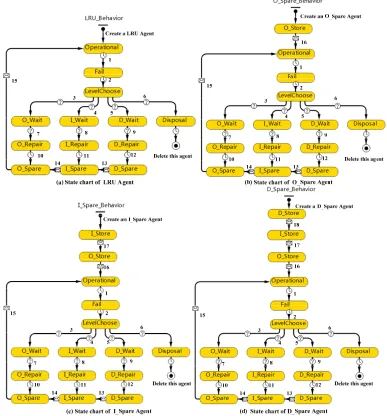
We build the MAS model using the software AnyLogic 7. According to different states experienced by LRU (line replaceable unit), spare parts and repairman, five agent types are designed: (1) LRU Agent represents LRUs on a weapon system; (2) O_Spare Agent represents the initial spare parts stored in the O_Level inventory; (3) I_Spare Agent represents the initial spare parts stored in the I_Level inventory; (4) D_Spare Agent represents the initial spare parts stored in the D_Level inventory; (5) Repairman Agent represents the repairman in each level repair unit.
Spare Parts Agents Design
State chart model describes what states an agent will experience during its life time, what actions it will take at each state, and what events will trigger state change. As we can see from Figure 2(a), LRU
Agent will go through the following states: (1) Operational means it is operational on the weapon
system; (2) Fail means it is in failure; (3) LevelChoose means it is under evaluation about the repair
level depending on failure mode; (4) O_Wait/ I_Wait/ D_Wait means it is waiting at O_Level/
I_Level/ D_Level repair unit; (5) Disposal means it is discarded; (6) O_Repair/ I_Repair/ D_Repair
means it is repairing at O_Level/ I_Level/ D_Level repair unit; (7) O_Spare/ I_Spare/ D_Spare
means it has been repaired and stored at O_Level/ I_Level/ D_Level inventory unit.
As shown in Figure 2(b), O_Spare Agent’s initial state is O_Store, which means it is in storage at
O_Level inventory unit. The state changes to Operational, when a same type working LRU is in
failure and replaced by this agent. The following state chart are the same as that of LRU Agent.
Similarly, as shown in Figure 2(c), I_Spare Agent’s initial state is I_Store, which means it is in
storage at I_Level inventory unit. The state changes to O_Store, when an O_Level inventory requests
for spare part to this I_Level inventory unit. The following state chart are the same as that of O_Spare
Agent. Also, in Figure 2(d), D_Spare Agent’s initial state is D_Store, which means it is in storage at
D_Level inventory unit. The state changes to I_Store, when an I_Level inventory requests for spare
part to this D_Level inventory unit. The following state chart are the same as that of I_Spare Agent. Active states will change when transitions are triggered. There are three trigger types: time out
( ), condition ( ), message( ). Transition1 is triggered by time out when a LRU fails according to
its failure time MTBF (mean time between failure) distribution, and it will trigger the event
needSpares. Transition2 is also triggered by time out for failure evaluation. Transition3 ~
Transition6 are triggered by condition, according to the probabilities of the repair levels, and the
transitions will delay some time for delivering this agent between O_Level to the chosen repair level.
When Transition6 is triggered, the event add_newSpare will also be activated. Transition7 ~
Transition9 are also triggered by condition, if there is at least one repairman in this level who is idle,
and when it is triggered, a message "Repair" will send to the repairman who is idle and capable of
message "Repair Finished" will send to the repairman agent who repairs the failed LRU. Transition13
and Transition14 are triggered by message, when the agent receives the message "Depot to
Intermediate Spare Part Replenish" for Transition13, or "Intermediate to Organization Spare Part
Replenish" for Transition14, and the transitions will delay some time for delivering this agent.
Transition15 and Transition16 are also triggered by message, when the agent receives the message
"Replacement". Transition17 and Transition18 are triggered by message too, when the agent receives
the message "Intermediate to Organization Spare Part Replenish" for Transition17, or "Depot to
Intermediate Spare Part Replenish" for Transition18, and the transitions will delay some time for
[image:4.612.111.498.191.607.2]delivering this agent.
Figure 2. State chart of LRU Agent and each spare part Agent.
Repairman Agent Design
There are only two states, Idle and Busy, for each repairman agent. As shown in Figure 3, the state of
the repairman agent will experience “Idle”, “Busy”, “Idle”, “Busy”, …, repeatedly till the simulation
19 20
Figure 3. State chart of Repairman Agent.
In Figure 3, Transition19 is triggered by message "Repair" from his or her repairable failed LRU
agent when it is assigned to this Repairman Agent, and Transition20 is triggered by message "Repair
Finished" from his or her repairable failed LRU Agent immediately after the repair work is done.
Event Design
Any Logic provides event module to control the process of the simulation. Here are some events designed in our model:
1. add_newSpare: this event is used for creating new D_Spare Agent when the D_Level inventory
is below save inventory. It is triggered by condition when D_Level inventory is in shortage.
2. needSpares: this event is used for replacing the failed LRU with a spare part when a LRU fails. It
is triggered by condition when a working component fails, that is, Transition1 is triggered. The event
firstly checks if O_Level inventory is available, i.e., a same type spare part agent is at the state of
O_Spare or O_Store. If the answer is yes, Transition15 or 16 will be triggered; otherwise, a request
for spare part is sent to its upper level inventory, I_Level inventory. If it is available in I_Level
inventory, a spare part agent with state I_Spare or I_Store will be selected to trigger Transition14 or
17; otherwise, a request for spare part is sent to its upper level inventory D_Level inventory. If it is
available in D_Level inventory, a spare part agent with state D_Spare or D_Store will be selected to
trigger Transition13 or 18; otherwise, the event add_newSpare will be triggered.
3. saveInventory: this event is used for judging the current inventory continuously to see if it is
below save inventory. The trigger type of this event is timeout TimeStep (the simulation time step,
and it can be one minute, or one hour, etc.), i.e., the event will be activated after every TimeStep
interval. The event will execute the following actions: calculate total inventory at this level, including current spare parts in storage, spare parts under repair and spare parts that have sent requests, if the sum is below save inventory, request for spare part will be sent to higher level inventory.
4. reset: this event is used for controlling the process of simulation. In other words, if the
simulation reaches total time, the ORR is calculated using Eq. 1, and the simulation returns to its initial conditions so that a new simulation will begin. When it reach the maximum simulation runs, this event will end the procedure.
Optimization via Simulation (OvS) Design
In this paper, we focus on determining the optimal repairman assignment with certain spare parts allocation. It is a typical OvS problem[6], and we use the commercial software OptQuest[7], which has been embedded into AnyLogic 7 as a plug-in for OvS to handle this problem.The whole optimization procedure is given as follow.
Step 1 Initialization. Let total repairman number n= N0, which is usually a small number. Step 2 Call the OvS model to determine the maximum ORR An with n repairmen.
Step 3 Judge if An≥A0 is satisfied. If the answer is yes, the required ORR level A0 is reached, and
the optimum result is obtained. Then output current total repairmen number n*, the optimal repairman
assignment at each level, and the corresponding ORR A*, and end the simulation. If the answer is no,
let n= n+1, i.e., add one more repairmen to the total amount, and go to Step 2.
Experiments and Results
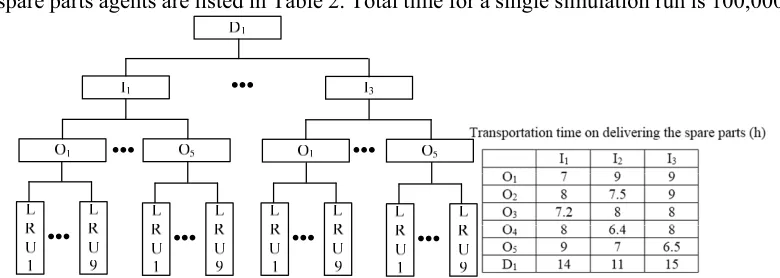
…, LRU9. The repairman is classified into two types, see Table 1. The transportation time on
delivering the spare parts are given in Figure 4, and the order time is 40 hours.
According to experiences, the parameters are given in Table 1. The amounts of LRU agents and
[image:6.612.110.500.114.253.2]initial spare parts agents are listed in Table 2. Total time for a single simulation runis 100,000 hours.
Figure 4. Structure of the three level repair network for certain weapon system.
Table 1. LRU parameters.
LRU Type
Repairman Type
MTBF (h)
MTTR(h) Probability of levels that failed LRU will send to O_Level I_Level D_Level O_Level I_Level D_Level Discard
LRU1 1 3000 1 5 10 0.10 0.70 0.15 0.05
LRU2 1 5600 1.2 5 14 0.2 0.5 0.24 0.06
LRU3 1 4500 2 6 13 0.15 0.6 0.2 0.05
LRU4 1 2000 1.5 5 11 0.23 0.52 0.2 0.05
LRU5 2 7000 1 5 14 0.31 0.45 0.2 0.04
LRU6 2 4000 1.2 6 15 0.15 0.62 0.13 0.1
LRU7 2 2500 1 5 17 0.05 0.42 0.35 0.18
LRU8 2 8000 2 3 12 0.27 0.56 0.1 0.07
LRU9 2 8000 2 4 12 0.09 0.46 0.40 0.05
Table 2. Amount of LRU agents and initial spare parts agents at each levels.
Amount of agents LRU1 LRU2 LRU3 LRU4 LRU5 LRU6 LRU7 LRU8 LRU9 Total
LRU agents 1 1 1 1 1 1 1 1 1 9
O_Spare agents 1 1 1 1 2 1 2 1 1 11
I_Spare agents 2 1 2 3 4 2 3 3 2 22
D_Spare agents 4 5 4 6 7 4 3 3 4 40
The MAS model is built as follow. In the whole repair network, we need 135 (15×9) LRU agents, 165 (15×11) O_Spare agents, 66 (3×22) I_Spare agents, and 40 (1×40) D_Spare agents.
Suppose the repairman assignment is {n1, n2, n3, n4, n5, n6}. That is, there are n1 Type1 repairman
and n2 Type2 repairman at each O_Level; n3 Type1 repairman and n4 Type2 repairman at each
I_Level; n5 Type1 repairman and n6 Type2 repairman at each D_Level. In all, the total amount is n
=15(n1+n2)+3(n3+n4)+(n5+n6). Therefore, n agents with Repairman Agent type are required.
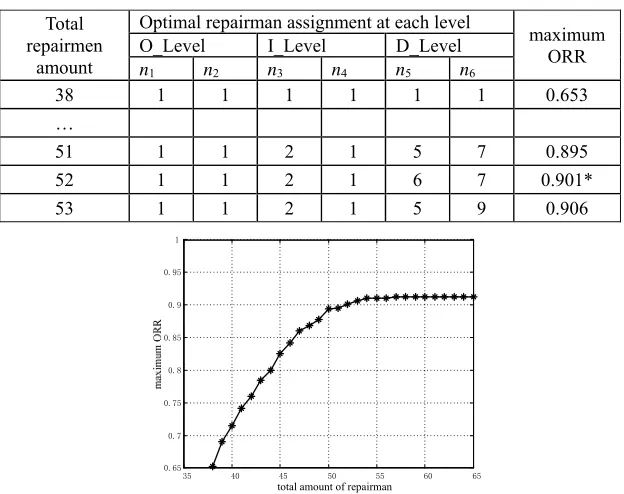
Using the proposed method, results are given in Table 3. As we can see, the minimum total amount
of repairman is 38 when only one repairman is assigned at each level, i.e., ni=1(i1, 2, , 6 ).
However, for this situation, the maximum ORR is 0.653, which is far below the required ORR A0
(=0.9). Thus, the total amount of repairman is increased one at a time, and the corresponding maximum ORR is obtained, as shown in Table 3 and Figure 5. Obviously, at least 52 repairmen are needed to meet the required ORR 0.9, and the optimal repairman assignment is {1, 1, 2, 1, 5, 9}.
Table 3. Results of OvS.
Total repairmen
amount
Optimal repairman assignment at each level
maximum ORR O_Level I_Level D_Level
n1 n2 n3 n4 n5 n6
38 1 1 1 1 1 1 0.653
…
51 1 1 2 1 5 7 0.895
52 1 1 2 1 6 7 0.901*
53 1 1 2 1 5 9 0.906
35 40 45 50 55 60 65 0.65
0.7 0.75 0.8 0.85 0.9 0.95 1
total amount of repairman
Figure 5. Maximum ORR vs total amount of repairman.
Summary
This paper has demonstrated that multi-agent simulation can be used as a good tool to realize the optimal assignment of repairmen in multi-echelon/level repair networks. The MAS model is good at descripting the details and interactions among different items, which is suitable for the complicated MEMI system. The optimization results are based on OvS that is more reliable and accurate than existing methods, e.g., queueing theory, nonlinear programming model, etc. However, there is also some deficiencies that need to improve in the future, such as low solving efficiency caused by the time-consuming simulation and OvS tool-OptQuest, which may become even worse when the repair network is more complex.
Acknowledgement
This research has been partially supported by grants from National Natural Science Foundation of China (No. 61601501, 71571109, 61502521)
References
[1] B. Wang, J. Liu, F. Qi, Analysis of maintenance requirements of armored equipment in wartime, Journal of the Academy of Equipment Command & Technology. 3 (2007) 15-18. (in Chinese) [2] L. Wang, S. Zhang, Y. Qi, Optimal repairman assignment for digitized forces in wartime, Journal of Sichuan Ordnance. 9 (2012) 54-60. (in Chinese)
[3] X. Li, Y. Zhang, P. Li, Study on equipment maintenance personnel requirement, Computer & Digital Engineering. 5(2011) 179-183. (in Chinese)
[5] E. Frostig, Jointly optimal allocation of a repairman and optimal control of service rate for machine repairman problem, European Journal of Operational Research. 2 (1999) 274-280.
[6] L.J. Hong, B.L. Nelson, A brief introduction to optimization via simulation, Proc. Winter Simulation Conference. (2009) 75-85.