The London School of Economics and Political Sciences
Upgrading in Spain: an institutional perspective
Angela García Calvo
2 Declaration
I certify that the thesis I have presented for examination for the PhD degree of the London School of Economic and Political Sciences is solely my own work other than where I have clearly indicated that this is the work of others.
The copyright of this thesis rests with the author. Quotation from it is permitted, provided that full acknowledgement is made. This thesis may not be reproduced without the prior written consent of the author.
I warrant that this authorisation does not, to the best of my belief, infringe the rights of any third party.
3 Abstract
In the early 1990s, Spain faced the risk of losing the market for low-cost manufacturing outputs to Eastern Europe, and the threat of losing control of its complex service sectors to more sophisticated competitors from Western Europe. Most industries had few alternatives other than to upgrade. By the late-2000s, Spanish firms in complex services like Banking and Telecommunications were amongst the most efficient, profitable, and sustainable in the world but most manufacturing sectors had not achieved a comparable outcome.
My thesis explains these changes in the Spanish productive structure through an analysis of the institutional structure beneath them. I argue that upgrading in Spain’s complex services was enabled by Peer Coordination (PC), a non-hierarchical variant of relational coordination based on the presence of public-private interdependencies and direct business-state interactions. Under PC, firms in complex services contributed to the fulfilment of public policy objectives in exchange for sector-specific advantages. PC enabled firms in these sectors to undertake significant restructuration that enabled them to reach the efficiency frontier in their industry. Liberalisation did not unravel PC in Banking and Telecommunications because national-level interdependences remained a structural feature of the two sectors.
4 Acknowledgements
I could have not accomplished this PhD without the right support. My supervisor, Bob Hancké, found the right balance between providing guidance and giving me freedom, while patiently enduring my efforts to focus on a single strand of thought at a time. I am indebted to my second supervisors: Christa van Wijnbergen, whose detailed advice helped me navigate the confusing first stages of the thesis, and Sir Geoffrey Owen, whose insightful suggestions contributed to refining my work. Furthermore, I want to thank my examiners, Saul Estrin and Pepper Culpepper for their suggestions and comments, which were decisive in shaping the final version of my thesis.
I am grateful to the larger LSE community, especially to Marco Simoni, who provided detailed feedback and sound practical advice throughout the writing of my thesis. Richard Bronk, Jonathan Hopkins, Abby Innes, Jonathan Liebenau, Claire Milne, and Waltraud Schelkle read or heard different parts of the argument and provided useful comments. Additional thanks go to my peers at “J14” for their collegiality and to Loukia Vassiliou and Rose Harris for their logistical support.
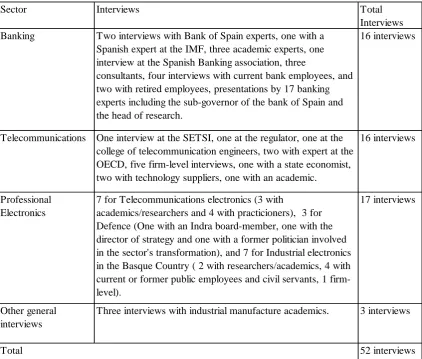
I am deeply grateful to the 52 interviewees that brought this project alive. I especially want to thank Agustin Díaz-Pines, Jorge Infante, Angel León, and Natalia Moreno for helping me realize how much I enjoy doing research. I am grateful to María Angeles Pons for volunteering her help and offering honest feedback; to Ruth Rama for sharing her personal collection of empirical and unpublished data; to Mauro Guillén for introducing me to amazing contacts; and to Angel Amado and Joan Calzada for listening to my argument and sharing their unpublished research. I am also indebted to José Luís Adanero, Xavier Castillo, Adriano Galano, and José Antonio Silvestre for candidly sharing crucial information that I could not have obtained otherwise.
I want to thank the European Institute at the LSE, the European Research and Social Council, the Santander Fund, and the Instituto Juan March, who provided the financial and logistical support that made my research possible. I am also grateful to Howard Viney and Yiorgos Mylonadis at the London Business School, who gave me the most gratifying teaching opportunity I could hope for.
Lastly, I want to thank the friends and family that stood by me through this process: Cristina Pérez and Juan Marqués, and my brother Carlos and his wife Eva Salas, who hosted me while I did field research in Madrid; my partner Won Kim, who helped solve my technological challenges; and the small circle of friends that helped me get through the downs, and corrected me whenever I said “if” instead of “when” I finish my thesis. My debt to my parents is immensurable, and it is hard to accept
6 Table of Contents
Chapter 1. Upgrading in Spain: puzzle and research plan ... 14 Motivation ... 14 1
Analytical viewpoint ... 15 2
A political economy, institutional perspective ... 15
2.1
A preview of the argument ... 17
2.2
Situating Spain ... 21 3
Spain’s model of industrialisation ... 21
3.1
The 1970s restructuration ... 24
3.2
The 1994–2007 rebound and the 2008 crisis ... 26
3.3
The rise of complex service sectors ... 27
3.3.1
The ambiguous evolution of manufactures ... 32 3.3.2
Conceptual building blocks ... 35 4
Upgrading literature ... 36
4.1
State-centric literature ... 37
4.2
Firm-centric literatures ... 40
4.3
So what? Identifying the gaps and formulating the research question ... 44 5
Missing pieces ... 44 5.1
The research question ... 45
5.2
Methodology ... 46 6
Case and region selection process ... 46 6.1
Data-gathering methodology ... 48
6.2
Thesis road map ... 51 7
Chapter 2. Spanish large banks: introducing Peer Coordination ... 53 Introduction ... 53 1
The Spanish retail banking industry in perspective ... 56 2
7 The trajectory of Spanish large banks ... 65 2.2
Standard explanations for upgrading of the Big 7 ... 67 3
Standard explanations ... 68 3.1
Creative destruction and competitive advantages ... 68 3.1.1
State capture and state-bank cooperation ... 69 3.1.2
Limitations of standard explanations ... 71 3.2
Coordination and upgrading in the Spanish model ... 72 4
Coordination and upgrading ... 72 4.1
PC development and consolidation ... 76 4.2
Early stages during the Transition (1977–1985) ... 76 4.2.1
Consolidation in preparation for the Single Market (1986–1993) ... 81 4.2.2
Impact of the Euro and the internationalisation of large banks ... 85 4.2.3
PC and firm autonomy: The case of savings banks ... 87 4.2.4
Conclusions and next chapter ... 88 5
Chapter 3. Telecommunication services: PC and the rise of Telefonica ... 90 Introduction ... 90 1
The Telecommunication sector in perspective ... 93 2
Comparative perspective ... 93 2.1
Telefonica’s trajectory ... 96 2.2
Standard explanations for Telefonica’s upgrading ... 100 3
Standard explanations ... 100 3.1
Creative destruction and competitive advantages ... 100 3.1.1
State-driven explanation ... 102 3.1.2
State capture ... 103 3.1.3
Rejecting standard explanations ... 104 3.2
Explaining Telefonica’s upgrading through Peer Coordination ... 106 4
Institutional transformation in Telecommunications ... 107 4.1
Varieties of coordination in Telecommunications ... 109 4.2
8 Spain’s economic Transition (1982-1996) ... 113 4.3.1
PC after liberalisation ... 117 4.3.2
Conclusions and next chapter ... 119 5
Chapter 4. Professional Electronics: PC trade-offs and contribution of subnational institutions to upgrading ... 121 Introduction ... 121 1
The Professional Electronics sector in perspective ... 122 2
Defining Professional Electronics ... 122 2.1
Comparative overview of Professional Electronics ... 123 2.2
The brief story of the Spanish Computer industry ... 130 2.3
Detailed case studies ... 131 3
Telecommunications Equipment: Cross-sector implications of PC ... 131 3.1
Defence Electronics: Indra’s exceptional case of industrial policy ... 135 3.2
Industrial Electronics in the Basque Country: The contribution of subnational 3.3
institutions to upgrading ... 138 Introduction ... 138 3.3.1
The Basque Industrial Electronics sector ... 140 3.3.2
The basis of collaborative coordination in the Basque Country ... 141 3.3.3
The Basque institutional framework and its connection to upgrading ... 144 3.3.4
Conclusions ... 147 4
Chapter 5. Conclusions ... 149 Recapitulation ... 149 1
Contributions ... 153 2
Performance in hybrid models and complementarity through heterogeneity... 153 2.1
Integrating firm- and state-centric perspectives ... 154 2.2
Variants of relational coordination ... 156 2.3
Future research agenda ... 157 3
Practical applications and concluding remarks ... 158 4
10 Table of figures
Table 1.1 Average GDP growth percentage in 1994–2007 ... 27
Table 1.2 Spain's GDP per capita as percentage of other countries' ... 27
Table 1.3 Spain's top 20 firms by market capitalisation in 2009 ... 28
Table 1.4 Non-financial Foreign Direct Investment (FDI) inflows and outflows in 1994-2007 29 Table 1.5 Annual person-based productivity, financial, and insurance activities ... 29
Table 1.6 Banking efficiency and profitability in 2008 ... 30
Table 1.7 Telecommunications efficiency ... 31
Table 1.8 Capital investment per communication access path ... 32
Table 1.9 Revenue/capital investment ratio ... 32
Table 1.10 Revealed Symmetric Comparative Advantage ... 34
Table 1.11 Compared labour productivity (1996–2007 average) ... 35
Table 1.12 Manufacturing as percentage of GDP in 1980–2009 ... 35
Table 1.13 Percentage change in financial variables in 2011 relative to 2007 ... 35
Table 1.14 Cluster analysis; Catalonia's Chemical sector and Basque Country's Industrial Electronics ... 48
Table 1.15 Data sources and indicators ... 49
Table 1.16 Thesis interviews by chapter ... 51
Table 2.1 Main Bank ratios in 1985 ... 58
Table 2.2 Commercial bank branches per 100,000 adults in 2010 ... 61
Table 2.3 Composition of loans and liabilities in 1996-1997 ... 62
Table 2.4 Main bank ratios 2009 ... 63
Table 2.5 Return on Equity (ROE) in 2009... 64
Table 2.6 Automatic cashiers per 100,000 adults in 2009 ... 64
Table 2.7 Market performance ratios for selected global banks in 2009 ... 64
Table 2.8 Acquisitions of Latin American banks by Spanish Banks in 1990-2005 ... 67
Table 3.1 Network, profitability, and investment in 1985 ... 94
Table 3.2 Digital exchanges and waiting lists ... 94
Table 3.3 Revenue per employee (USD) in 1985 and 2008 ... 95
Table 3.4 Network, profitability, and investment in 2009 ... 96
11
Table 3.6 Network expansion by country in 1985-1996 ... 106
Table 3.7 Waiting lists for fixed telephone lines in 1980-1996 ... 106
Table 3.8 Variants of coordination across countries in the post-liberalisation context ... 112
Table 4.1 Code definitions of the three subsectors using NACE Rev. 2... 123
Table 4.2 The Spanish Electronics sector in 1981 ... 124
Table 4.3 The Spanish Professional Electronics sector in 1981 ... 124
Table 4.4 The Spanish Professional Electronics sector in 1990 ... 125
Table 4.5 Professional Electronics production, international comparison in 1990 ... 125
Table 4.6 Professional Electronics consumption, international comparison in 1990 ... 126
Table 4.7 The Spanish Professional Electronics sector in 2009 ... 126
Table 4.8 Communications Equipment in detail in 2009 ... 127
Table 4.9 Defence (software) Electronics in detail in 2009 ... 128
12 List of abbreviations
AEB Asociación Española de Banca AHP Analytic Hierarchy Process
AMETIC Asociación de Empresas de Electrónica, Tecnologías de la Información, Telecomunicaciones y Contenidos Digitales
ANFAC Asociación Española de Fabricantes de Automóviles y Camiones BdE Banco de España
BIS Bank for International Settlements CCOO Comisiones Obreras
CEMFI Centro de Estudios Monetarios y Financieros DEA Data Envelope Analysis
DGTel Dirección General de Telecomunicaciones DT Deustche Telekom
ECB European Central Bank ETA Euskadi ta Askatasuna EU European Union
FDI Foreign Direct Investment
FEDEA Fundación de Estudios de Economía Aplicada FROB Fondo de Restructuración Ordenada Bancaria FT France Telecom
FTTH Fibre To The Home GVC Global Value Chains
ICT Information and Communications Technologies IMF International Monetary Fund
INE Instituto Nacional de Estadística INI Instituto Nacional de Industria IPE International Political Economy IPO Initial Public Offering
13 LME Liberal Market Economy
M&A Mergers and Acquisitions Mbps Mega bits per second
NACE Nomenclature Générale des Activités Économiques dans les Communautés Européennes
NGAs Next Generation Access Networks NPL Non-Performing Loans
OECD Organisation for Economic Cooperation and Development PC Peer Coordination
PNV Partido Nacionalista Vasco PP Partido Popular
PSOE Partido Socialista Obrero Español PTO Public Telecommunications Operator PTT Public Telephone and Telegraph RBV Resource Based View
R&D Research and Development
RSCA Revealed Symmetric Comparative Advantage SEPI Sociedad Estatal de Participaciones Industriales SITC Standard International Trade Classification SESA Standard Eléctrica Sociedad Anónima
SETSI Secretaría de Estado para Telecomunicaciones y Sociedad de la Información SPRI Sociedad para la Promoción y Reconversión Industrial
UGT Unión General de Trabajadores
UK United Kingdom
14 Chapter 1. Upgrading in Spain: puzzle and research plan
Motivation 1
One Sunday morning in January 1999, I sat with my parents at Bilbao airport waiting for my flight. A recent Spanish university graduate, I was taking up a job in Chicago. With me I carried two bursting suitcases, a double bachelor’s degree, a master’s degree, and diplomas attesting my command of two foreign languages. It was far better than my dad’s high school diploma but not good enough to start a career in a country where 40 percent of my peers were unemployed and most of the rest were underemployed (BBVA 2011). In the autumn of 2006, I sat at a cafe in Harvard Square talking to a French investment banker. My experience in the US had galvanised my opinion that Spain offered scarce career opportunities for qualified individuals. Yet, my colleague was raving about the achievements and dynamism of Spain’s large firms in Banking, Telecommunications, Energy, and Civil Engineering. I was baffled.
15 As my French investment banker colleague pointed out, by the mid-2000s, Spanish firms in a handful of complex service sectors had climbed to the top of international rankings in terms of market capitalisation, number of clients, worldwide presence, efficiency, and productivity. Deep process and organisational changes enabled these firms to become global leaders and to successfully fend off the spectre of foreign acquisition. These sectors also stood out relative to the rest of the Spanish productive structure in terms of added value, salaries, and career opportunities.
The emergence of Spanish firms in complex service sectors is surprising because movements up the Global Value Chain, or “economic upgrading”, require changes in comparative advantages and firm strategies that are complex and risky, and generally have long-term horizons. Furthermore, the hierarchy of the global division of labour tends to be resilient, especially at the top. The purpose of this thesis is to understand upgrading in Spain from the point of view of the institutions that enabled it. In doing so, my thesis aims to respond to the following questions: What institutional structure defines the Spanish model of capitalism? Why was this structure better able to foster upgrading in complex service sectors? Can upgrading be expanded to other sectors in the economy?
The rest of this chapter is structured as follows: Section two explains the perspective I took in this thesis and encapsulates the argument. Section three summarises Spain’s economic trajectory. Section four presents the conceptual blocks I used to build my analysis. Section five identifies the gaps in the literature and formulates the research question. Sections six and seven outline the methodology and the chapter structure of the thesis.
Analytical viewpoint 2
A political economy, institutional perspective 2.1
The characteristics of production models are relevant to political economists who study the nature and performance of capitalist models. Production models are by nature dynamic, which makes the study of their transformations an inherent part of the study of capitalism.
16 constrain them. In other words, the microeconomic perspective needs to be complemented by a macroeconomic view to reveal the institutional structure that conditioned and enabled upgrading. This turns my analysis of upgrading in Spain into a study of Spain’s institutional structure.
The basis for my analysis was primary and secondary evidence from three sectors: Banking, Telecommunications, and Professional Electronics. I selected these sectors primarily on the basis of their skill and capital intensity, density of connections to other sectors, centrality to the country’s economy, and relative success in reaching the efficiency frontier. I combined these criteria to ensure that cases represented upstream complex sectors whose trajectories have repercussions for the whole economy. I used the first case, Banking, to identify the main features of Spain’s institutional structure. However, complex service sectors like Banking operate in highly specialised institutional environments. To prevent the particularities of a single sector from biasing my analysis, I used evidence from the second case, Telecommunications. This second case confirmed, refined, and helped generalise my findings. Finally, I used the third case, Professional Electronics, to evaluate the implications of the national structure on the rest of the economy and to examine the contribution of subnational (regional) institutional systems to upgrading.
Spain is an interesting, critical case in itself and beyond. As outlined earlier, if one country faced pressure to upgrade in the 1990s, it was Spain. Furthermore, since I started tackling these questions in 2008, Spain has become immersed in a crisis so deep that the topic could not be timelier. In mid-2012, the International Monetary Fund (IMF) estimated it would take Spain a decade to reach pre-crisis gross domestic product (GDP) levels (El País 2012). Overall unemployment as of mid-2013 stood at 26.6 percent, and unemployment for those under 25 was 55 percent (INE 2013). These are the worst figures in Europe, with the exception of Greece. Budgets in sectors like education, healthcare, and pensions have been slashed since 2012 to achieve fiscal balance targets (El País 2012 (b)). Furthermore, in May 2012, Spain negotiated a rescue package for the Banking sector, and rumours about larger country rescue lingered into 2013. Under these circumstances, understanding the process by which a handful of sectors upgraded can offer valuable clues on whether, and how, other sectors could achieve comparable results and generate the wealth Spain needs to support a sustainable recovery.
17 middle-income countries. In addition, Spain falls into the category of Mixed Market Economies, or hybrid institutional ecosystems. These cases are understudied by the literature of Models of Capitalism and are expected to underperform relative to Liberal and Coordinated Market Economies (Hall and Gringerich 2009). By taking up the study of a hybrid case, this thesis aims to explore the nature of mixed systems and elucidate whether they offer any advantages.
A preview of the argument 2.2
My thesis identifies large firms and the Central State as the main catalysts of upgrading, and the structure of the relationship between the two as the key to the outcome. My argument rejects hypotheses based on the idea that the Spanish state-firm relationship was dominated by either large firms or the state. Instead, I argue that state-firm coordination was a peer-group arrangement based on the interdependent and complementary capabilities of the two actors and on the existence of compatible, long-term objectives.
Upgrading, or moving up in the global division of labour, involves changes in the production specialisation of a country, which in turn implies a shift in that country’s resource endowments. States’ overarching capacities to undertake public investment and provide basic collective goods, and their responsibility toward the common welfare, place them in a unique position to modify a country’s resource endowment and, therefore, contribute to upgrading. Firms are also indispensable contributors to upgrading because they are responsible for the decisions that result in superior or more complex outputs, more efficient processes, and effective organisational structures (Porter 1990). Once both actors are identified as necessary, the key is to understand how they articulated their interactions in Spain to achieve what Evans (1995) termed a “multidimensional conspiracy”, and why the resulting institutional structure provided stronger support for upgrading in complex service sectors.
18 Supporters of the firm-driven hypothesis contend that a new generation of able managers in service sectors competed successfully in global markets thanks to advantages in project evaluation, execution, and negotiation skills (Guillen 2005, Guillén and García-Canal 2010). By contrast, as Spain’s cost advantage in manufacturing sectors eroded, firms were unable to counter cost and product-quality competition, leading to stagnation and decline. Spain’s two periods of privatisation in 1983–1985 and 1997–1998, the liberal background of most of its economists, and the rapid opening of product markets after 1986 support the view that the state helped create and support markets.
Contrary to the firm-driven interpretation, detailed comparative evidence from the Banking and Telecommunication sectors shows that Spain’s large firms started from positions of disadvantage. The disadvantage stemmed from Spain’s economic underdevelopment, the firms’ lack of international exposure, and the legacy of Francoism. I also contend that the firm-driven interpretation of manufacturing decline avoids the heart of the question: why did manufacturing not attempt to offset higher relative costs with higher value through increases in product complexity and productivity? Evidence that the state acted primarily as a nonpartisan administrator and market supporter is also unclear. Spain opened its product markets to competition relatively early, but complex services did not immediately face foreign competition. In addition, Chapters 2 and 3 show that the state actively shaped, and continues to shape the structure of markets in these sectors.
The second variant of the firm-driven hypothesis accepts the state’s proactive role, but it contends that the state acted on behalf of corporate interests for the sectors that managed to upgrade. Corporate state capture is associated with high levels of corruption, government inefficiency, and low regulatory quality, expectations that were not fulfilled in the Spanish case. Specifically, the state capture hypothesis is inconsistent with the level of competence demonstrated by Spanish civil servants; with the government’s solid and continuous commitment to development; and with the consistency among government commitment, policy formulation, and implementation. State capture is also associated with low levels of firm innovation and competitiveness. This expectation contrasts sharply with the deep structural changes and positive trajectories of large Spanish firms in Banking and Telecommunications. Finally, the state capture hypothesis is inconsistent with the commitments assumed by Spanish firms, such as accepting an intrusive bank supervisory system, financing banks’ turnaround during the 1977–1985 banking crisis, or developing a strategy and financing the majority of the telecommunications network expansion.
19 focused on Latin America, the existence of national plans to modernise certain sectors, license allocations through “beauty contests”, and public procurement practices that favour local firms. A “hub and spokes” account in which the state drives upgrading also assumes a great degree of state willingness and the capacity to pick and choose sectors; develop complex strategies; coordinate, understand, and respond rapidly and accurately to market dynamics; share risks with firms through capital investment; and impose plan implementation on subordinated firms. However, my analysis shows that the Spanish state lacked the willingness, the cross-sector strategic capacity, and the financial resources necessary to articulate upgrading on its own. After the victory of the Partido Socialista Obrero Español (PSOE), Spain’s Socialist Party victory in 1982, the incoming government replaced any remaining Opus Dei1 planners in office with liberal economists trained at the Central Bank. This new group of economists had been vocally critical of the planner’s methods, which they associated with the corruption, inefficiency, and unbalanced development that characterised Francoism. In addition, the assumption of the state’s overarching planning capability is at odds with the compartmentalised structure of Spain’s civil service, which is divided into specialised groups with limited responsibilities and sometimes antagonistic relations. Evidence of one of the key levers of statism, risk sharing through capital investment in firms, is also weak. Spanish private banks, not the state, were the main financiers of Spain’s industrialisation, and they had significant autonomy over lending decisions (Pérez 1997). Furthermore, as Chapters 2 and 3 explain in detail, Spain continued to rely on large firms to implement public strategies aimed to address critical episodes, such as the 1977–1985 banking crisis, and to overhaul basic infrastructures. Finally, liberalisation and privatisation of complex services further eroded the state’s ability to rely on traditional statist instruments, such as control over suppliers, prices, and investments, to subdue firms. New sources of state power, such as day-to-day supervision, license issuing, and control of infrastructure investment, guaranteed state leverage in complex service sectors but not the power to coerce firms against their will.
The alternative explanation presented in this thesis departs from the assumption that there is a dominant actor in the state-business relationship. It is based instead on the notion of interdependence. Peer coordination (PC) is a form of relational coordination based on the presence of actors who need to combine their unique capabilities to achieve compatible goals. In
1 Opus Dei is a Spanish-founded Orthodox Catholic organisation whose members are encouraged to participate actively in public
service at the highest levels, often supported through the Opus’ extensive financial resources and personal networks. Opus members
had played significant roles in Francoists governments in the 1960s and 1970s, introducing multiannual planning strategies inspired
20 the Spanish case, large firms had strong planning and financial capabilities that could complement the state’s weaknesses in these areas, but they were unable on their own to undertake the structural reforms necessary to unleash their potential and become competitive in a changing environment. The state had a clear commitment to economic development and modernisation, strong regulatory powers, and the ability to broker social pacts that could facilitate the modernisation of large firms. However, it lacked the necessary strategic and financial resources to accomplish these goals independently or to impose its power on firms. The role of large firms and the state was underscored by the limited role of intermediary organisations and social interest groups in firms’ strategic decision making.
These circumstances made PC an ideal structure to support upgrading in well-established complex service sectors like Banking and Telecommunications: A supportive regulatory framework was key to incentivise restructuration, investment, and growth in complex service sectors, whereas the state’s weak planning capacities gave large, private firms the leeway they needed to elaborate strategies that suited their objectives. The state’s lack of financial means was not an obstacle for leading firms in these sectors because their size and track record enabled them to raise funds through the markets. Finally, market concentration in the hands of a few large firms meant that firms could communicate with the state efficiently without relying on intermediary organisations.
PC was generally not suitable to support upgrading in skill- and capital-intensive manufacturing sectors, such as Professional Electronics. Such sectors depended more on what the state could do less well: elaborate stable, well-coordinated, long-term plans; facilitate access to patient capital; guarantee stable, long-term demand; and provide access to research facilities for the development of new, complex products. Skill- and capital-intensive manufacturing were also less likely to benefit from the state’s regulatory strength because most of these sectors operate in less structured markets. Furthermore, the atomisation of most Spanish manufacturing meant that coordination structured around intermediaries would have been more effective than the one-on-one relationships characteristic of PC. Finally, despite the critical importance of skill- and capital-intensive manufacturing, their upgrading is less directly linked to the fulfilment of developmental public policy goals, such as improving infrastructures or universalising utility services.
21 that regional governments, especially that of the Basque Country, were able to create institutional structures aimed to facilitate access to the types of resources that PC was unable to provide. In that regard, regional institutional structures complemented national ones and contributed to upgrading. Nonetheless, the situation of the Basque Country was based on regional conditions that differed from those of the rest of the country and so remains an exception.
Situating Spain 3
The purpose of this section is to contextualise the rest of my thesis. This section summarises the trajectory of the Spanish economy since its late industrialisation and is divided into three parts. The first part highlights the circumstances and features of Spain’s industrialisation. The second part describes the impact of the 1970s crises and the measures adopted to overcome them across relevant industries. The third part describes the growth period that started in 1994 and briefly comments on the impact of the recent crises.
Spain’s model of industrialisation 3.1
Spain’s modern industrialisation took off with the 1959 Stabilisation Plan, which put an end to two decades of autarky and international isolation. The targeted industrialisation model that ensued in the 1960s and early 1970s was structured on multi-annual Development Plans inspired by the French tradition (Smith 1988, Royo 2000, Pérez 1997, Sánchez Domínguez 200). These plans established a list of preferential industries and geographic areas from which growth was expected to expand through upward and downward links. Following international recommendations (World Bank 1962), private investment was the main source of finance for industry. To fuel credit, the government established two instruments of privileged financing: a special rediscount rate for commercial banks that extended credit to state-specified users, and a credit line channelled through the INI (Instituto Nacional de Industria), a public credit institution modelled after the Italian Istituto per la Ricostruzione Industriale. Nonetheless, banks where the main financiers of the system, providing 60 percent of the financing to the private sector (Pérez 1997).
22 outdated and theoretical nature of university education (Vicente Ortega 2006, Segura 2012). Free labour representation remained prohibited. Ostensibly, the prohibition was aimed at preventing social unrest, uncontrolled wage increases, and strikes that could break public peace. In reality, the regime was wary of the traditional association between unions and leftish parties, which were anathema to the regime (Pallarés-Barberá 1998, Sánchez Domínguez 2001). Illegal unions became tolerated by the early 1970s and were legalised only in 1977. Thereafter, their activities have concentrated mainly on the negotiation of salaries, contracts, working conditions, and processes of pre-retirement rather than on corporate strategy (Royo 2007, 2008). Even then, salaries remained lower than those in other European Countries. In the second half of the 1980s and despite rampant inflation, Spanish wages were still 23 percent lower than France’s, 53 percent below Germany’s, and 20 percent lower than Italy’s (Pallarés-Barberá 1989). Few sector associations existed before the mid-1970s. For instance, the Asociación Española de Banca (AEB) or Spanish Banking association, was founded in 1977, and the Asociación de Empresas de Electrónica, Tecnologías de la información, Telecomunicaciones y Contenidos Digitales (AMETIC) or association of the Electronics sector, was created in 1973.
Given Spain’s capital and technology deficiencies, Foreign Direct Investment (FDI) was essential to achieve industrial development in capital-, technology-, and knowledge-intensive sectors (Varela Panache et al 1974, Muñoz et al 1978, Campa and Guillén 1996, Durán Herrera 2005). Investors were attracted by Spain’s combination of cheap and docile labour, the presence of nascent ancillary industries, a potentially large internal market, and public incentives for foreign investment. Often, these were investors that had established operations in Spain in the early 1900s and were retaking or scaling up their operations. This was the case of Siemens, Ericsson, Phillips, and ITT in the Professional and Consumer Electronics sectors (Rico 2006). At the beginning of the 1970s, foreign invested firms represented 85 percent of production and 90 percent of employment in electronics (Adanero 2006). Due to heavy tariffs on imports and exports, production from foreign affiliates catered mostly to Spanish demand2 (Maravall 1987, López Claros 1988). The scope for innovation spillovers from foreign-invested firms was limited. Production plants in Spain did not incorporate state-of-the-art machinery or undertake operations of high value-added content. Instead, production relied on older equipment and the use of abundant labour (Smith 1998, Guillén 2005). For instance, in the Professional Electronics sector, it was common to import technologies and products that were already mature abroad but unknown in Spain. Local added-value content consisted of the incorporation of auxiliary
2 By the mid-1970s Spain was still the most closed country in Western Europe; the ratio of exports to GDP stood at 7.5 percent and
23 equipment and installation and maintenance services (Rico 2006). There were, however, a handful of small, local firms that strove to produce under their own technology and specialised in one or a few products. Despite these handicaps, the economic effects of industrialisation were dramatic. Between 1960 and 1975, Spain’s GDP per capita rose from 30 percent to 65 percent of the OECD average (World Bank data, own calculations).
As in most other countries, complex service sectors like Banking and Telecommunications were highly protected industries. In addition, a combination of the state’s chronic lack of capital, underdevelopment, and a history of political instability that led to regulatory and financial uncertainty gave private initiative significant leverage and led to the delegation of governance functions that most other states retained for themselves. In an underdeveloped economy that lacked natural resources, these profitable and safe sectors were the realm of local business elites. As a result, private firms in complex services had a high degree of leverage. Telecommunications is a case in point. Twelve different regulatory frameworks between 1880 and 1924 led to a slow and patchy development of Telecommunications network infrastructure. These circumstances resulted in the establishment of Telefonica, a fully private, foreign-invested firm that assumed the obligation to develop and manage the national network. Romania was the only other European country that followed this formula (Calvo 2010). Capital and technology from the US were fundamental to setting up a telecommunications operator that provided service throughout the country, but preeminent local capitalists also played important management roles at the firm. For instance, the Marquis of Urquijo, founder of the largest Spanish industrial bank, presided over Telefonica between 1924 and 1945. Representatives from Spain’s largest banks, such as Pablo Garnica (Banesto), José María Amusátegui (BCH), Emilio Botín (Santander), José Ignacio Goirizalgorri (BBVA), and Isidro Fainé (La Caixa), continued to represent the interests of large banks at the board of Telefonica in the following decades. The delegation of governance functions to Telefonica was substantial; between 1924 and 1987 (Law 31/1987), two successive contracts subscribed between Telefonica and the Spanish state in 1924 and 1946 constituted the only regulatory framework for the sector (Jordana and Sancho 1999, López 2003, Rama et al 2003, Rico 2006, Calvo 2010). In addition, the operator, rather than public employees, represented Spain at supranational organisations like the ITU (International Telecommunications Union).
24 interest rates for loans and maximum rates for deposits, and limited dividend distribution. Savings banks could not expand operations beyond the geographical limits of their province or negotiate certain products aimed at professional clients, such as commercial discounts. Savings banks also faced strict limits in the way they invested their profits into local welfare.
The 1962 Banking Law cemented the banks’ role as the key financiers of industrialisation by establishing special rediscount rates for credit extended to preferential sectors and by endorsing the mechanism of pignoración automática, which allowed banks to automatically monetise their debt. These measures ensured that banks’ profits soared as the economy boomed in the 1960s. As in the Telecommunications sector, banks also took on governance functions from the state. Banks were self-regulated and Banco de España (BdE), Spain’s Central Bank, had very limited tools to exercise supervision over the Banking sector (Quintana 1985). Furthermore, the increased complexity that accompanied Spain’s development increased demand for the bankers’ expertise. Between 1945 and 1975, bankers occupied 213 key executive, legislative, or regulatory positions compared to only 11 between 1939 and 1945 (Pérez 1997, Tortella and García Ruiz 2003, Guillén 2005).
The 1970s restructuration 3.2
The 1970s crises had devastating effects for the Spanish economy. They further tipped the nation’s chronic balance of payments disequilibrium3
and subsequently brought to the surface the inefficiencies of local firms, they dried FDI flows and market credit, and they created liquidity problems. Initial measures to offset the economic meltdown had a limited scope, mostly because the oil shocks took place during La Transición, Spain’s delicate political transition. As conditions deteriorated, the INI played the role of the safety valve by acquiring ailing firms in several industries.
The first post-transition government finally undertook restructuring between 1983 and 1985. Despite a rhetoric that suggested conventional industrial policies, the state put more resources into maintaining or creating jobs in the midst of a serious crisis than into protecting or supporting the development of local industry or increasing the value-added content of its outputs. Developments in the Professional Electronics sector exemplify this. By 1980, the INI participated or totally owned 10 Professional Electronics firms (Adanero 2006). Several of
3Spain’s energy and technology deficiencies, coupled with limited exports, meant that Spain experienced several critical payment
crises in the previous decades. One of these, in 1951–1952, led Franco to abandon the autarkic regime he had adopted in 1939 as the
only alternative to a drastic reduction in standards of living. Remittances from emigrants and tourists balanced the situation in the
25 them, including Standard Electrica and Marconi, the two largest firms in the sector, teetered on closure. In 1983, the government approved a National Electronics Plan that aimed to increase technology usage among Spanish firms and to develop the Electronics sector. The plan included four types of measures to achieve its goals (see Chapter 4), but only one, attracting foreign investment, was pursued in earnest (De Diego 1995, BIT 1997, Adanero 2006). One of the firms that entered the market was Alcatel, which acquired Standard and Marconi in 1986. The entry of foreign investment in Electronics accelerated in the second half of the 1980s as a consequence of Telefonica’s decision to divest its industrial arm and establish alliances with global suppliers. Foreign competition increased pressure on local firms, many of which subsequently folded. Although the quantitative objectives of the National Electronics Plan to increase exports were achieved, much of the exported goods were low-value outputs such as consumer electronics (TVs, video cassette recorders, etc.) and electronic components (valves, electromagnetic equipment) rather than complex, high value-added outputs. Furthermore, exports were offset by much larger increases in imports (Fundesco 1986, De Diego 1995, BIT 1997, Pérez 1997). By contrast, the approach to the Banking crisis of the 1970s to 1980s was more immediate, effective, and thorough. Although one of the aims of the state was to recapture governance functions delegated to the sector, publicly listed banks had a direct role in the sector’s restructuration. Also, contrary to its welcoming attitude toward FDI in industrial manufacturing, the government discouraged foreign attempts to acquire troubled banks. One of the first measures of the transition government in 1977 was to reform the financial system. The Ministry of Economics reorganised its various departments to facilitate the elaboration of strategic economic guidelines. The reform also established effective reporting, control, and supervision mechanisms aimed at allowing the BdE to practice an active, independent monetary policy (Quintana 1985). A severe banking crisis from 1978 to 1985 prompted decisive restructuration measures that were efficiently coordinated by the BdE (Sheng 1996, Caprio and Klingebiel 1996, Rivases 1991, OECD 2009). Unlike in manufacturing, banking restructuration was financed primarily through contributions from the private sector. Rescued banks were quickly auctioned off and many were purchased by one of the Big 7. By the end of the 1980s, the BdE favoured a strategy of bank mergers to reinforce the competitive position of local banks and prevent the entry of foreign investors (Rivases 1991, Guillén 2008). This led to a first wave of mergers between 1987 and 1993.
26 sector, there was also a plan, but Telefonica had a fundamental role in negotiating its objectives and choosing how to implement them.
The state aimed to recover governance functions through the creation of two public bodies, the Dirección General de Telecomunicaciones (DGTel) or General Directorate for Telecommunications and the Secretaría de Estado para Telecomunicaciones y Sociedad de la Información (SETSI) State Secretariat for Telecommunications and Information Society. Initially, these bodies focused on developing a legal framework for the sector and a plan to universalise telephony services. Telefonica played a direct role in making these plans a reality by developing an efficient wired-wireless technology solution to provide access in remote rural areas (López 2001, Rama 2003 and 2005, Adanero 2006) and by funding 75 percent of the plan’s implementation through a combination of internal resources and funds raised through the markets (Adanero 2006). Between 1986 and 1999, the operator increased the number of existing fixed lines by 70 percent (ITU 2010). Like Banking, which divested its industrial portfolio to prevent loses (Pérez 1997, Guillén 2008) Telefonica progressively shed its industrial arm after 1985.
The 1994–2007 rebound and the 2008 crisis 3.3
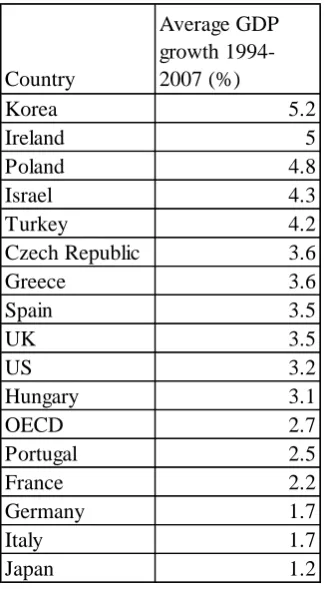
27 Table 1.1 Average GDP growth percentage in 1994–2007
Table 1.2 Spain's GDP per capita as percentage of other countries'
The rise of complex service sectors 3.3.1
Aggregate variables like GDP help identify overall trends, but they are not detailed enough to understand the underlying dynamics behind them or identify divergent trajectories across sectors. To do so, it is necessary to use sector-based data. Microeconomic evidence suggests that a few complex service sectors stood out from the rest of the production structure. Two basic indicators are the size of Spanish firms in these sectors and the dynamics of inward and outward productive investment. Of Spain’s top 20 firms by market capitalisation, 18 operated in only four complex service sectors: Banking, Telecommunications, Energy, and Infrastructures/Civil Engineering (Table 1.3). The same four sectors accounted for 88 percent of Spain’s
non-Country
Average GDP growth 1994-2007 (%)
Korea 5.2
Ireland 5
Poland 4.8
Israel 4.3
Turkey 4.2
Czech Republic 3.6
Greece 3.6
Spain 3.5
UK 3.5
US 3.2
Hungary 3.1
OECD 2.7
Portugal 2.5
France 2.2
Germany 1.7
Italy 1.7
Japan 1.2
Source: World Bank Development Indicators
*Data for Ireland only between 2001 and 2007
Country 1985 2009
OECD 48 95
France 48 78
Germany 50 79
Italy 59 90
UK 56 90
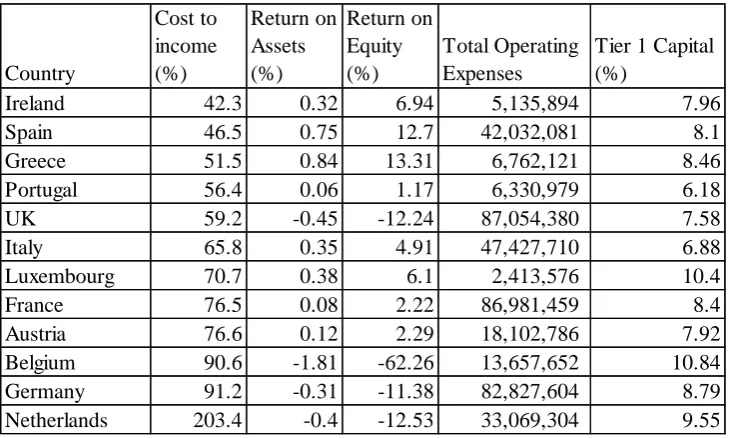
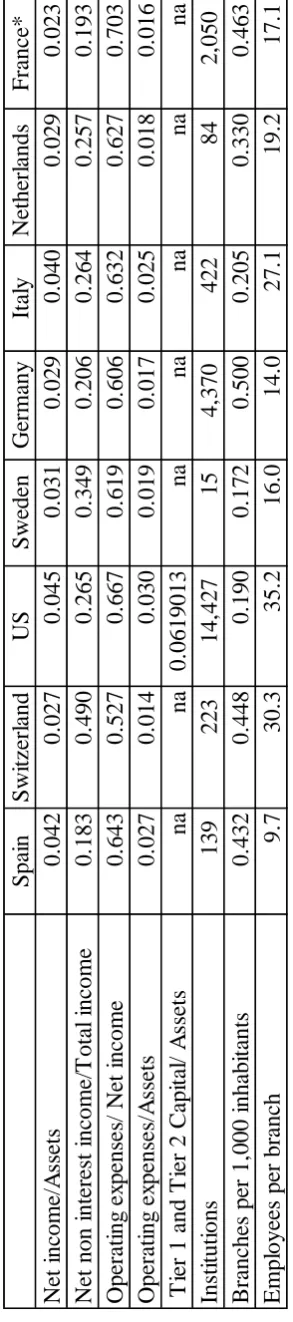
28 financial FDI outflows and 40 percent of inflows between 1994 and 2007 (see Table 1.4). The internationalisation of Spanish firms is considered a directional indicator of competitive advantage (Hymer 1976) and contrasts with the limited projection of Spanish firms prior to the 1990s (Maravall 1987, Braña and Molero 1994, Guillén 1994, Sánchez Domínguez 2001). Banking and Telecommunications stand out from among the four complex service sectors, accounting for 80 percent of outward FDI. More importantly, in addition to expanding their footprint, firms in these sectors became some of the most efficient in the world. In the 2000s, Spanish banks increased their productivity from one of the lowest in the Eurozone to that of the level of the most efficient country, Germany (Table 1.5). In addition, by 2008, Spain’s banks’ cost-to-income ratio, which is a standard measure of efficiency, was one of the lowest in the Eurozone (Table 1.6).
Table 1.3 Spain's top 20 firms by market capitalisation in 2009
Ranking by market capitalisation
Ranking
Forbes 500 Company Sector
1 34 Telefonica Telecommunications 2 21 Grupo Santander Banking
3 40 BBVA Banking
4 122 Iberdrola Energy 5 113 Repsol-YPF Energy 6 609 Inditex Textiles
7 451 Cepsa Energy
8 341 Gas Natural Energy 9 571 Abertis Infrastructures 10 278 Banco Popular Banking 11 226 Grupo ACS Infrastructures 12 363 Acciona Infrastructures 13 485 Banco Sabadell Banking 14 409 Mafre Insurance
29 Table 1.4 Non-financial Foreign Direct Investment (FDI) inflows and outflows in 1994-2007
Table 1.5 Annual person-based productivity, financial, and insurance activities
European Commission and European Central Bank calculations based on Eurostat data. Own elaboration
Sector
FDI outflows as percent of total
FDI inflows as percent of total
Financial services except insurance 59.62 7.24
Telecommunications 20.07 18.2
Electricity and gas 7.82 13.46
Building construction 3.26 4.04
Chemical industry 3.22 4.17
Iron and steel products 1.49 1.53
Food industr 1.18 2.5
Infrastructures* 0.88 1.36
Motor Vehicles 0.78 1.71
Hotels 0.59 1.44
Electrical equipment 0.5 0.55
Oil and gas extraction 0.36 0
Information technologies and electronic products 0.09 0.67
Machinery and equipment 0.08 0.6
Textile industry 0.06 0.32
Source: DataInvex. Own elaboration
[image:29.595.87.512.423.568.2]30 Table 1.6 Banking efficiency and profitability in 2008
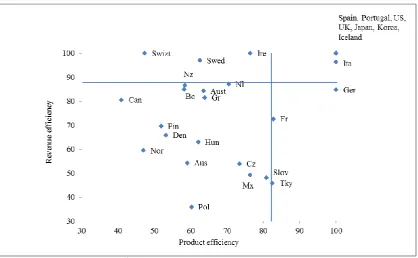
Spain also reached the efficiency frontier in telecommunications. According to a comparative study of efficiency across the OECD performed by Lien and Peng (2001) using Data Development Analysis methodology4 (DEA), in 1980 Turkey, Spain, Mexico, and Italy (in that order) where the OECD countries with the most inefficient operators5. By 2001, soon after liberalisation, an analysis performed by Pentzaropoulo and Giokas (2003) based on DEA and Analytic Hierarchy Process methods and using revenue and number of subscribers, showed that Spain had improved its operational efficiency but was not yet fully efficient (i.e., revenue and operational efficient combined). By 2007, a new study by the same authors (Giokas and Pentzaropoulo 2008) classified Spain as a “benchmark” in terms of overall efficiency, along with seven other OECD countries (Table 1.7).
4 DEA is a non-parametric method based on several inputs, single output production functions. This method has been used
extensively to establish the efficiency frontier in the Telecommunications sector. The two commonly used outputs for
telecommunications are number of subscribers and revenue, which in turn define two efficiency benchmarks: operational and
revenue efficiency. Typical outputs include number of access lines, staff, number, Internet hosts, annual investment, and total assets.
5 Results need to be taken directionally, since revenue was based on politically determined tariffs. But in 1980, this was the case in
most countries.
Country
Cost to income (%)
Return on Assets (%)
Return on Equity (%)
Total Operating Expenses
Tier 1 Capital (%)
Ireland 42.3 0.32 6.94 5,135,894 7.96
Spain 46.5 0.75 12.7 42,032,081 8.1
Greece 51.5 0.84 13.31 6,762,121 8.46
Portugal 56.4 0.06 1.17 6,330,979 6.18
UK 59.2 -0.45 -12.24 87,054,380 7.58
Italy 65.8 0.35 4.91 47,427,710 6.88
Luxembourg 70.7 0.38 6.1 2,413,576 10.4
France 76.5 0.08 2.22 86,981,459 8.4
Austria 76.6 0.12 2.29 18,102,786 7.92
Belgium 90.6 -1.81 -62.26 13,657,652 10.84
Germany 91.2 -0.31 -11.38 82,827,604 8.79
Netherlands 203.4 -0.4 -12.53 33,069,304 9.55
Source: ECB Statistics, data for 2008. Own elaboration
31 Table 1.7 Telecommunications efficiency
Source: Giokas and Pentzaropoulo 20086
More detailed analyses of Telefonica underscore the operator’s efficiency. Nokia and Siemens (2009) ranked Telefonica as the world’s fourth most efficient wireless operator in terms of cost over capital expenditures, directly behind NTT Docomo, Verizon, and France Telecom. A study by Chun-Hsiung and González Jiménez (2006), also based on DEA, considers Telefonica’s Brazil mobile subsidiary the most efficient within a set of operators among Brazil, Russia, India and China. Telefonica’s subsidiary also ranks high in terms of three indicators of partial-factor productivity: revenue per employee, revenue per total assets, and revenue per capital expenditure. These results highlight Telefonica’s strength at transforming capital investment into revenue.
6
The axes dividing the quadrants represent the efficiency scores of a hypothetical average country, as calculated using DEA
32 Table 1.8 Capital investment per communication access path
Table 1.9 Revenue/capital investment ratio
The ambiguous evolution of manufactures 3.3.2
The rise of complex service sectors, particularly Banking and Telecommunications, contrasts with the more ambiguous evolution of most other sectors, especially manufacturing industries like Metal products or Automotive, which had driven industrialisation in the previous decades. As Table 1.4 shows, these and other key industrial sectors like Electronics and Machinery account for a modest share of total FDI outflows and inflows.
Country
Average 1988-90
Average 1991-93
Average 1994-96
Average 1997-99
Switzerland 421.7 425.0 389.3 268.2
Spain 383.1 309.4 212.5 183.8
Italy 346.8 366 202.7 137.2
Germany 312.2 438.3 298.6 173.7
Austria 310.4 377.6 343.3 251.9
Japan 294.8 350.9 530.4 290.1
Australia 294.8 248.8 328.4 253.0
Mexico 289.7 325.6 213.8 211.1
Portugal 267.6 325.2 257.7 173.6
Finland 260.2 186.1 221.1 120.1
New Zealand 254.5 242.8 205.2 121.1
Norway 241.1 213.1 145.1 113.6
Canada 238.6 206.1 159.4 167.9
Hungary 233.8 349.5 337.7 166.3
OECD 277.8 246.2 216.7 234.8
Source: OECD Communications Outlook 2009
Operator Country
Revenue/Investment (%)
BT UK 8.31
France Telecom France 8.13
Telefonica Spain 7.47
NTT Japan 7.43
AT&T US 7.41
Deutsche Telekom Germany 7.02
KDDI Japan 6.96
Vodafone Group UK 6.38
Comcast US 6.34
Verizon US 6.32
Telecom Italia Italy 6.04
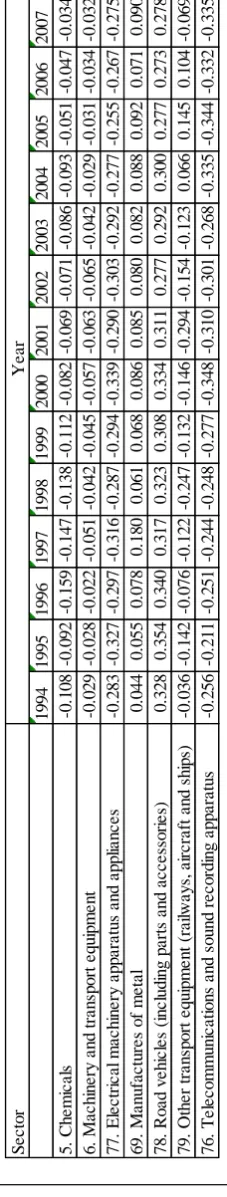
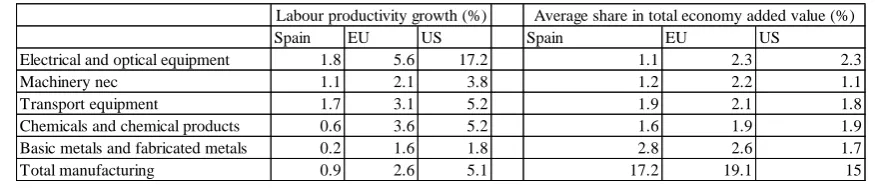
33 Three additional indicators, Balassa’s (1965) Revealed Symmetric Comparative Advantage (RSCA), labour productivity, and manufactures as percentage of GDP, corroborate this interpretation. Automotive, one of the few sectors that could claim a positive RSCA, had seen it decrease over time. Other sectors, like Chemicals, had experienced significant improvements toward achieving advantage but remained at negative levels. Electronics (including Components, Professional, and Consumer subsectors) also remained negative. Labour productivity also remained weak, especially when seen in comparative perspective. Not only did most manufactures perform weakly, but their contribution to the economy dropped significantly. A downward trend in manufacturing as a share of the economy has been a common trend among industrialised economies since the 1980s. However, Table 1.12 shows that the decline of manufacturing relative to the size of the economy has been more pronounced in Spain than in other large European economies.
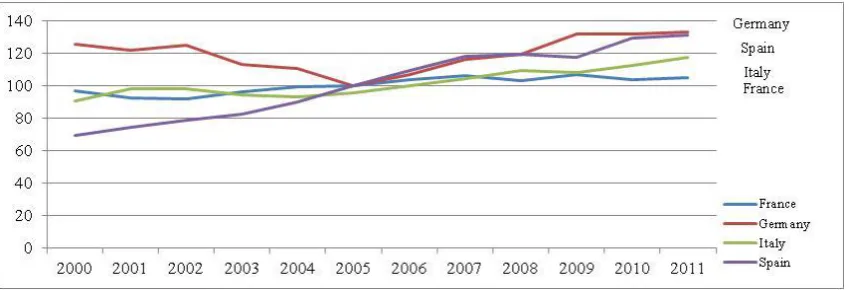
As mentioned earlier, the crisis that started in 2008 affected Spain more than most other countries in the EU. Banking was one of the most distressed sectors, but the crisis did not affect all segments in the Banking sector equally. As detailed in Chapter 2, large banks continued to expand abroad, so much so that, between 2008 and 2012, Banking accounted for 65 percent of Spain’s outward flows of productive investment (DataInvex, own calculations). Also, despite a continuous decrease in credit operations, narrow margins on interest rates, and the effort to increase provisions, by mid-2013 the benefits of large banks BBVA and Santander had already surpassed those obtained for the whole of 2012, which indicates their recovery, mostly through growth outside the EU (Santander 2013, BBVA 2013). The healthy rebound of Spain’s large banks contrasts starkly with the state of savings banks, which received 61 million Euros from the public Fund for Orderly Bank Restructuring (FROB) and were still in the midst of a transformation effort in 2013 (FROB 2013).
34 T able 1. 10 R eve a led Sy m m et ri c Compa rat ive Ad v a ntage 7
7 RCA= (exports country a in sector b/ Total export country a) / (World exports in sector j/Total world exports). RSCA=
(RCA-1)/(RCA+1) “World” includes data for the following countries: Australia, Austria, Belgium, Canada, Czech Republic, Denmark,
Finland, France, Germany, Greece, Hungary, Iceland, Ireland, Israel, Italy, Japan, Korea, Mexico, Netherlands, New Zealand,
Norway, Poland, Portugal, Spain, Sweden, Switzerland, Turkey, United States, and United Kingdom.
[image:34.595.112.226.67.668.2]35 Table 1.11 Compared labour productivity (1996–2007 average)
Table 1.12 Manufacturing as percentage of GDP in 1980–2009
Source KLEMS. Own elaboration
Table 1.13 Percentage change in financial variables in 2011 relative to 2007
Conceptual building blocks 4
There have been no efforts to understand upgrading in Spain and only partial attempts to define Spain’s institutional structure. The recent internationalisation of Spanish firms has been reflected in several case studies, many of them centred on the trajectories of single sectors, especially Banking (Casilda Béjar 1997, Meseuger 1999, López 2003, Guillén 2005, Canals and Noguer 2007, ESADE/ICEX 2008, Martínez 2008, Guillén and Tschoegl 2008, Guillén and García Canals 2010). These analyses contain valuable microeconomic insights but lack the macroeconomic perspective necessary to understand upgrading. The main contributions from
Spain EU US Spain EU US
Electrical and optical equipment 1.8 5.6 17.2 1.1 2.3 2.3
Machinery nec 1.1 2.1 3.8 1.2 2.2 1.1
Transport equipment 1.7 3.1 5.2 1.9 2.1 1.8
Chemicals and chemical products 0.6 3.6 5.2 1.6 1.9 1.9
Basic metals and fabricated metals 0.2 1.6 1.8 2.8 2.6 1.7
Total manufacturing 0.9 2.6 5.1 17.2 19.1 15
Source: OECD 2012 Economics department working paper N 973
Labour productivity growth (%) Average share in total economy added value (%)
Company Revenue Income
Long-term debt
Capital Expenditures
Telefonica 10 -31 16 18
Deutsche Telekom -10 56 -10 -10
France Telecom -2 28 9 16
BT -10 114 -21 2
[image:35.595.90.500.226.408.2]36 historical and political science perspectives (Pérez 1997, Pons 1999, 2002) concentrate on the analysis of the Banking sector during Francoism, and therefore are a partial precedent to my thesis. Finally, a few contributions written from the Varieties of Capitalism (VoC) perspective identify or mention Spain as a mixed or hybrid system (Molina and Rhodes 2007, Hall and Gringerich 2009). However, the VoC literature has not yet explored the structure and features of mixed systems.
To build my argument, I combined three building blocks, or literatures that tend to live in isolation: upgrading, state-centric and firm-centric.
Upgrading literature 4.1
Economic upgrading (often simply referred to as upgrading) is the process by which economic actors (nations, producers, workers) move up the Global Value Chain (GVC) by generating outputs that have more value added invested in them because they are better, are produced more efficiently, or require more complex skills (Gereffi, 2005, Gibbon and Ponte 2005, Pietrobelli and Rabelloti 2006, Gereffi and Fernandez-Stark 2011). The concept of upgrading implies that higher returns at the firm or sector levels generated by upgrading will lead to improvements in national socioeconomic conditions (Milberg and Wrinkler 2010). This likens upgrading to development, although the concept is broad enough to be applicable to countries that do not fit the standard definition of low income8, such as Spain.
Humphrey and Schmitz (2002) distinguish between four different types of upgrading: product, process, functional, and inter-sectorial9. However, most of the literature explores functional upgrading, which is identified with moves from assembly to original design and manufacture. Therefore, empirical studies tend to focus on the study of single manufacturing sectors that lend themselves to the hierarchical disaggregation of activities into the segments involved in transforming raw materials into final products. These studies are based on GVC methodology, which makes its main contribution through detailed microeconomic analyses based on input-output descriptions of value chains, the identification of lead firms, and the characterisation of control and coordination mechanisms within the chain. Upgrading, however, is difficult to quantify, to the point that Milberg and Wrinkler (2010) say that it is “one of those things that
8
The World Bank classifies economies according to annual gross national income per capital calculated using the World Bank Atlas method. In 2012, these groups were: $1,025 or less: lower middle income; $1,026 - $4,035: upper middle income; $4,036 - $12,475: and $12,476 or more: high income (World Bank Country Classifications).
9 Product upgrading is moving into more sophisticated product lines; process upgrading transforms inputs into outputs more
37 you know when you see it”. Therefore, the literature has used different variables to measure upgrading including productivity growth (Pieper 2000), changes in export value and foreign direct investment (Kucera 2001, Kucera and Sarna 2004), increases in market share and increases of price without losses in market share (Amighini 2006, Kaplinsky and Readman 2004), and Balassa’s (1965) RSCA (Rodriguez D’Acri 2011).
Although the GVC approach is suitable for applied microeconomic analyses of single manufacturing sectors, it falls short when the focus shifts to understanding the institutional features that enable upgrading. The approach also favours certain types of upgrading over others or in certain sectors. When the emphasis is on institutional factors, as is the case in this thesis, it is still crucial to understand the organisation of an industry, the trends that shape it, and its evolution. It is also necessary to identify the characteristics and roles of the main economic actors and to move from single- to multiple-sector analyses to establish comparisons and identify systemic patterns. Furthermore, when analysis is based on complex service sectors, most of the variables used by the literature to measure upgrading become unsuitable.
Upgrading assumes a shift in a country’s set of comparative advantages and, therefore, a departure from traditional Ricardian and Hecksher-Ohlin models that expect fixed resource endowments. This assumption indicates that although firms and sectors are pivotal in upgrading, states are also critical actors. This is because states have overarching capabilities that no other actor has which, coupled with their responsibility to provide basic collective goods, uniquely position them to change a nation’s resource endowment. The identification of both firms and the state as necessary actors points toward the two other building blocks necessary to understand the institutional enablers of upgrading: state- and firm-centric theories.
State-centric literature 4.2
The state-centric or statist literature (Rueschemeyes and Skocpol 1985, Evans 1995, Chandler 1997, Ross-Schneider 1998, Weiss 2003, Levy 2006, Rodrik and Hausmann 2006, Schmidt 2009, Rodrik 2011) views the state as a major force in economic transformation. This literature makes two fundamental contributions to the understanding of upgrading: it identifies the roles of the state in the economy, and it discusses the features that affect the state’s ability to play these roles effectively.
38 trade openness, the transformation of the Fordist production model, and technological advances have narrowed the state’s capacity to intervene directly in a nation’s economic production system (Glyn et al 1990, Ohmae 1991 and 1995, O’Brien 1992, Strange 1995, Evans 1997, Rothstein 1998, Friedman 1999). Other authors like Evans (1995), argue that reducing state activism to the state’s direct involvement in production is simply too narrow. Instead, Evans identifies three additional forms of state intervention: custodian (regulator), midwife (assisting in the emergence of new entrepreneurial groups or enticing existing ones to enter other fields), and husbandry (assisting existing business groups in meeting new challenges). In line with Evan’s broader view of the state’s roles, Levy (2006) contends that even if globalisation and the transformation of the Fordist model have limited the ability of the state to act as a producer, these changes have also enabled the emergence of new forms of state activism. He introduces the role of leader, which he defines as “framing and narrating crises, counteracting information asymmetries, projecting trust and credibility, extending agreements reached in one part of the economy to the rest, compensating losers, issuing influential recommendations, and fostering productive dialogue among social agents”. Whitley (1999) adds to this definition the organisation of interest groups, the assignation of coordinating and regulating functions to them, and the determination of conventions governing their forms of conflict resolution (collaboration versus antagonism).
States are not equally effective at playing the roles outlined above and, therefore, at making a positive contribution to upgrading. The statist literature (Johnsons 1982, Rueschemeyer and Evans 1985, Weir and Skocpol 1985, Amsden 1989, Evans 1995, Kaufmann et al 1999, Hellman and Kaufmann 2000, Weiss 2003, Levy 2006, Schmidt 2009) identifies three main factors that influence the state’s efficiency: autonomy, decentralisation, and financial resources. Skocpol (1985) defines an autonomous state as one that “formulates goals that do not simply reflect the demands or interests of social groups, classes, or society”. The literature has placed greater emphasis on assessing autonomy by determining whether the inverse, state capture, is taking place. Hellman and Kaufmann (2000) define state capture as efforts of firms to shape the process of creating state laws, policies, and regulations to their own advantage.