2016 International Conference on Artificial Intelligence and Computer Science (AICS 2016) ISBN: 978-1-60595-411-0
A Sample Profile-based Optimization Method with Better Precision
Xian-hua LIU*, Peng YUAN and Ji-yu ZHANG
Microprocessor Research & Development Center, Peking University, China {liuxianhua, yuanpeng, zhangjiyu}@mprc.pku.edu.cn
Keywords: Profiling, Sampling, Instrumentation, Compiler Optimization
Abstract. Conventional feedback-directed optimization is not widely adopted for the difficulties in generating representative training data sets. High runtime overhead and tedious re-compilation model obstruct its usability. Instruction-level hardware event sampling may overcome the drawbacks. There are still several challenges in creating accurate edge profiles, which is necessary to achieve competitive performance gains. This paper focuses on multiple hardware event profiles, supervised learning to discover patterns and generate heuristics to improve the precision of the instruction-level sample profile. We further enhance the efficacy of the smoothing algorithm used to construct the edge profiles from the instruction level and basic-block level samples. With these improvements, it is able to achieve about 70% of the performance obtained via instrumentation-based exact edge profiles for SPEC benchmarks, which also brings better performance of about 2.05%-13.81% improvement.
Introduction
Compiler optimizations benefit from dynamic information such as control edge execution frequency. This information may direct compiler to optimize for the frequent case, rather than using static profiles or conservatively assuming that all code is equally likely to execute. Profiling is used to provide this feedback to the compiler. Unfortunately, there are several shortcomings in traditional approach to profile-guided optimization. First, it requires re-compiling which significantly degrade productivity. Second, the instrumentation and FDO are tightly coupled, thereby preventing reuse of previous profile collection. Furthermore, collecting the execution profiles requires the appropriate execution environment and representative input, which may be difficult and slow.
These limitations often lead developers to avoid FDO compilation and its associated performance benefits. To overcome these limitations, we skip the instrumentation step altogether, instead of relying on sampling events generated by PMU to obtain estimated edge profiles. The sample profile data does not contain any information on the intermediate representation (IR) used by the compiler. Instead, source position information present in the debug section of unstripped binaries is used to correlate the profile data to specific basic blocks during the FDO build. In general, deriving exact basic block and edge frequency counts from sample profiles is not always feasible [10]. We use heuristics to derive relative basic block and edge frequency count estimates from the sample profiles.
Sampling is a statistical approach and its results are not exact. For example, consider the loop shown in Figure 1. The loop is comprised of one basic block that iterates 104166667 times. The first column of numbers in the figure shows the actual samples collected on an AMD Opteron machine. The sample counts vary by a factor of 2–3 from what they ought to be. Random sampling periods can be used to avoid synchronization. Certain hardware platforms support this directly by adding a small random value to the user provided sampling period. Additionally, our empirical results show that random sampling improves the uniformity of samples even in the absence of synchronization. In the example in Figure 1, there are 19 instructions in the loop and the sampling period 202001 is not a multiple of 19. The average sampling period changed to be 204080 due to randomization.
Previous work suggests approximating the amount of time that an instruction spends at the head of the instruction queue [2]. Estimating on superscalar with a deep cache hierarchy may be difficult.
An alternate strategy to mitigate these effects would be to rely on more precise hardware sampling. AMD processors provide instruction-based sampling (IBS), but, unfortunately, this facility only allows sampling instructions fetched (which include instructions on mispredicted paths) or μops retired (which are at a finer granularity than ISA instructions). Since the number of μops per instruction is unknown, using IBS also proves problematic [5].
fixed ramdom insns fixed ramdom insns
267 142 1212 272 0 1252 269 149 1197 9 577 95 237 532 523 475 502 454 512 498
400326: add $0x1,%rdx 40032a: or $0x2,%rdx 40032e: add $0x3,%rdx 400332: or $0x4,%rdx 400336: add $0x5,%rdx 40033a: or $0x6,%rdx 40033e: add $0x7,%rdx 400342: or $0x8,%rdx 400346: add $0x9,%rdx 40034a: or $0xa,%rdx
327 48 1504 266 141 1219 268 0 1255 487 724 633 565 762 999 532 0 591
40034e: add $0xb,%rdx 400352: or $0xc,%rdx 400356: add $0xd,%rdx 40035a: or $0xe,%rdx 40035e: add $0xf,%rdx 400362: or $0x10,%rdx 400366: add $0x1,%esi 400369: cmp %rcx,%rdx 40036c: jbe 400326 Figure 1. The sample counts measured on an Intel Clovertown for a loop consisting of one basic block.
On most modern superscalar processors, more than one instruction can retire in a given cycle. Unfortunately, the interrupt signaling the overflow of a performance counter happens immediately before or after a group of committing instructions, and the monitoring software records only one PC associated with the group. In Figure 1, we may observe that the cmp instruction receives no samples because it commits with the preceding instruction (they are not data dependent). Further, since other instructions are data-dependent, we see that the instruction with address 0x400356 executes approximately 30-cycles later. Fortunately, this aggregation is frequently contained within a single basic block. Consequently, while the sample counts for individual instructions may show significant variation due to multiple simultaneously retiring instructions, the basic block profiles derived by averaging these samples across all the instructions in the block exhibit significantly less variability.
Related Work
Some researchers have proposed sampling approaches without relying on performance counters. The Morph system collects profiles via statistical sampling of PC on clock interrupts. This solution has a major drawback for requiring new software standards. Their use of time-based sampling also skews basic block counts towards higher latency instructions.Levin [9] use sampled profiles of the instruction retirement hardware event to construct edge profiles for IBM’s FDPR-Pro. The problem of constructing a full edge profile is formalized as a Minimum Cost Circulation problem. In this paper, we extend their work by applying sampling to higher level compilation and show how machine learning and sampling additional counters improve the quality of sample profiles.
Alternatively, Conte et al. proposed sampling the contents of the branch-prediction hardware using kernel-mode instructions to infer an edge profile [3]. The profiling overhead is estimated to be between 0.4% and 4.6%. The basic block counts are then estimated from the sampled edge weights.
sampling has also been used in the context of just-in-time (JIT) compilation. Schneider [11] sample cache miss performance counters to optimize locality in a garbage collected environment. Like our work, the addresses collected during sampling have to be mapped back to the source code.
Specialized hardware has also been proposed to facilitate PMU-based profiling. ProfileMe was proposed hardware support to allow accurate instruction-level sampling [4]. Orthogonal to collecting profiles, recent work has studied the stability and accuracy of hardware performance counters. Their results show that subtle changes may lead to substantial variability in even the total number of instructions retired as reported by the performance counters.
Improving Profile Precision
In our sample-based FDO framework, the instrumentation step is skipped altogether. Instead, sample profiles gathered using profiling tools such as OProfile are used to create the feedback data. The total number of samples and number of contributing instructions mapped to a particular source line is recorded and stored in the feedback data file. During the feedback compilation, the compiler uses the profile to annotate the control flow graph. Due to errors and noise in sampling, these basic block counts will not be consistent. To make the counts consistent and to translate the profile from a basic block profile to an edge profile, we translate the problem into an instance of the minimum cost flow (MCF) problem. The details of formulating conversion problem in MCF can be found in [9].
While it may seem almost impossible to attribute an event to the instruction that caused it on an out-of-order processor [4], we have identified patterns in how events that should be attributed to one instruction are distributed among its neighbors by investigating micro-benchmarks and using machine learning techniques to find the correlation between different events. The quality of results obtained depend on the cost functions used in the formulation.
Table 1. Events and related weights from the SVM regression model.
Event mask Weight Event mask Weight
INST RETIRED INST RETIRED INST RETIRED
NONE 0 4
0.43 -0.1247 -0.1887
CPU_CLK_UNHALTED DTLB MISS
L1I MISS
NONE NONE NONE
0.2131 -0.1124 0.0092
Table 1 shows the results of applying this approach with the SPEC CINT2000 benchmarks used as training data. Four different hardware events were sampled, and the INST RETIRED event was configured with 4 different masks leading to a total of 7 different profiles. The instrumentation results are used as the real execution count to label the training data to obtain this table.
As expected, sampling the INST RETIRED event with randomization has the best correlation to the true execution frequency of a basic block. The DTLB miss event has a negative weight. Other events such as zero and multiple instruction retirements also result in a negative factor because of the aggregation effect. The automatically trained model shows which events could serve as the principal one, and it also provides information about which events can be used for supplement.
Since the instruction retired event with random sampling showed highest correlation, we chose it as the base profile to estimate basic block counts. Basic blocks with low confidence are further divided into two categories: blocks where the sample count is predicted to be larger than the true execution count, and those predicted to be smaller. The basic block classification information is used by the edge cost functions in the MCF algorithm to help make better smoothing decisions.
Recall that aggregation occurs for long-latency instructions. This occurs because a unit-latency instruction will be sampled if the instruction that retired approximately 30-cycles earlier overflowed the performance counter. However, since an instruction with latency L remains at the head of the instruction window between times t and t+L-1, it will be sampled if the counter overflowed anywhere between 30 and 30-L-1 cycles before the instruction issued. Consequently, an instruction’s chance of getting sampled increases proportionally to its latency. To model this aggregation, we must estimate the latency of each instruction. However, it is hard to measure latency since stall events are attributed to instructions approximately 30-cycles after the one that caused the event. Our observations show that most aggregation is caused by instructions that stall for significant (more than 30 cycles) amounts of time. Events measuring these long stalls are always attributed to the instruction that caused the overflow of the performance counters. We may only use events that lead to significant stalls. For each such event i, the stall duration (obtained from processor optimization manuals), stall durationi, multiplied by the sample count for the event, counti, gives the total number of cycles that a particular instruction stalled due to event i. Summing over all such stalls events gives an aggregation factor, A.
A = ∑stall durationi * counti
The shadow effect can be modeled by comparing the total number of cycles spent in a basic block to the number of instruction retired events attributed to the block. The difference between these two sample counts is the shadow factor S. Recall that the the delay in attribution does not affect time-based sampling, implying that the CPU CLK UNHALTED sample count should have proper attribution. Consequently, larger S implies two things. First, the basic block could legitimately have experienced high CPI. Alternatively, its instruction retirement samples could have been shadowed. In the first case, A should also be large. Consequently if L≥A then it is likely that the block’s samples have been shadowed. Conversely, if A > L and A is a significant fraction of spent cycles number, then it is likely that the block has aggregated too many instruction retirement samples.
Based on this classification, the MCF cost functions for basic blocks are adjusted. We are currently exploring differentially adjusting the forward and reverse weights using the specific classification.
Experimental Results
The sample profiles were collected using OProfile on an AMD Opteron machine with a sampling period of 202001. Random sampling, with a randomization mask of 0xFFF, was used to improve the quality of the samples.With these parameters, a sample was taken after every 202001 + (rand() & 0xFFF) instructions retired. The overhead was measured to be less than 2% of the actual runtime.
We used the degree of overlap metric [9] to evaluate the quality of the profiles independent of the FDO optimizations they will be used with. The degree of overlap metric compares the similarity of two edge profiles annotated onto a common control flow graph. The definition is as follows:
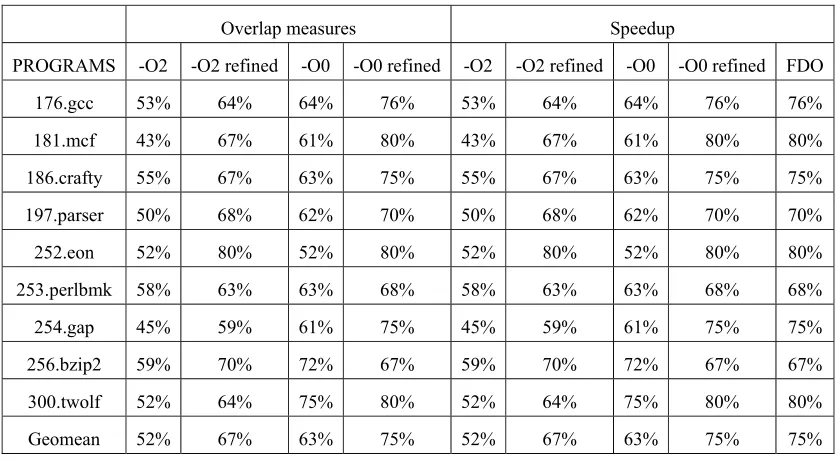
PW(e, W) = W(e) / ∑W(e’), overlap(W1, W2) = ∑min(PW(e,W1), Pw(e,W2)) W is a map from edges to weights, E is the set of edges in the CFG, and PW computes the normalized weight of an edge. If two profiles agree exactly, the overlap is equal to 1 (or 100%), the sum of the normalized edge weights over the CFG. Table 2 shows the overlap between the raw samples and the instrumented profiles and the overlaps for SPEC CINT2000 benchmarks. The table shows the results obtained on binaries compiled with both -O2 and -O0. The table shows that in all but one case, the overlap improves, and on average the refinements improve overlap by 15%.
[image:5.612.97.516.385.615.2]The true measure of quality for the profiles is how well they enable feedback-directed optimizations. The speedup column of Table 2 shows the speedup obtained by using FDO over a baseline binary compiled without FDO. The baseline and FDO binaries were all compiled using the -O2 flag. The -O2 and -O0 in the legend refer to optimization flags used for the binary that was sampled to collect profiles. For most cases, better precision leads to better performance. On average, sample-based FDO on -O2 binaries with our refinements provides a speedup of 3.79% compared to 2.94% without the refinements. On binaries optimized with the -O0 flag, sample-based FDO with our refinements provides a 4.46% speedup compared to 3.09% without the refinements. We believe the majority of the difference between -O2 and -O0 stems from poor source line information.
Table 2. Overlap measures and speedup for SPEC CINT2000 benchmarks.
Overlap measures Speedup
PROGRAMS -O2 -O2 refined -O0 -O0 refined -O2 -O2 refined -O0 -O0 refined FDO
176.gcc 53% 64% 64% 76% 53% 64% 64% 76% 76%
181.mcf 43% 67% 61% 80% 43% 67% 61% 80% 80%
186.crafty 55% 67% 63% 75% 55% 67% 63% 75% 75%
197.parser 50% 68% 62% 70% 50% 68% 62% 70% 70%
252.eon 52% 80% 52% 80% 52% 80% 52% 80% 80%
253.perlbmk 58% 63% 63% 68% 58% 63% 63% 68% 68%
254.gap 45% 59% 61% 75% 45% 59% 61% 75% 75%
256.bzip2 59% 70% 72% 67% 59% 70% 72% 67% 67%
300.twolf 52% 64% 75% 80% 52% 64% 75% 80% 80%
Geomean 52% 67% 63% 75% 52% 67% 63% 75% 75%
corresponds to several basic blocks. The performance for this benchmark would no doubt improve with better source position information.
Conclusions
We designed and implemented a framework to use hardware event sampling and source position information to drive feedback-directed optimizations. By using multiple profiles and supervised learning to refine the profile precision, sampling-based FDO can achieve good overlap with the true execution frequencies and competitive speedups when compared with the instrumentation-based approach. However, samplingbased FDO provides better portability and usability while incurring negligible overhead. Our experiments show that the proposed techniques are feasible for production use on out-of-order platforms, and the precision/performance can be further improved with more precise source position information.
The results presented here represent an initial implementation. Our ongoing work is exploring using the over-sampled/under-sampled basic block classification to further tune the MCF smoothing algorithm. We are also investigating heuristics to avoid precision loss due to code duplicating optimizations. We also plan to explore hybrid models, where instrumentation is used selectively to profile areas of the application where sampling is too inaccurate. By carefully controlling where instrumentation is inserted, we believe the overhead can be kept low enough to allow the instrumented binaries to be used in production.
Further, while our current implementation focuses on generating edge profiles, we plan on exploring using other types of profiles, such as cache miss profiles to guide code- and data-layout optimizations, and branch misprediction profiles to guide if-conversion. Ultimately, we believe these additional profiles facilitated by hardware event sampling will significantly improve the profitability of feedback-directed optimization.
Acknowledgement
We would like to thank the anonymous reviewers. This research was financially supported by the National Science Foundation of China, under grant No.6130004.
References
[1] Glenn Ammons, Thomas Ball, and James R. Larus. Exploiting Hardware Performance Counters with Flow and Context Sensitive Profiling. Proc. of SIGPLAN Conference on Programming Language Design and Implementation, Las Vegas, Nevada, June 1997.
[2] Jennifer M. Anderson, Lance M. Berc, and et al. Continuous Profiling: Where Have All the Cycles Gone? ACM Transactions on Computer Systems, 15(4): 357–390, 1997.
[3] Thomas M. Conte, Burzin A. Patel, and at al. Hardware-Based Profiling: An Effective Technique for Profile-Driven Optimization. International Journal of Parallel Processing, 24(2):187–206, 1996. [4] Jeffrey Dean, James E. Hicks, Carl. Waldspurger, William E. Weihl, and George Chrysos. ProfileMe: Hardware Support for Instruction-Level Profiling on Out-of-Order Processors. Proc. of ACM/IEEE International Symposium on Microarchitecture, IEEE Computer Society, 1997.
[5] Paul J. Drongowski. Instruction-Based Sampling: A New Performance Analysis Technique for AMD Family 10h Processors. Advanced Micro Devices, Inc., November 2007.
[6] Nathan Froyd, John Mellor-Crummey, and Rob Fowler. Low-Overhead Call Path Profiling of Unmodified, Optimized Code. Proc. of International Conference on Supercomputing, Arvind and Larry Rudolph, eds., ACM, Cambridge, Massachusetts, June 2005.
[8] Steve R. Gunn. Support Vector Machines for Classification and Regression. Ph.D. Thesis, University of Southampton, 1998.
[9] Roy Levin, Gad Haber, and Ilan Newman. Complementing Missing and Inaccurate Profiling using a Minimum Cost Circulation Algorithm. Proc. of International Conference on High Performance Embedded Architectures and Compilers, Goteborg, Sweden, January 2008.
[10] R.L. Probert. Optimal Insertion of Software Probes in Well-Delimited Programs. IEEE Transactions on Software Engineering., 8(1): 34–42, 1982.
[11] Alex J. Smola and Bernhard Scholkopf. A Tutorial on Support Vector Regression. Statistics and Computing, 14(3): 199–222, 2004.
[12] Omri Traub, Stuart Schechter, and Michael D. Smith. Ephemeral Instrumentation for Lightweight Program Profiling. Harvard University, Cambridge, Massachusetts, June 2000.