2016 International Conference on Manufacturing Science and Information Engineering (ICMSIE 2016) ISBN: 978-1-60595-325-0
Research on Spacecraft Dynamic Interface
Force Identification Based on Strain Detection
XIANGFAN SONG, KE XIONG, DONG DU, CHUANQIAN SHI
and XUBIN ZHOU
ABSTRACT
The static/dynamic interface force between spacecraft and rocket is an important reference for spacecraft structure design. The most conventional dynamic force identification method is finite element simulation combined with the telemeter acceleration data, which restricts the spacecraft design level owing to the large error. A dynamic force identification method according to the detected strain field of attachment and its optimization plans are proposed. Three-way strain rosettes are mounted outside the docking ring densely. And the six Degree Of Freedom force can be derived by strain field. Considering the requests of engineering application, under the premise that detection result would meet the accuracy requirement, an optimization plan which reduce the detecting point is proposed. Results of dynamic simulation show that, only X direction bending moment identification error is 19.8%, and other loads identification error are below 10%. The test results show that both identification errors of static and dynamic load are below 20%, which can meet the engineering requirements.1
INTRODUCTION
With the rapid development of carrying capacity, the spacecraft is developing towards large-size, heavy-duty[1]. The static/dynamic interface force between spacecraft and rocket is an important reference for spacecraft structure design. Three direction loading conditions of attachment are stipulated by rocket user manual in
Xiangfan Song, Ke Xiong. Nanjing University of Aeronautics And Astronautics, State Key Laboratory of Mechanics And Control of Mechanical Structure, Nanjing , China.
the form of quasi static overload of centroid[2]. This is the safety criteria of spacecraft structure design. And it is also the main standard for the mechanical environment test of whole spacecraft. In fact, the telemetry data show, these loading conditions are much higher than the actual data. In addition, in recent years, research institutions have recognized that, there is a big difference between the test mechanical impedance and the mechanical impedance of mounting structure in the real flight. In conventional vibration test of space hardware, the acceleration input at the interface between the test article and the mounting structure is controlled to a specification which is the envelope of the acceleration peaks in the flight environment. This traditional approach of testing is known to produce great over-testing to the test article at its own resonance frequencies[3-4]. These problems seriously restrict the ability of lightweight design of spacecraft structure.
Force limited vibration testing is a technique to alleviate the problem of ‘over-testing’. NASA successfully applied the force limited test technology to engineering practice in the 90's of 20th Century[5-8]. Therefore, it is important to accurately get the load spectrum of satellite attachment.
The most direct way to measure the load of attachment in launching is cascade the force sensor be-tween spacecraft and the launch vehicle. But this put forward higher requirements on the development of force sensor and connection structure. At the same time, this will weaken the connection stiffness and strength of interface. It is possible to change the mechanical properties of satellite and rocket [9]. According to the typical satellite connection structure, Zhang Yong Tao[10] has proposed a method to identify the interface load through strain monitoring. By using Euler beam assumption, a linear mapping from strain to six degree of freedom is established. The deficiency is that there are obvious stress / strain field distortion in the area which is connected with the baffle plate, which has great influence on the accuracy of load identification.
An identifying method based on continuous strain field of attachment is proposed in current study. The identification accuracy is not affected by the structure of attachment itself and the connection structure. The problem that baffle plate reduce the accuracy of load identification is solved[10]. Under the premise of ensuring the accuracy, an optimization scheme for reducing the strain detection point is proposed. The effectiveness and applicability of the method are verified by simulation experiments. Finally, the applicability and accuracy of the method are illustrated by equipment test.
THEORETICAL ANALYSIS
attachment
backpanel
(a) (b)
baffle plate
(a) is schematic diagram of the whole satellite, (b) is schematic diagram of the satellite without lower side panel
Figure 1. Schematic diagram of typical satellite structure.
Because the diameter of the attachment is far larger than its thickness, the attachment could be assumed to thin plate ring. Thin plate hypothesis is suitable for attachment.
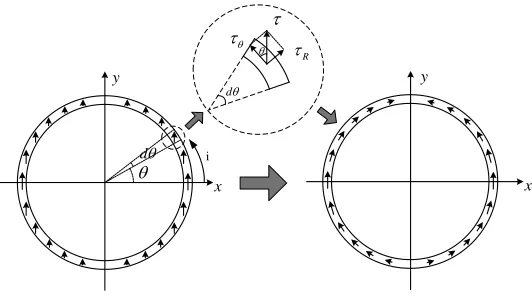
As shown in Figure 2, cylindrical coordinate system is established. The three-directional strain rosettes are arranged on the periphery of the attachment. According to the measured strains of 0o, 45o and 90o, the hoop normal strain, Z normal strain and hoop shear strain can be deduced according to formula (1).
90
0
45 0 90
2 z
z
(1)
where:0o、45o、90oare strains of 0°, 45°, 90°, z is Z normal strain, is hoop normal strain, z is hoop shear strain.
According to thin plate hypothesis, where radial stress and strain are very small and negligible, Z normal stress and hoop sheer stress can be deduced by formula (2).
2
1
2(1 )
z z
z z
E
E
(2)
d
x y
d
R
i
y
[image:4.612.166.432.84.235.2]x
Figure 3. Schematic diagram of shear stress distribution.
When applied X, Y direction sheer and Z direction torque, attachment would generate shear stress. As shown in Figure 3.
According to thin plate hypothesis, where radial stress and strain are negligible, shear stress is only distributed along the hoop direction.
0
R
(3)
X, Y direction sheer force and Z direction torque could be deduced by formula (4) through hoop sheer stress.
2
0
2
0 2
0
cos sin y
x
z
F t Rd
F t Rd
T R t Rd
(4)
[image:4.612.229.366.487.638.2]where:t is thickness of attachment,R is diameter of attachment, is angle of micro cell.
Since the measured point is discrete,formula (4) could be changed to following form. 1 1 1 2 2 cos( ) 2 2 cos( ) 2 n y i n x i n z i i R
F i t
n n
i R
F i t
n n
R
T i t R
n
(5)Similarly, X, Y direction bending moment and Z direction pull force could be deduced by formula (6) through Z normal stress.
1 1 1 2 2 cos( ) 2 2 cos( ) 2 n y i n x i n z i i R
M i t R
n n
i R
M i t R
n n
R
F i t
n
(6) SIMULATION VERIFICATIONIn order to verify the correctness of the theoretical model, a finite element model is established, which is shown in Figure 4.
As shown in Figure 4, the Aluminum alloy model attachment diameter is 1m, height is 0.3m, thickness is 10mm. Baffle plate thickness is 10mm.
Static Simulation
CORRECTNESS CHECKING
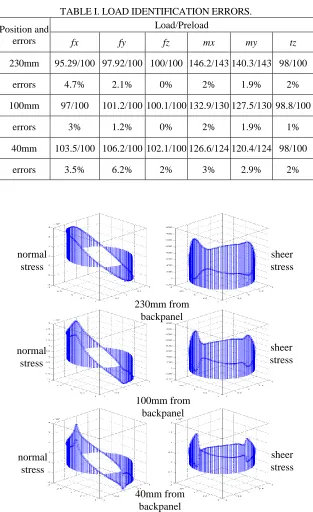
TABLE I. LOAD IDENTIFICATION ERRORS. Position and
errors
Load/Preload
fx fy fz mx my tz
230mm 95.29/100 97.92/100 100/100 146.2/143 140.3/143 98/100
errors 4.7% 2.1% 0% 2% 1.9% 2%
100mm 97/100 101.2/100 100.1/100 132.9/130 127.5/130 98.8/100
errors 3% 1.2% 0% 2% 1.9% 1%
40mm 103.5/100 106.2/100 102.1/100 126.6/124 120.4/124 98/100
errors 3.5% 6.2% 2% 3% 2.9% 2%
230mm from backpanel normal
stress
sheer stress
normal stress
normal stress
sheer stress
sheer stress 100mm from
backpanel
40mm from backpanel
Figure 5. Schematic diagram of stress distribution.
meanwhile baffle plate is thin. When under load, the baffle plate can be regarded as a concentrated force loading on the attachment, which matches characteristics of concentrated force loading on elastic half plane in elastic mechanics.
However, simulation results of TABLE I shows, no matter how long the vertical distance from back panel to measuring point is, no matter how much the concentrated force characteristics of baffle plate is, the load identification error is very small. What above shows is that, the load identification method could ensure high measurement accuracy excluding the effect of baffle plate.
SCHEME OPTIMIZATION
According to the engineering requirement, arranging a circle of strain detection points in the periphery of the attachment is not realistic. According to the distribution characteristics of stress concentration, a series of optimization schemes are proposed. Reducing the measuring points, meanwhile ensuring the accuracy of load identification.
Schematic diagram of stress distribution shows, in the position of 40mm from the back panel, the effect of stress concentration is almost disappeared beside baffle plate 10 nodes. The stress distribution of remaining part of attachment is almost uniformly.
The optimized schemes are proposed as follow:
1 6 11 24 38 52 66 71 76 81 86 99
113
151 146
141 127
156
161
174
188
202
216 221 226 231236 249
263 277
291 296
first quadrant
third quadrant second quadrant
[image:7.612.191.402.411.610.2]fourth quadrant
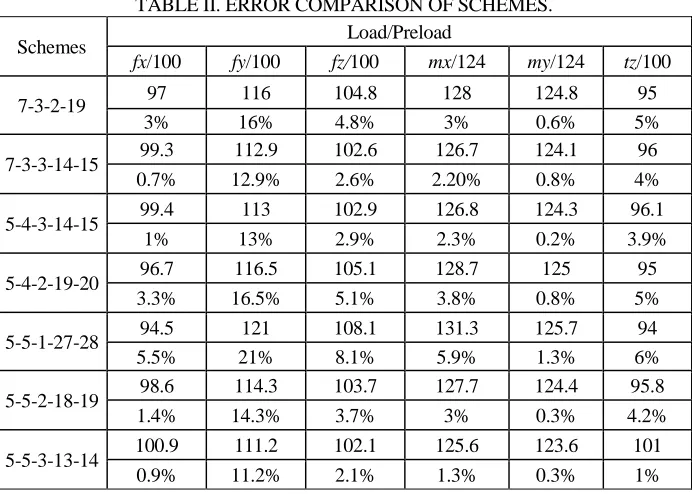
TABLE II. ERROR COMPARISON OF SCHEMES.
Schemes Load/Preload
fx/100 fy/100 fz/100 mx/124 my/124 tz/100
7-3-2-19 97 116 104.8 128 124.8 95
3% 16% 4.8% 3% 0.6% 5%
7-3-3-14-15 99.3 112.9 102.6 126.7 124.1 96
0.7% 12.9% 2.6% 2.20% 0.8% 4%
5-4-3-14-15 99.4 113 102.9 126.8 124.3 96.1
1% 13% 2.9% 2.3% 0.2% 3.9%
5-4-2-19-20 96.7 116.5 105.1 128.7 125 95
3.3% 16.5% 5.1% 3.8% 0.8% 5%
5-5-1-27-28 94.5 121 108.1 131.3 125.7 94
5.5% 21% 8.1% 5.9% 1.3% 6%
5-5-2-18-19 98.6 114.3 103.7 127.7 124.4 95.8
1.4% 14.3% 3.7% 3% 0.3% 4.2%
5-5-3-13-14 100.9 111.2 102.1 125.6 123.6 101
0.9% 11.2% 2.1% 1.3% 0.3% 1%
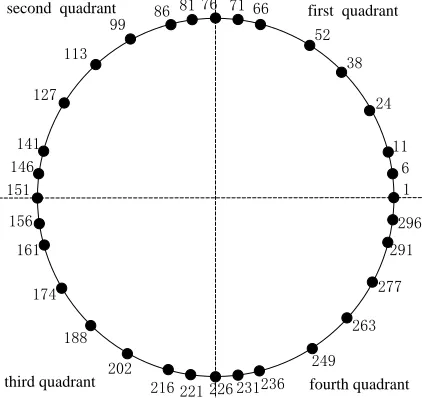
According to the characteristic of stress distribution, 5 detection points are arranged around the baffle plate. The interval of detection points is 5 nodes. 3 detection points are arranged in other areas. Calculating the load identification error and optimizing the schemes.
Detection points layout scheme 5-5-3-13-14 is shown in Figure 6.
In Figure 6, node numbers are expressed by Arabic numerals. In scheme 5-5-3-13-14, the first 5 presents the number of detection points around baffle plate in one quadrant. The second 5presents interval nodes of detection points around baffle plate. 3presents number of detection points in other areas of one quadrant. 13, 14 presents interval nodes of detection points in other areas.
Calculating the identification error of optimization schemes in the position of 40mm from the back panel and the results are shown in TABLE II.
As shown in TABLE II, the static load identification error of scheme 5-5-3-13-14 is smallest. What’s more, the identification error becomes smaller with the increase of the number of checkpoints outside the stress concentration area.
Dynamic Simulation
measured. Calculating the identification result of scheme 5-5-3-13-14 and the whole strain field. The comparison result is shown in Figure 7.
As shown in Figure 7, the max identification error of scheme 5-5-3-13-14 is X direction bending moment. The error is 19.8%. The maximum identification error of other load is not more than 10%. Scheme 5-5-3-13-14 can accurately identify the frequency and amplitude of the peak of dynamic simulation, which verifies the correctness of the theoretical model and the feasibility of optimization scheme.
Fx Fy
Fz
Mx My
Tz
0 100 200 300 400 500 -2.0x10⁴ 0.0 2.0x10⁴ 4.0x10⁴ 6.0x10⁴ 8.0x10⁴ 1.0x10⁵ 1.2x10⁵ 1.4x10⁵ 1.6x10⁵ A m plit ude Frequency/Hz strain field 5-5-3-13-14
0 100 200 300 400 500 0 1x10⁴ 2x10⁴ 3x10⁴ 4x10⁴ 5x10⁴ A m plit ude Frequency/Hz strain field 5-5-3-13-14
0 100 200 300 400 500 0.0 5.0x10³ 1.0x10⁴ 1.5x10⁴ 2.0x10⁴ 2.5x10⁴ A m plit ude Frequency/Hz strain field 5-5-3-13-14
0 100 200 300 400 500 -2.0x10⁴ 0.0 2.0x10⁴ 4.0x10⁴ 6.0x10⁴ 8.0x10⁴ 1.0x10⁵ 1.2x10⁵ 1.4x10⁵ 1.6x10⁵ 1.8x10⁵ A m plit ude Frequency/Hz strain field 5-5-3-13-14
0 100 200 300 400 500 0.0 2.0x10⁴ 4.0x10⁴ 6.0x10⁴ 8.0x10⁴ 1.0x10⁵ 1.2x10⁵ 1.4x10⁵ A m plit ude Frequency/Hz strain field 5-5-3-13-14
0 100 200 300 400 500 0 1x10⁴ 2x10⁴ 3x10⁴ 4x10⁴ 5x10⁴ 6x10⁴ A m plit ude Frequency/Hz strain field 5-5-3-13-14
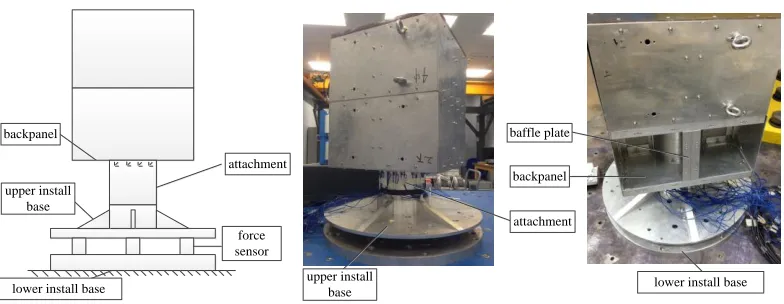
baffle plate attachment
upper install base
lower install base
force sensor backpanel
upper install base
backpanel attachment
[image:10.612.103.495.91.243.2]lower install base
Figure 8. Schematic diagram and physical map of typical satellite structure.
EQUIPMENT TEST VERIFICATION
A group of equipment was designed to conduct the equipment test, verifying the rightness of the theoretical analysis and simulation.
Schematic diagram and physical map of typical satellite structure are shown in Figure 8.
The equipment is fixed on the lower install base. Static load is applied on the equipment. Recording the direction and numerical of static load and strain gauge data real-time. According to the strain gauge data, calculating the load, which compared with the real load applied. And then, the identification error would be obtained.
Two different working conditions static load was applied on the equipment. And the identification error is shown in Figure 9
As shown in Figure 9, under two different working conditions, only one load identification error is 20%, and the other loads identification errors are around 10% or below, meeting the engineering requirements. The comparison of two working conditions shows that the identification error is smaller when the equipment is subjected to heavier load. The reason is that, the stain has lesser change when applied smaller load. Strain change of some checkpoints is only several micro-strain, while the drift of strain gauge could be 2-3 micro-strain.
And then, the dynamic test was conducted.
The equipment was fixed on the single degree of freedom platform vibrator. Applying excitation, sweeping frequency 5-200Hz, and magnitude is 0.3g. Results of dynamic test is shown in Figure 10.
Fo rc e/ N Fo rc e/ N 3.8% 5.7% 9.1% 2.1% 5.6% 5% 6.4% 8.2% 20% 8% 11% 1%
First working condition Second working condition
fx fy fz mx my tz
0 100 200 300 400 500 600 700 actual value calculate value
fx fy fz mx my tz
0 100 200 300 400
500 actual value
[image:11.612.104.499.117.268.2]calculate value
Figure 9. Results of static test.
Fx Fy
Mx My
20 40 60 80 100 120 140 160 180 200 0 2 4 6 8 Am p litud e Frequency/Hz actual value calculate value
20 40 60 80 100 120 140 160 180 200 0 1 2 3 4 5 6 Frequency/Hz Am p litud e actual value calculate value
20 40 60 80 100 120 140 160 180 200 0.0 0.5 1.0 1.5 2.0 2.5 3.0 3.5 Frequency/Hz Am p litud e acctual value calculate value
[image:11.612.113.494.214.633.2]20 40 60 80 100 120 140 160 180 200 0 1 2 3 4 5 Frequency/Hz Am p litud e actual value calculate value
CONCLUSION
The most conventional dynamic force identification method is finite element simulation combined with the telemeter acceleration data, which restricts the spacecraft design level owing to the large error. A dynamic force identification method according to the detected strain field of attachment was proposed. The identification accuracy was not affected by the structure of attachment itself and the connection structure.
The three-directional strain rosettes were arranged on the periphery of the attachment. According to the measured strains, the six degree of freedom load could be deduced. The correctness has been verified by simulation. According to the engineering requirement, a series of optimization schemes were proposed. The accuracy of the optimization schemes was verified by simulation and equipment test. Results of dynamic simulation show that, only X direction bending moment identification error is 19.8%, and other loads identification error are below 10%.The test results show that both identification errors of static and dynamic load are below 20%, which can meet the engineering requirements.
REFERENCES
1. M. J. Balas. 1982. Trends in large Space Structure Control Theory: Fondest Hope, Wildest Dreams. IEEE. Trans. Automat. Contr. 27(3):522-535.
2. China Academy of Launch Vehicle Technology. LM-3A series launch vehicles user’s manual issue[S]. Beijing: China Academy of Launch Vehicle, 2011.
3. Scharon TD, Force Limited Vibration Testing Monograph. NASA Reference Publ.RP1403, May 1997.
4. Soucy Y, Cote A.2002.Reduction of over testing during vibration tests of space hard ware. Canadian Aeronautics and Space Journal. 48(1): 77- 86.
5. Scharton T D, Chang K. 1997. Force limited vibration testing of the cassini spacecraft and instruments. In: IES 17thAerospace Testing Seminar. Los Angeles, USA.
6. Worth D B. 1997. A method for implementing force-limited vibration control. Journal of the IES. 40(4): 34-41.
7. Chang K Y, Scharton T D. 1998. Cassini spacecraft force limited vibration testing. Sound & Vibration, 32(3):16-20.
8. Davis G L. 1998. An analysis of nonlinear damping and stiff-ness effects in force-limited vibration for reduction of over-testing. Rice University, Houston, USA.
9. Zhang Jun-gang,Ma Xing-rui, Pang He-wei. 2008. The Force Limited Application in Satellite Central Tube Vibration Test. Journal of Astronautic. 29(4):1147-1150.
10. Zhang Yong-tao, Zhou Xu-bin, Du Dong, Wang Jian-wei, Shi Chuan-qian. 2015. An Identification Method for Satellite-launcher Dynamic Interface Force. SPACECRAFT