2017 2nd International Conference on Computer Science and Technology (CST 2017) ISBN: 978-1-60595-461-5
Analysis of Flight Fuel Consumption Based
on Nonlinear Regression
Jing-jie CHEN
1,Yong-ping ZHANG
2,aand Juan HU
31,2College of Electronic Information and Automation, Civil Aviation University of China, Tianjin, China
3College of Economics and Management, Civil Aviation University of China, Tianjin, China
Keywords: Engineering, Nonlinear regression factor, Fuel consumption, Energy
conservation.
Abstract. For to increase fuel utilization and reduce carbon emissions of flights, the relationship between each factor and fuel consumption was established using real flight data and nonlinear regression algorithm. By counting the flight data of different flights (model A330), the fitting model of fuel consumption and fuel consumption was established, and the contribution of minor change of each factor to fuel consumption was also analyzed. The results show that this method can achieve better generalization ability and describe the relationship between the fuel consumption and the various factors. This method serves as a means to evaluate the effectiveness of energy saving and emission reduction, and provides technical guidance for dispatchers to analyze fuel economy.
Introduction
The international response to climate change is becoming increasingly grim and the Aviation Industry is about to be integrated into the global emission control system. How to reduce the consumption of flight fuel, making its commercial transport emissions under the Kyoto Protocol, is the major problems of aviation industry. Simultaneously, fuel costs are an important direct operating cost for air transport operators. The airline's energy consumption cost accounts for 94% of the total aviation industry. The company's flight fuel cost accounts for about 99% of the company's total energy consumption. Therefore, the change in fuel prices directly influences the cost of the flight. For this reason, the entire commercial aviation is working hard to improve energy efficiency [12]. Airline energy-saving emission reduction technology mainly includes aircraft performance optimization, flight operation optimization, air traffic control, etc. in order to minimize the fuel consumption [3].
relationship model based on the flight process which related the fuel flow and height in the decline and climb phase [8];For the entire flight phase, a fuel consumption model based on support vector machine is established by Xuhui Wang [9]; Rayc.chang establishes a fuel consumption model based on fuzzy control for flight trajectories [10];Baklacioglu.tolga study in the process of single flight, aiming different time airspeed, height changes corresponding to different time changes in jet fuel, to
establishment of genetic algorithm based on fuel consumption
model[11];Baklacioglu.T use aerodynamics to establish a thrust model to optimize flight trajectories [12];Similarly, Matthias Bartel proposed the model of the relationship between thrust and fuel consumption to achieve fuel saving purposes [13]; Baklacioglu.T takes neural networks and genetic algorithm to establish a flight trajectory to predict fuel rates at different times during flight [14]; However, the above literature on the fuel consumption exist some limitations. Most of them take a specific flight as an example on time series level to analyze the flight characteristics of a single flight and then establish a model to predict the flight at different times during the fuel consumption. They are lacking practical application.
QAR is a quick access to the recorder which covers most of the monitor parameters of aircraft flight operation quality. Majority case of flight fuel consumption is based on QAR at home and abroad. Simultaneously, the data of the QAR recorder is used to analyze the main factors that influence the fuel consumption. The A330 model is used as the sample to analyze the data. From the macroscopic point of view, we analyze the characters of flight and establish a model. In this study, the least squares method and the nonlinear regression model were used to analyze the influence of each parameter on fuel consumption and a single factor variable interval is given. It makes the cost of fuel consumption more economical and provides practical reference to flight refueling, flight operations, air traffic control.
Analysis of Segment Factors
Aircraft performance, trajectory and meteorological factors are the main factors that affect the fuel consumption of the aircraft. Simultaneously the fuel consumption characteristics are quite different at different stages of the flight. According the energy conservation dynamics formula studied by Bella P [7], the energy conservation is:
T D
E = E + ΔKE + ΔPE (1)
Among them, ET is engine thrust work, ED is resistance, ΔKE is kinetic energy, ΔPE is the potential energy:
xT f n
0
E = f(V, h,W , T) = F dx
(2)
xD W
0
E = f(V,W, h, S , T) = Ddx
(3)
2 2
2 1
ΔKE = f(V,W) = W(V - V ) 2g (4)
2 1
Therefore, the fuel consumption of fuel B is:
D W
T f
E +ΔKE + ΔPE B = f(V,W, h, S , T) =
E W T
(6) From the fuel consumption formula can be concluded that the closely relationship between the fuel consumption and flight speed, starting weight, flight height, wing areas, flight time in the process of fight. According to the parameters of the QAR record, the flight process is divided into five stages: Run, climb, cruise, descent and landing. Due to effect of the flight status, the fuel economy of the aircraft is different in different flight stages. The aircraft present ladder path in the phase of the climb and down. The track of cruise section determines the final state of the climb and the start state of the decreased. So, we study on the section of climbing, cruising, descent.
Method Analysis
The fuel consumption of the flight segment is affected by many factors and it has a significant nonlinear relationship with fuel consumption. Obtaining single factor from multiple related factors is the basic and important aspect of fuel economy research. Large amounts of data can be used to validate statistical regression model. Least squares fitting method is used to parameter estimation. If the dependent variable Y has a linear relationship with the explanatory variables X, the linear regression model between them can be expressed as (where b0, b1 is the regression coefficient, u is the random disturbance term):
0 1 1
= + +
Y b b x u (1)
The linear regression model uses the general least squares (OLS) to estimate the parameters, the following are basic assumptions:
Zero mean assumption:
( )
i =0; =1,2,...,E u i n (2)
The same variance assumption:
(
)
2 2
( ) ( ) ; 1, 2,..., , 0; ; , 1, 2,...,
σ
= Ε = =
= ≠ =
i i u
i j
Var u u i n
Cov u u i j i j n
(3) The random error term is not related to the independent variable X:
(
j, i)
=0; =1, 2,..., , =1, 2,...,Cov x u i n j k
(4)
The random error term
μ
obeys the normal distribution which the mean is zero andthe variance is
σ
2:(
2)
~ (0,σu u N
(5) Assumption:
(
)
2 22
0 1 ˆ ˆ
ˆ ( )
=
i =
i− i =
i− −Q e Y Y Y b b x
derivative of bˆ0 andbˆ1, and make it equal to zero. We can get bˆ0, bˆ1 after the equation is
solved. After the above analysis, the regression equation is obtained:
ˆ ˆ
ˆ
i 0 1
Y = b + b x (7)
Because of ) ˆ ( ) ˆ
(Y Y Y Y Y
Yi− = i− i + i− (8)
Further
(Y−Y)2= (Y−Yˆ)2+ (Yˆ−Y)2i i
i
i (9)
And the total deviation of the square sum, the regression square sum, residual squared sum, respectively:
−= (Y Y)2
TSS i (10)
−= (Yˆ Y)2
RSS i (11)
−= ( ˆ)2
i i Y
Y
ESS (12)
Therefore:
ESS RSS
TSS= + (13)
In the program operation, the optimal parameter estimate is fitted which using the minimal total deviations sum as the evaluation criteria.
Flight Fuel Consumption Model
Fuel Consumption Performance Model of Takeoff Slip
As the aircraft slip on the road before taking off, the factors that affect the fuel consumption of the takeoff slip include the takeoff weight, the airport temperature and humidity, the wind speed and direct, the runway pavement, etc. Using the data parameters recorded by the A330’s aircraft QAR analyze the correlation between the fuel consumption of the takeoff slip stage and the main factors. Using the correlation coefficient represent it as follows:
= = = − × − − × − = × = n i n i y i x i n
i i x i y xy y x y x Y D X D Y X 1 1 2 2 1 ] ) ( [ ] ) ( [ ) ( ) ( ) ( ) ( ) , cov( μ μ μ μ ρ (14) In the above formula, and represent the fuel consumption of a flight and the sample vector of a certain influencing factor. μy,μx represent the mean ofY,X . The two
Table 4-1. Correlation coefficient of oil consumption and main influencing factors in takeoff skating. Influence factor Weight of takeoff Airport temperature
Correlation coefficient 0.58 0.7
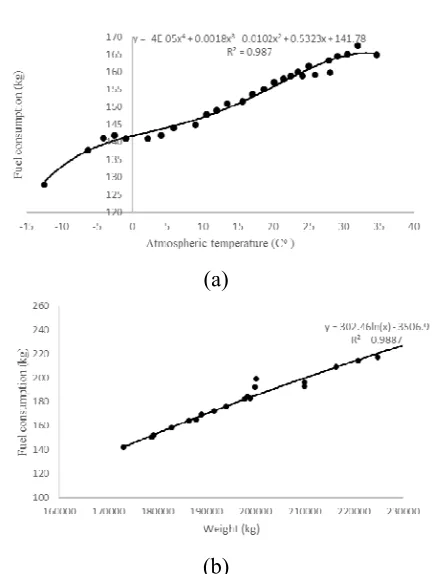
Figure 1 (a) shows the data statistic samples of the relationship between the fuel consumption and the airport temperature and the takeoff weight and the relationship curve with the least squares method in the takeoff skating stage. The corresponding expression is:
-5 4 3 2
A330, T
2
y = -4.0 10 x + 0.0018x - 0.0102x + 0.5323x + 141.78, R = 0.987
×
(15)
2 A330 w
y , = 302.46ln(x) - 3506.9, R = 0.9887 (16)
Among, yA330,W , yA330,T represent oil consumption which respectively only
considered the airport temperature and the weight of taking off in the phase of the takeoff slip, x represent the airport temperature or the weight of taking off, and hereafter and in the text, R2mean the curve fit goodness, which is defined as:
= =
− − =
~n
i
y i
~n
i
y i y y R
1
2 1
2
2
) (
) ˆ (
μ
μ
(17)
In
{
y
i}
in=1,{
y
ˆ
i}
ni=1 represent n sample values and a corresponding fit value,y
μ represent the mean of sample n
i i y} 1
{ = .The samples include 3411 shifts of figure 1.
(a)
[image:6.612.198.414.64.351.2](b)
Figure 1. Regression diagram of A330 takeoff weight, temperature and slip stage oil consumption point.
When the takeoff weight and the wind speed are constant, it can be seen from fig. (a) that the oil consumption increases as the temperature increases. Because of the increasing of temperature and the decreases of the air density, which makes the thrust of the engine decrease and the aircrafts accelerate slowly and finally can’t reach the take-off speed. These reasons result in increasing take-off distance and fuel consumption. From the graph (b), it is concluded that the flight fuel consumption linearly increases with the increase of the takeoff weight and thrust.
Performance Model of Climbing Segment Fuel Consumption
In the short-range route, the fuel consumption of the climbing section is the main component of the overall fuel consumption. Table 4-2 shows the proportion of the segment fuel consumption of some typical segments of climbing.
Table 4-2. Specific route climbing section fuel consumption ratio table of A330.
According to the data in table 4-2, in the short-range route, the climbing flight times account for less than 15%, while the climbing fuel consumption accounted for more than one third of the total fuel consumption of the flight. So, it is indispensable to analysis the fuel consumption of the climb section. Many factors affect aircraft in the climbing section. From the air traffic control route to the climate impact, as well as flight personnel flight operations, all of them have a direct or indirect impact on fuel
Flight model A330-200 Bei Jing-Xi An Bei Jing-Chong Qing Climb time accounted for 14.7% 13.1%
[image:6.612.135.476.560.625.2]consumption. At present, the research on the climbing section is also paid more attention, but mainly is the study of the fuel consumption model. This article mainly focuses on the reasonable control of fuel consumption for the purpose of fuel saving.
[image:7.612.196.419.215.301.2]Table 4-3 lists the four greatest degree of correlation with the climbing fuel consumption factors that are extracted from the QAR data logger and the correlation coefficient corresponding to the oil consumption of the climb. Among the four main factors, we mainly analyze two factors that is the takeoff weight and the climb rate. Using the data which are obtained from QAR data record establishes fuel consumption model of the climbing segment corresponding to the above two factors.
Table 4-3. Degree of association of main factors of A330 of aircraft and climbing.
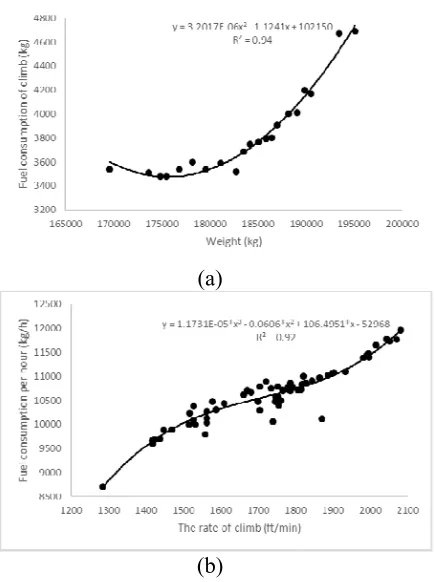
Fig.2 (a) shows the data sample statistics and the least squares fitting curve of the relationship between the oil consumption and the takeoff weight of the A330.The sample is A330 which vertex height is 38000ft, the climb rate is between 1500ft and 2000ft, the temperature is between -10oC and 10oC and the wind is less than 30knot. We
randomly choose a sample which is selected from ten samples. Using the least squares fitting, the relationship between the fuel consumption (kg) and the takeoff weight (kg) of the A330-200 aircraft climbing section is:
-6
-6 2
= 3.2017 10 - 1.1241 + 102150
= 3.2017 10 ( - 175547) + 3483.60 = 0.94
× ×
2 A330
2
y x x
x
R (18)
It can be seen from figure 2 (a) that A330-200 aircraft show a upward trend on the parabolic shape of the trend. From formula (18), the minimum fuel consumption point of A330-200 aircraft climbing section is:
a rg m in{ } = 1 7 5 5 4 7 ( )
m in { } = 3 4 8 3 .6 ( ) A 3 3 0
x A 3 3 0
y k g
y k g (19)
The deployment of the takeoff weight, whether it is a short range or a long voyage of A330-200 aircraft, has a reasonable range of takeoff weight. Within a reasonable rang of load, it can make climbing fuel costs more economical. According to formula (19), estimating in the extreme deviation from the range of 25%, this model of economic take-off weight of the upper limit is:
{
}
-63483.6 0.25
max = + 175547 = 192039( ) 3.2017 10
× × A330
x kg
(20) From formula (18) and formula (19), they give the economic take-off weight of climbing section of A330-200 that is 175t ~ 192t. The fuel consumption increases significantly when it is more than 192t.
Figure 2 (b) reflects the sample statistics and least squares fit curve of the relationship between the fuel consumption performance index and data rate of There
Influencing factors Correlation coefficient Weight of taking-off 0.53
Atmospheric temperature 0.37
Climb rate 0.83
are 287 samples taken from Bei Jing - San Ya. The flight model used in this route is
A330.These samples which the temperature is -10 ℃ and 10 ℃, the wind is between
15kont and 30kont and the takeoff weight is between 180t and 190t was taken from each four samples. Using least squares, the relationship between the fuel consumption (kg / h) and the climb rate (Ft / min) of A330-200 is as follows:
-5
= 1.173 10 - 0.0606 + 106.491 - 52968 = 0.92
× 3 2
A330 2
y x x x
R (21)
The first derivative of the climb rate is:
-5 2
= 3.519×10 ( - 1722.1) + 2.137
A330
dy
x
dx (22)
(a)
[image:8.612.201.418.232.523.2]
(b)
Figure 2. The relationship between take-off weight and fuel consumption in climbing section of A330-200 and the relationship of climb rate and climbing fuel consumption index per hour.
From fig. 2 (b) and formula (21), it can be seen that the hourly fuel consumption increases monotonically with the climb rate increasing. But if the climb rate control in a certain range, it can make fuel consumption performance indicators will not rapidly increase due to climb rate increased . Above two formula in (22) , the upper limit of the economic climb rate of this model which is estimated by the range of 25% of the extreme point in (22) is:
{
}
-5 2.137 0.25max = + 1722.1
3.519 10 = 1845.31( )
× × A330
x
ft / min (23)
Table 4-4. Economic climb rate. Flight model Economic climb
rate Remarks
A330-200 1700-1850ft/min More than 1850ft / min fuel consumption increased significantly
For this model , the takeoff weight in the 175t ~ 192t and the climb rate control in the 1700-1850ft / min can achieve economic fuel consumption of the climb, but the fuel consumption will increase significantly over this limit.
Fuel Consumption Performance Model of Cruise Section
For the long voyage route, the fuel consumption of the cruise section accounts for the largest part of the entire fuel consumption, and it is also the longest flight time part of the flight in this section, where the flight is relatively stable and the influencing factors are relatively fixed. The research on the fuel consumption performance index for different cruising altitude has reference value for the route planning of the route control department.
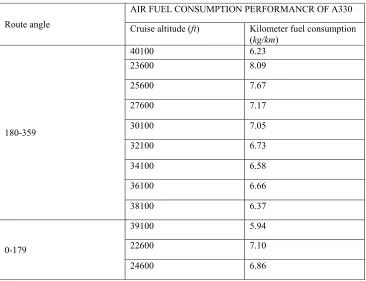
The tables 4-5 give samples of fuel consumption data for different cruise altitude from the A330 aircraft's 8461 shift QAR data logger. Correlation coefficient of the cruise stage fuel consumption and cruise altitude is -0.53. In the study, the height layer is divided into two categories according to the true route angle, the main reason for this method is the following two aspects: first, the RVSM airspace structure is adopted in China. Because the implementation of this method makes the high area utilization rate greatly improved and the aircraft in the airspace in the movement of a certain regularity, which is easy to manage and analyze; second, in the opposite direction of the aircraft in the cruise direction, the aircrafts are affected by the wind from different direction, resulting there is a difference in the fuel consumption during the same route.
Table 4-5. Aircraft cruise altitude and fuel consumption performance data of A330.
Route angle
AIR FUEL CONSUMPTION PERFORMANCR OF A330 Cruise altitude (ft) Kilometer fuel consumption
(kg/km)
180-359
40100 6.23
23600 8.09
25600 7.67
27600 7.17
30100 7.05
32100 6.73
34100 6.58
36100 6.66
38100 6.37
0-179
39100 5.94
22600 7.10
[image:9.612.124.490.443.724.2]26600 6.64
29100 5.99
31100 6.20
33100 6.04
35100 5.70
37100 5.74
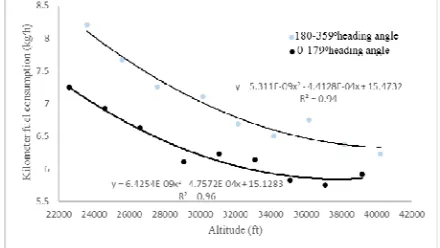
A330 aircraft fuel consumption performance curve of the formulas is:
-9 -4
-9 2
= 5.31110 - 4.4128 10 +15.4732
= 5.311 10 ( - 41544) + 6.307 = 0.94
× ×
o 2
A330,180~359
2
y x x
x
R (24)
-9 -4 -9 2
= 6.425 10 - 4.7572 10 + 15.1238
= 6.425 10 ( - 37021) + 6.318 = 0.96
× ×
×
o
2 A330,0 ~179
2
y x x
x
[image:10.612.207.427.360.484.2]R (25)
Figure 3 shows the fuel consumption performance curve of the A330 aircraft with the cruise altitude change from table4-5 samples data.
Figure3. The relationship between cruise altitude and mileage fuel consumption of A330 aircraft.
The fuel consumption performance curves of A330 are showing a parabolic form within the range of two route angle. It is not the higher the cruise altitude is, the better the fuel consumption performance is. As seen from the figure 3, the fuel consumption per kilometers in the 0 ~ 179 ° route angle is smaller than in the same height of 180 ~ 359 ° route angle. Through (24) and (25), these two routes angle of A330 aircraft, in the 180 ~ 359 °, 0 ~ 179 ° range, the minimum of the fuel performance indicators and corresponding cruising altitude are:
x
arg min{ } 41544
min{ } 6.307
o
o
A330,180 ~ 359
A330,180 ~ 359
y = (ft),
y = (kg / km)
(26)
arg min{ } = 37021( ),
min{ } = 6.318( )
o
o A330,0 ~179 x
A330,0 ~179
y ft
y kg / km
When the fuel consumption performance index value corresponding to the minimum value of the target by 1 percentage point increases, the corresponding cruising altitude for the best cruise altitude deviation interval are:
) ( 3446 10 311 . 5 01 . 0 307 . 6 9 359 ~ 180 , 330 ft
xA =
× × =
Δ −
(28) ) ( 8 . 3135 10 425 . 6 01 . 0 318 . 6 9 179 ~ 0 , 330 ft
xA =
× × =
Δ −
(29)
The height deviations represented by the formulas (28) and (29) have exceeded 3000ft, that is the interval of the 3 height layers. If the fuel consumption performance index increases 2.5%, the cruise altitude deviates from the optimum height is about 5000ft, and it is to be a distance of 5 heights. Therefore, the corresponding cruise altitude lower limit can be selected as:
{
}
{
}
min arg
2.5 36095
o o
o A330,180 ~ 359 x A330,180 ~ 359
A330,180 ~ 359
x = y
Δx = (ft)
min (30)
{
}
{
}
min arg 2.5 32062 o oA330,0 ~ 179 x A330,0 ~ 179
A330,0 ~ 179
x = y
Δx = (ft)
min
(31)
The fuel consumption performance model of the cruise altitude can provide more sophisticated basis for the airline route optimization settings. According to the model, for large aircraft and long voyage routes, the higher economic cruise altitude can be chosen to avoid low altitude corridor conflicts caused by the cruise altitude migration, as far as possible not increasing the burden on the crew. Analyzing the relationship between the cruise altitude and the fuel consumption (especially for long flight) can provide information for air traffic control regulation, and ultimately achieve the purpose of save flight fuel.
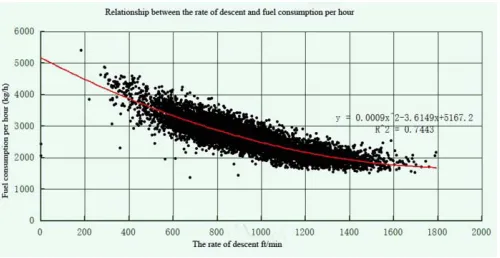
Fuel Consumption Performance Model within Approach Segment
The figure 4 shows the data statistics samples of the relationship in the A330 model down fuel consumption performance indicators between the fuel consumption y and the reduction rate x. It also shows the curve of the least squares method. In the figure 4, the relational expression between this model fuel consumption performance indicator y and the reduction rate x expressed as:
2
= 0.0009 - 3.6149 + 5167.2 = 0.0009( - 2008.28) + 1537.3( )
= 0.7443
2 A330
2
y x x
x kg / h
Figure 4. Average descent rate and mileage fuel consumption data point regression diagram in descent phase.
By (32), the minimum fuel consumption performance indicators of this model and the corresponding optimal rate of decline is:
arg min{ A330} = 2008.28( )
x y ft / min (33)
And the fuel consumption performance indicator increases 1 percentage point corresponding to the minimum amount of the performance indicator, the corresponding reduction rate to the optimal rate of deviation from the interval:
min) / ( 695 . 130 0009 . 0
01 . 0 3 . 1537
330 ft
xA =
× =
Δ
(34) The descending phase of the fuel consumption performance indicator and the reduction rate curve is an upward opening the parabola, which means that the decline is not the greater the reduction rate in the more fuel-efficient stage. At the same time, the passenger comfort and flight safety issues that the large reduction rate leads to can’t be ignored. Therefore, considering the various factors, in terms of the fuel economy, we can choose a rate of decline in the vicinity of the best rate of decline in the rate range. According to the different definition of fuel consumption index, the fuel consumption index model and the deviation ratio of the percentage drop in fuel consumption index, the A330 aircraft descent rate should be less than the optimal value 2008.28 ft/min, the upper and the lower limit deviations from the minimum performance index are 5% and 15% respectively. The corresponding lower and lower limits are:
min) / ( 04 . 1716 5
28 . 2008 }
max{xA330 = − ΔxA330 = ft (35)
min) / ( 10 . 1502 15
28 . 2008 }
min{xA330 = − ΔxA330 = ft (36)
From (35) to (36), the A330 aircraft reduction rate can be chosen from 1500ft / min to 1700ft/min. Analyzing the relationship between the rate of decline and fuel consumption can provide a reference for the development of flight plan and guidance for flight operations.
Departure Weight and Fuel Consumption Relationship Model
9 . 4246 0542
.
0 +
= x
y (37)
The small incremental deviation model is:
x x
dx dy
y= Δ = Δ
Δ 0.0542
(38) That is the departure weight reduces 1kg each time, the whole progress can reduce the fuel consumption about 0.0542kg. It can analyze the influence of the fuel consumption on the starting weight and provide the reference value for the current problem of the uncertainty in weight standards.
Conclusion
Without affecting the safety of the aircraft, in order to effectively reduce the fuel consumption of the aircraft operation process and increase the utilization of the fuel resource as far as possible. Analyzing the large number of statistical data of the A330 flight, we use the non-linear regression to deeply study the influence of a single factor to the fuel consumption and give the economic interval of the relevant factors at all stages. It can not only make the flight achieve the best fuel-efficient flight status, but also provide the reference value for China energy-saving emission reduction program.
Acknowledgement
This work is supported by National Science and technology project support plan (Grant No.2012BAC20B03) and Science and Technology Research Funds of CAAC (Grant No.MHRD 201121).
References
[1] Lee. Joosung, J. Lukachko, Stephen P. Waitz. Ian A., Annual Review of Energy and the Environment, 2001, 26:167-200.
[2] Morrison James K D, John Hansman R, Sgouridis Sgouris. Game Theory Analysis of the Impact of Single Aisle Aircraft Competition on Fleet Emissions[C].11th AIAA Aviation Technology, Integration, and Operations (ATIO) Conference, Including the AIAA BalloonSystems Conference and 19th AIAA Lighter-than-air Technology Conference, 2011.
[3] Knorr Dave, Chen Xing, Rose Marc. Estimating ATM Efficiency Pools in Descent Phase of Flight: Potential Savings in both Time and Fuel[C]. Proceedings of the 9th USA, ATM 2011, 2011, (407-415).
[4] Cavcar Aydan, Aircraft Engineering and Aerospace Technology,2004, 76(5):502-515.
[5] Chen Y, Yi J, Dong X M, Zhi J H, Shi C,2016, (06):1015-1020. In Chinese. [6] Li H, Zhang YA, Sun F C, Li W H, Control and Decision,2013, (03):379-384+390. In Chinese.
[8] Ralf H, Mayer. Change-Oriented Aircraft Fuel Burn and Emissions Assessment Methodologies[C], ICNS 2012: Bridging CNS and ATM - Conference Proceedings, 2012: N51-N515.
[9] Wang X H, Chen X F. A Support Vector Method for Modeling Civil Aircraft Fuel Consumption with ROC Optimization[C], Proceedings - 2nd International Conference on Enterprise Systems, ES 2014, 2014:112-116.
[10] Ray C Chang. Fuzzy Sets and Systems, 2015, 269:115-134.
[11] Baklacioglu Tolga. Aerospace Science and Technology, 2016, 49(2):52-62. [12] Baklacioglu, T. Aeronautical Journal, 2014, 118(1199):65-79.