Development Writ Small
Thomas William O’Keeffe
A thesis submitted to the Department of Economics of the
London School of Economics for the degree of Doctor of
I certify that the thesis I have presented for examination for the PhD degree of the Lon-don School of Economics and Political Science is solely my own work other than where I have clearly indicated that it is the work of others (in which case the extent of any work carried out jointly by me and any other person is clearly identified in it).
The copyright of this thesis rests with the author. Quotation from it is permitted, provided that full acknowledgement is made. In accordance with the Regulations, I have deposited an electronic copy of it in LSE Theses Online held by the British Library of Political and Economic Science and have granted permission for my thesis to be made available for public reference. Otherwise, this thesis may not be reproduced without my prior written consent.
I warrant that this authorisation does not, to the best of my belief, infringe the rights of any third party.
I am extremely grateful to the Palanpur team for welcoming me with open arms, particu-larly Himanshu, Ruth Kattamuri and Nicholas Stern. My thanks go to Sarthak Gaurav for all his work on the data and his limitless patience with my questions about it. Gajanand Ahirwar provided excellent research assistance and insight on the ground.
I am indebted to Robin Burgess, my supervisor, for his advice and support throughout. Gharad Bryan, Greg Fischer, Camille Landais, Gerard Padro i Miquel and seminar par-ticipants at LSE have provided extremely useful comments and advice at various points of the process.
I acknowledge financial support from an ESRC Studentship.
Clare Balboni, Florian Blum, Milad Khatib-Shahidi, Stephan Maurer, Jonathan Pinder, Francesco Sannino, Matthew Skellern, Eddy Tam, Torsten Walter, Guo Xu and many others, have been great colleagues and friends during my time at LSE. They have all contributed immeasurably to both my research and experience of the PhD process.
Many thanks must go to my family, both old and new. Lesley, Paul and Emily - you have always been there for me. Barbara, Andrzej and Leonard - spędziliśmy wspólnie już wiele wspaniałych chwil - nie mogę się doczekać kolejnych.
This thesis is concerned with using micro-level data to examine important features of the process of development which occur on a much larger scale. Using a uniquely long and detailed dataset for a single village in India, allied with data from other sources, we explore what development at the level of a village can tell us about development at the level of a state or country. In the first chapter we introduce the village setting of this thesis - Palanpur, describe the data, and document the broad features of development experienced by the village over the course of 60 years. We focus on changes in employ-ment, education, migration within the village - and relate these to the development of India or other areas where appropriate. The overriding picture is one of a village which has been touched by the outside world. The Green revolution initiated sustained growth in agricultural productivity. Large numbers have moved out of subsistence agriculture into non-agricultural pursuits, many of these outside the village. There have been sub-stantial increases in education, migration, and income levels - similar in magnitude to other areas of India.
hold true even at the level of a single village in India. The pattern of sectoral realloca-tion in terms of both income and employment shares is strikingly similar and consistent with the extant stylised facts at all levels. This result has important implications for the way we should think about the complementarity of agricultural and non-agricultural development.
1. Palanpur: Development Writ Small 12
1.1. Introduction . . . 13
1.2. Palanpur 1957-2015 . . . 16
1.3. Contributions of the Palanpur Data . . . 23
1.4. Employment in Palanpur . . . 25
1.5. Education in Palanpur . . . 27
1.6. Migration in Palanpur . . . 30
1.7. Summary . . . 32
A. Appendix to Chapter 1 37 A.1. Variable Definitions . . . 37
2. The Fractal Nature of Structural Transformation 39 2.1. Introduction . . . 40
2.2. Stylised Facts and Data . . . 47
2.2.1. Data . . . 49
2.3. India . . . 52
2.4. Uttar Pradesh . . . 59
2.5. Moradabad District . . . 62
2.6. Palanpur . . . 65
2.8. Conclusion . . . 74
B. Appendix to Chapter 2 83 B.1. Appendix Figures . . . 83
3. The Long Run Effects of Networks: Evidence from Palanpur 84 3.1. Introduction . . . 85
3.2. Palanpur . . . 91
3.3. Caste in Palanpur . . . 94
3.4. Patterns of Change for Castes . . . 98
3.5. Dynasties in Palanpur . . . 105
3.6. Distribution of Outside Employment . . . 108
3.7. Network Sizes . . . 111
3.7.1. Caste Networks . . . 112
3.7.2. Dynasty Networks . . . 114
3.7.3. Competitive Networks . . . 116
3.8. Event Study . . . 118
3.8.1. Outside Employment . . . 118
3.8.2. Regular Employment . . . 127
3.9. Dynamics of Job Networks in Palanpur . . . 135
3.9.1. Theoretical Framework . . . 135
3.9.2. Empirical Strategy . . . 138
3.9.3. Outside Employment Results . . . 140
3.10. Migration . . . 148
C. Appendix to Chapter 3 163
C.1. Appendix Figures . . . 163
C.2. Caste Descriptives . . . 164
C.3. Network Descriptives . . . 165
C.4. Robustness of Long Run Network Effects . . . 168
1.1. Village Descriptives . . . 22
1.2. Male Education in Palanpur by Year . . . 28
1.3. Female Education in Palanpur by Year . . . 29
1.4. Percentage of Out-Migrants . . . 30
1.5. Households Migrating Out . . . 31
1.6. Education by Migration Status . . . 32
A.1. Variable Definitions . . . 38
3.1. Caste Sizes by Year . . . 97
3.2. Mean Real Income Per Capita by Caste-Year . . . 99
3.3. Households by Caste-Year . . . 107
3.4. Distribution of Outcomes Within Networks . . . 110
3.5. Caste Network Sizes for Males . . . 113
3.6. Dynasty Network Sizes for Males . . . 115
3.7. Competitive Network Descriptives - Males . . . 117
3.8. Outside Employment Caste Networks . . . 123
3.9. Outside Employment Dynasty Networks . . . 126
3.10. Regular Employment Caste Networks . . . 131
3.11. Regular Employment Dynasty Networks . . . 133
3.12. Outside Work Beaman Caste Regressions . . . 141
3.14. Outside Employment Beaman Dynasty Regressions - Split Cohort . . . . 145
3.15. Migration Effects of Outside Employment . . . 153
C.1. Mean Real Income Per Capita by Caste-Year . . . 164
C.2. Competitive Network Descriptives - Caste . . . 166
C.3. Competitive Network Descriptives - Dynasty . . . 167
C.4. Robustness of Long Run Effects to Alternative Network Sizes . . . 169
C.5. Robustness of Long Run Effects to Alternative Network Sizes . . . 170
C.6. Robustness of Long Run Effects to Alternative Network Sizes . . . 171
1.1. Palanpur in 2009 . . . 17
2.1. Sivasubramoniam (2000) GDP shares against GDP per capita . . . 53
2.2. Sectoral Shares of Indian GDP . . . 55
2.3. Income per Capita in Palanpur and Beyond . . . 58
2.4. Agricultural Productivity in Palanpur and Beyond . . . 61
2.5. Agricultural Income in Palanpur and Beyond . . . 64
2.6. Employment in Palanpur by Sector . . . 66
2.7. Employment in Agriculture in Palanpur and Beyond . . . 70
B.1. GDP shares against GDP per capita . . . 83
3.1. Regular Employment by Adult Males of Selected Castes . . . 100
3.2. Outside Employment by Adult Males of Selected Castes . . . 102
3.3. Education by Adult Males of Selected Castes . . . 104
3.4. Event Study Graph - Outside Employment - Caste . . . 119
3.5. Event Study Graph - Outside Employment - Dynasty . . . 121
3.6. Event Study Graph - Caste . . . 128
3.7. Event Study Graph - Dynasty . . . 130
Palanpur: Development Writ Small
1.1. Introduction
In recent years there has been a focus on panel data with large numbers of individuals over short time periods which are used to answer many questions in development. In this thesis we ask what we can learn about the process of development from another type of dataset: one which examines the same individuals over a long time period. There are interesting and important features of development which by their nature take time, and therefore cannot be examined without this time dimension. The Palanpur data upon which this thesis is based contains individual level data that span 1957 to 2015.
The reason for the general focus on panels which span short time periods in develop-ment is obvious. One cannot simply collect 60 years of data at a given time, it takes 60 years to collect it. This is typically longer than an academic career, thus the incentives are not strong for academics to establish panels which are focused on long run questions. In developed countries some of this space is occupied by national statistical offices who have the capacity to invest in long run panels. The longest running of these is the United States Panel Study of Income Dynamics which began in 19681, more than 10 years after
the commencement of the Palanpur data. Other countries have household panels which begin usually in the 1980s and 1990s - for example Germany, United Kingdom, Canada and Japan. However, in developing countries there are generally greater concerns for national governments than collecting panel data, even if the country has the state capa-city to do so. Notable household panel data which exist in developing countries include the Indonesian Family Life Survey which began in 1993, the KwaZulu-Natal Income Dy-namics Survey (KIDS) of KwaZulu-Natal province in South Africa which began in 1993 and was extended in 2008 to the National Income Dynamics Survey (NIDS) which covers
the whole country.
Those panel studies which are closest to the Palanpur data are those in India and Bangladesh. The Additional Rural Incomes Survey and Rural Economic and Demo-graphic Survey (ARIS-REDS) panel from the NCAER includes four rounds between 1971 and 20062. The International Crops Research Institute for the Semi-Arid Tropics (ICRISAT)
Village Level Studies began in 1975 with a sample of 240 households from six villages in two Indian states. It has been extended at different times to include households from a further fourteen villages. However, these surveys are samples of households within villages rather than a census, so they are prone to losing households through death or splitting of households (Foster and Rosenzweig (2002)). Similar in spirit, if not in con-tent, is the Health and Demographic Surveillance System in Matlab, Bangladesh, which began registering all births, deaths and migrations in 149 villages in 1966. While there have been occasional censuses undertaken, there is only detailed economic data for a representative sample in 1996.
We are fortunate to have access to a panel of detailed information from a single village in India beginning in 1957 and ending in 2015. This is a longer timespan than the World Bank’s World Development Indicators. It is also longer than 61% of the country-level GDP series from the Penn World Tables data (version 9), Feenstra et al. (2015).
These data are incredibly detailed on many dimensions. They consist of 7 surveys which are undertaken as censuses of the village. Data collected by enumerators include demographics, land ownership, cultivation, land rental, outstanding loans, occupation, labour contracts in which village residents are engaged, wage rates, income, nutrition and consumption. Although the exact dimensions upon which data were collected varies
2See Foster and Rosenzweig (2002); Foster and Rosenzweig (2004) or the NCAER website for details of
by survey, the demographic, employment, land ownership, and education data are avail-able for the full period. There is also a huge amount of qualitative data and observations, including diaries kept by researchers for many months.
During the period covered by the Palanpur data, India has experienced a huge amount of change. In 1957 India was a young independent country, seven years after completion of their constitution, with a GDP per capita of 944 in 2011 international dollars3. While
by 2015 India was one of the world’s fastest growing economies, and the 3rd largest in PPP terms4. GDP per capita in 2014 was 5,452 in 2011 international dollars. The
de-velopment of India in this period has not just been economic. Life expectancy at birth has risen from 39.65 between 1955-1960 to 67.57 between 2010-2015, in the same period under-five mortality has fallen from 255 to 52 per 1,000 live births5. Coincident to this
improvement in health outcomes, India has experienced a demographic transition - total fertility as measured by children per woman has declined more than 50 percent6.
Palan-pur is uniquely positioned to explore the causes and consequences of this tremendous change at the micro level.
These data are able to help us to answer a number of questions which are important to development economists. Have the increases in economic development transferred to the rural poor? Have these improvements in well-being changed the income distribu-tion? What have been the causes and consequences of these changes in relative income? What determines who migrates away? Has this changed over time? The data also allow us to truly examine intergenerational effects, not just look at contemporaneous effects of parental states as is common in the literature due to data limitations. It also may be
3Output-side real GDP per capita from PWT 9.0 4Feenstra et al. (2015)
5United Nations (2017)
that comparisons across space, in lieu of available longitudinal data, result in different answers due to confounding locational fundamentals or other confounders about which we are unaware. The use of a single location over a long time period avoids this potential pitfall.
This chapter describes in detail the setting and data for this thesis, and the experience of this village over nearly 60 years of study. The following section introduces Palanpur and describes the broad changes it has experienced during the study period. Clearly we are not the first to examine this panel. Palanpur data have been the source of many important contributions to the understanding of Indian development, and development more generally. These are discussed in Section 1.3. The subsequent sections examine Palanpur in more detail, with emphasis on its employment (Section 1.4), education (Sec-tion 1.5) and migra(Sec-tion (Sec(Sec-tion 1.6) patterns during the 60 year study period. Sec(Sec-tion 1.7 concludes and introduces the following chapters of this thesis which focus on specific questions which can only be answered with data such as these.
1.2. Palanpur 1957-2015
Palanpur is probably the most famous of India’s 640,930 villages7. It has been studied by
social scientists since 1957, when the Agricultural Economics Research Centre (AERC) of the University of Delhi began their first survey. The village has since been visited by surveyors in every decade, in 1963/64, 1974/75, 1983/84, 1993, 2008/10 and 20158. The
data is now of such length that it includes a number of great-grandchildren of original 1958 survey members.
7Ministry of Rural Development, 2012. http://mospi.nic.in/Mospi_New/upload/SYB2014/ch42.html
(Ac-cessed 4/8/16)
8For simplicity, from now on I will refer to the surveys as 1958, 1964, 1975, 1984, 1993, 2009 and 2015
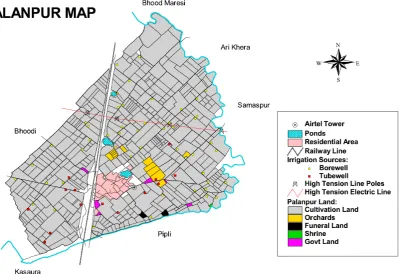
Figure 1.1.: Palanpur in 2009
Note: GIS Map of Palanpur in 2009
Source: Palanpur Survey Team. Constructed by Ruchira Bhattacharya, Himanshu and
Palanpur was not chosen because it was unique, it was just one of many villages chosen to be part of the AERCs continuous village surveys. The reason we remember it and study it still is that Christopher Bliss and Nicholas Stern were looking for baseline data to examine the impacts of the “green revolution”, and went back to re-survey Pa-lanpur in 1974. Nicholas Stern has been involved in every survey of PaPa-lanpur since. While the intention of the original surveys was the study of agriculture, they collected data on many aspects of the village. Bliss and Stern chose Palanpur because it was not dominated by “an unusual craft or crop”, and because it was “large enough to encom-pass a certain amount of variety but not too large to permit a detailed study including all its households.” They also required wheat to be a major crop in the village, and for the village to be accessible from Delhi but not too close to ensure independence from its economy. They hoped that tenancy would be common since “that subject was one of their main interests.” They also required independent living arrangements for the team of four researchers.
The data contain a huge amount of qualitative and quantitative data. Enumerators spent an enormous amount of time in the village conducting the surveys. The surveys were conducted as censuses of the village. There is detailed information on demograph-ics, land ownership, cultivation, land rental, outstanding loans, occupation, labour tracts in which village residents are engaged, wage rates, income, nutrition and con-sumption. Plus a number of the enumerators kept detailed diaries which are full of qualitative data.
of 889,810.9Not every train stops at the station, but many do - enough to allow villagers
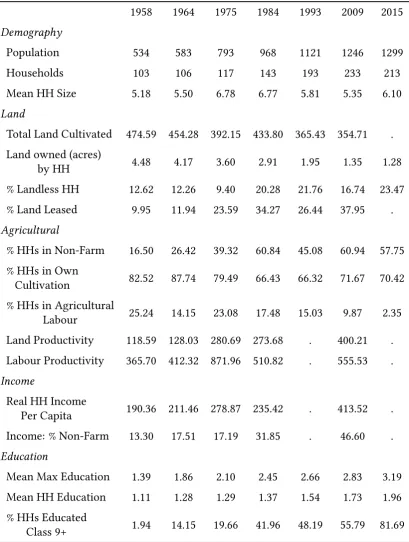
the possibility to commute daily to Chandausi or Moradabad. Chandausi contains the market at which most of Palanpur’s produce is sold. When it was first surveyed Palan-pur was a village of 534 people and has grown to one with a population of 1,299 by 2015. The longevity of the data means that we observe in some instances four generations of the same family. The details of this population growth by survey, as well as the corres-ponding growth in the number of households is shown in Table 1.1.10 Also included in
Table 1.1 are details on the evolution over the course of the survey period of variables relating to land holdings and usage, agriculture in the village, income and educational attainment.
Noticeable in Table 1.1 is the growing importance of the non-farm sector, both as a source of employment and income. In this thesis we define the non-farm sector fol-lowing Lanjouw and Lanjouw (2001). Thus the non-farm ‘sector’ includes all economic activities except agriculture, livestock, fishing and hunting. Agricultural production re-mains important in Palanpur throughout the 60 year survey period (in 2015 more than 70% of village households are still engaged in farming their own land), although the av-erage area of land cultivated by village households has fallen considerably, as well as the total area of land cultivated by village households. The average number of acres of land owned by households is less than 30% of its original 1958 amount. All these landholdings
9Government of India (2011) -
http://www.censusindia.gov.in/2011-prov-results/paper2/data_files/India2/Table_2_PR_Cities_1Lakh_and_Above.pdf
10In most of the Palanpur work to date the village has 528 people in the 1958 survey spread among 100
lie within 3km of the village.
Table 1.1 also demonstrates the growing importance of a market for land. This despite leasing land being illegal (at least during some of the period) and illegally leased-out land being liable to confiscation. Individuals are still happy to be landlords and to talk about it freely, Bliss and Stern (1982):p.24. Previous examinations of Palanpur have shown that most tenancy in Palanpur takes the form of sharecropping, and also that households are happy to lease “down caste ladder”, Bliss and Stern (1982):p.25. That is from high caste households to lower or scheduled caste households, but not the other way round. Leasing of land also takes place within caste. For a more detailed discussion of Caste in Palanpur see Chapter 3, Section 3.3.
The unique elements of the Palanpur data, aside from it’s longevity, are that the data are collected as a census of the village, and it is possible to track how each household or individual are related to each other, if at all. The data is taken as a series of snapshots of the village over 60 years and there is no systematic attempt to create a timeline of events which would enable the creation of a yearly panel from this data, since that was not the purpose of the original studies.
the number of unique individuals in what we refer to as the migration sample is 2,831. Despite being much poorer than India on average11, the development experience of
Palanpur over the last 60 years has been remarkably similar to that of India as a whole. Village average real incomes per capita have increased at an annualised growth rate above 1.5% per year from 1958 to 2009. Despite having a population in 2009 almost 1 million times smaller than India, in Chapter 2 we show that both India and Palanpur are consistent with the stylised facts of structural transformation described by the literature across countries12. That is, Palanpur has experienced large reallocations of resources
away from agriculture into other sectors. Table 1.1 shows this at the household level in the large increase in households who are engaged in non-farm activities, together with the increase in the percentage of income which comes from non-farm sources. Chapter 2 shows that this is also true for employment shares, in 1958 56.6% of males are employed in agriculture as their primary occupation, by 2015 this is 17.3%. Together with, and necessary for, this sectoral reallocation has been increasing agricultural productivity. Table 1.1 illustrates this increase in productivity in terms of real output values, but it is also true in yield terms. Cereal yields in kilograms per hectare increased from 559 in 1958 to 2,958 in 2009.
11The average income in the village in 2009 is below the Indian average GDP per capita of the early 1960s. 12See Herrendorf et al. (2014); Buera and Kaboski (2012b); Buera and Kaboski (2012a) for these stylised
Table 1.1.: Village Descriptives
1958 1964 1975 1984 1993 2009 2015
Demography
Population 534 583 793 968 1121 1246 1299
Households 103 106 117 143 193 233 213
Mean HH Size 5.18 5.50 6.78 6.77 5.81 5.35 6.10
Land
Total Land Cultivated 474.59 454.28 392.15 433.80 365.43 354.71 . Land owned (acres)
by HH 4.48 4.17 3.60 2.91 1.95 1.35 1.28
% Landless HH 12.62 12.26 9.40 20.28 21.76 16.74 23.47
% Land Leased 9.95 11.94 23.59 34.27 26.44 37.95 .
Agricultural
% HHs in Non-Farm 16.50 26.42 39.32 60.84 45.08 60.94 57.75 % HHs in Own
Cultivation 82.52 87.74 79.49 66.43 66.32 71.67 70.42
% HHs in Agricultural
Labour 25.24 14.15 23.08 17.48 15.03 9.87 2.35
Land Productivity 118.59 128.03 280.69 273.68 . 400.21 . Labour Productivity 365.70 412.32 871.96 510.82 . 555.53 .
Income
Real HH Income
Per Capita 190.36 211.46 278.87 235.42 . 413.52 .
Income: % Non-Farm 13.30 17.51 17.19 31.85 . 46.60 .
Education
Mean Max Education 1.39 1.86 2.10 2.45 2.66 2.83 3.19
Mean HH Education 1.11 1.28 1.29 1.37 1.54 1.73 1.96
% HHs Educated
Class 9+ 1.94 14.15 19.66 41.96 48.19 55.79 81.69
1.3. Contributions of the Palanpur Data
We are not the first to use the Palanpur data, and surely not the last. There are many pub-lications which use at least some elements of the data, beginning with Ansari (1964) who reports on the first survey. The most comprehensive accounts of Palanpur are contained in the two books published to date, Bliss and Stern (1982) and Lanjouw and Stern (1998), and there is a third book which is forthcoming.
Bliss and Stern (1982) details the village over the first three surveys, and is focused on the functioning of rural markets and the behaviour of farmers. The great contribution of this book, aside from beginning the creation of such a long run dataset, was to increase the understanding of sharecropping contracts as a response to imperfect or missing input markets. While Lanjouw and Stern (1998) focus primarily on what they describe as the three main drivers of change in Palanpur - population growth, technological change in agriculture, and increased employment opportunities outside the village - using surveys up to and including 1993. However, they also document changes in poverty, inequality and nutrition, plus the workings of the labour, tenancy and credit markets within the village. The book contains more than we could possibly summarise here. The forthcom-ing third book will extend this description of the village and its changes into the 21st
century.
In addition to these books, Palanpur has spawned a number of journal articles con-cerning different aspects of rural life. Bliss and Stern (1978a) and Bliss and Stern (1978b) made important contributions to early nutrition-based efficiency wage theory and evid-ence.
not complete or efficient, and that knowledge about the relative farming skill of farmers is common information in the village.
Other papers have examined the experience of agricultural labourers within Palan-pur. Baland et al. (1999) use Palanpur data to explain the coexistence of daily-wage and piece-rate contracts in agriculture. Their key finding is that the most able and least able labourers work on piece rates, as they can choose their own level of effort. Mukherjee and Ray (1991) use Palanpur 1984 survey data to test the implications of their model of wage bargaining of agricultural labourers in the presence of seasonality.
Sharma and Drèze (1996) present a case study based on the census of tenancy contracts collected as part of the 1984 survey. They make a contribution to the understanding of sharecropping as the predominant tenancy arrangements in rural India.
Himanshu et al. (2013) and Himanshu, Joshi et al. (2016) document the increasing di-versification of household incomes associated with non-farm employment. They show that this increase in non-farm employment has been accompanied by increasing inequal-ity and mobilinequal-ity, as well as falling poverty rates.
Relatedly there have also been contributions to the study of inequality from the Pa-lanpur data. Lanjouw and Rao (2011) highlight the flaws in standard between group inequality measurement using caste groups in Palanpur. They show that caste is an im-portant determinant of inequality within the village, and this inequality does not seem to be driven by education or land endowment differences across castes.
Coppoletta (2011)), and Nutrition (Sinha (2011)).
The Palanpur data also contribute three chapters to Himanshu, Jha et al. (2016) which endeavours to document the history and results of village studies in India, beginning with the “Slater villages” in Tamil Nadu in 1916.
1.4. Employment in Palanpur
Historically the villagers of Palanpur, like any other village in rural India, relied on sub-sistence agriculture for their livelihood. However, as we have seen in the previous sec-tion, the importance of non-agricultural sources of income has been growing.
The change in occupational structure in Palanpur has mainly come through an in-crease in the opportunities outside the village. The percentage of males of 18 or over working outside the village increased from 6.2% in 1958 to 35.9% in 2015. While the per-centage of males of 18 or over working in non-agricultural pursuits within the village has increased from 11.1% to 21.9%. Many of the jobs outside the village have emerged in lar-ger villages or the towns of Moradabad and Chandausi, 31kms and 14kms away respect-ively. These jobs have developed as the towns have increased in size. Moradabad, the district capital, was just over 200,000 people in 197513, approximately 444,000 people in
the 1991 census, and had grown to almost 900,000 people in the 2011 census. Chandausi, while smaller than Moradabad, has also grown significantly during the last 60 years14.
It is also the primary market for agricultural products from Palanpur. Both Moradabad and Chandausi are on the train line which runs through Palanpur. As of 2017 there are 5 trains a day to Moradabad and 4 trains a day to Chandausi from Palanpur. The journey
13Bliss and Stern (1982)
14Chandausi population: 83000, 1991: 103,757, 2001: 114,383, 2011 from Census data. Estimated 1961
times are between 30 mins (to Chandausi) and 1 hour and 10 mins (to Moradabad). Thus, they allow for members of Palanpur to commute to either of these towns. Himanshu, Joshi et al. (2016) discuss the effect of this employment outside Palanpur on others in the village “A common perception among the villagers was that employment outside of Palanpur was definitely more remunerative than in Palanpur, as the living standards of these families had improved. This also served as a source of inspiration for many oth-ers who wanted to go out of the village in search of employment.” This impression is supported by the available wage data. For example, in 2009 an individual working in agricultural labour within the village would earn Rs. 100 per day for their labour, while work in the Moradabad railway yard would earn them, on average, Rs. 200 per day. This is not a skilled form of employment, but is a popular form of casual labour undertaken by village residents.
is not clear, although one obvious candidate is changing migration rates for those who are more likely to become regular workers.
The type and location of employment of Palanpur residents are not independent. In fact, 71.3% of all regular jobs done by an adult Palanpur resident in any survey are outside the village.
1.5. Education in Palanpur
Education in Palanpur, much like education across the whole of India, has risen substan-tially throughout the survey period. India’s primary completion rate was 98% in 2014, up from 40% in 197115. For Palanpur it is not possible to generate comparable numbers
since we do not have enrolment, only self-reported schooling. We can calculate the per-centage of Palanpur residents aged between 12 and 18 who are educated to class 6 or above (primary ends after class 5). This increases from 25.8% in 1958 to 45.8% in 2015. There has been much discussion about whether this increase in enrolment rates across India has led to real increases in educational attainment, see Bosworth et al. (2006) for example. The same concerns are held anecdotally within Palanpur. In all the following we abstract from educational quality and focus only on education completed. We will however focus primarily at the high end of educational achievement and create an in-dicator variable, since the distinction between 5 and 7 years of schooling, for example, is not likely to be important in this context.
Measures of education are self-reported school years in the Palanpur data, and to allow for comparability across all surveys these data are collapsed into bins of education level - illiterate, class 1 to 5, class 6 to 8, class 9 to 12, class 12 or above. For those individuals
Table 1.2.: Male Education in Palanpur by Year
1958 1964 1975 1984 1993 2009 2015
% Illiterate 80.00 73.10 70.34 62.63 50.97 29.70 21.65 % Class 1 to 5 12.78 12.69 11.44 6.40 8.08 23.10 24.33 % Class 6 to 8 3.89 7.11 8.05 12.79 15.88 19.04 18.97 % Class 9 to 12 1.11 6.09 6.36 16.16 20.89 23.10 25.00
% > Class 12 0.00 1.02 3.39 2.02 1.95 5.08 8.26
% Missing Education 2.22 0.00 0.42 0.00 2.23 0.00 1.79
Individuals 180 197 236 297 359 394 448
Note: Percentage of males over 14 years of age by education level and survey.
Only those present in Palanpur are included.
Source: Author’s Calculations
who appear as 14 or older in at least one survey, 16.2% of them are educated to class 9 or above. This overall number hides important differences between the educational attainment by sex. Males who appear in at least one survey when older than 14 are over 5 times more likely to be educated to class 9 than equivalent females, 27.5% and 5.4% respectively. A more detailed look at the education of Palanpur is contained in Table 1.2 for males, and Table 1.3 for females. These tables both show strong increasing trends in literacy16.
There is a complication when considering the educational attainment of the females in Palanpur. Due to the process of patrilocal exogamy, and early marriages in this part of India, many girls born in Palanpur disappear from the education sample before they have their final education enumerated. For example, someone who appears as an 8 year old in the 1975 survey and gets married at 16, moving to their new husband’s village, will
not appear in the 1984 survey. So we would not capture her final education level. Thus, many of the women we sample are those educated in other villages or towns who move in when they marry a Palanpur male. While the level of education of these women and the nature of assortative matching are interesting questions in themselves, they are not the ones we focus on in this thesis. As such, we will mostly be restricting our samples to males in what follows.
A complication remains when we are considering male educational attainment, that is of migration. If migration is selective and migration patterns change over time then we are not capturing the true trends in education for those born in Palanpur, but for those living in the village. We discuss the nature of migration in Palanpur in the following section.
Table 1.3.: Female Education in Palanpur by Year
1958 1964 1975 1984 1993 2009 2015
% Illiterate 96.18 98.84 93.36 93.23 87.96 75.70 59.95
% Class 1 to 5 1.27 0.58 3.79 3.01 2.16 11.25 16.35
% Class 6 to 8 0.00 0.00 1.42 1.50 5.25 7.93 8.53
% Class 9 to 12 0.00 0.58 0.00 2.26 2.78 3.84 4.27
% > Class 12 0.00 0.00 0.00 0.00 0.62 1.02 1.66
% Missing Education 2.55 0.00 1.42 0.00 1.23 0.26 9.24
Individuals 157 173 211 266 324 391 422
Note: Percentage of females over 14 years of age by education level and survey.
Only those present in Palanpur are included.
1.6. Migration in Palanpur
As in all rural development settings, migration is a key feature of Palanpur society. 32.7% of adult males have migrated out of Palanpur in at least one survey. Foster and Rosenz-weig (2008) find 21.2% of males aged between 10-24 in 1982 migrate out of their village between 1982 and 2002 in Bangladesh17. Using the NCAER REDS survey for India they
find 23.7% of males aged between 10-24 in 1982 migrate out of their village by 1999. Table 1.4 shows the results of the same calculations when performed on the Palanpur data. We find that for periods roughly similar to the 17-20 year periods looked at by Foster and Rosenzweig (2008) the migration percentage for males in Palanpur ranges from 14.7% to 32.2%, with a clearly increasing trend.
Table 1.4.: Percentage of Out-Migrants
1958-1975 1964-1984 1975-1993 1993-2009
Male 14.67 17.39 22.76 32.22
Female 51.72 51.61 55.91 72.07
Note: Includes individuals present in Palanpur who are aged
10-24 in the earlier of the two surveys examined, who have left Palanpur by the later survey.
Source: Author’s Calculations
Table 1.4 also shows the same calculations done for females aged between 10-24 in Palanpur between the same surveys. These range between 51.6% and 72.1%, percentages which are also in line with those from Foster and Rosenzweig (2008). They find that 56.3% of equivalent females in Bangladesh migrate out of their villages, while in India it was 86.9%. These numbers are unsurprisingly higher than for males due to the practice of patrilocal exogamy - females move to the village of their husband when they get married.
However, the percentage of females leaving the village appears to have increased in more recent years. This may be because females are now not just migrating for marriage but also for employment or educational opportunities, or it may be that there is an increase in the number of households who are migrating out of the village en masse and this
includes females who previously would have remained in the village. Table 1.5 shows the number of households which migrate out of Palanpur as a collective between surveys. This appears to indicate that it is this increased propensity for households to migrate out between 1993 and 2009 which has led to the sharp increase in female migration seen between 1975-1993 and 1993-2009 in Table 1.4. No doubt this increased propensity for collective household migration also explains some of the increase in the male migration rates between these two surveys. However, it is impossible for us to disentangle these increases into individual and collective migration since we do not have information on the migration destinations of all individuals.
Table 1.5.: Households Migrating Out
1958-1964 1964-1975 1975-1984 1984-1993 1993-2009 2009-2015
Households 8 14 6 13 39 21
Individuals 21 52 18 78 204 122
Note: Households: Unique households which migrate out of the village as a whole.
In-dividuals: Number of unique individuals within these migrating households.
Source: Author’s Calculations
of these individuals during a later survey. As shown above there is an increasing trend in educational attainment irrespective of migration status. However, this increasing trend seems to be much stronger for migrants than non-migrants. The result of this is that despite non-migrants having higher educational attainment in earlier surveys, by the most recent surveys it is migrants who have marginally higher education levels. This is interesting as it suggests the nature of migration out of the village may be changing during the study period. However, these results should be interpreted with caution since Wilcoxon and Fisher exact tests fail to reject a difference in the means and medians of these two groups for each pair of surveys considered.
Table 1.6.: Education by Migration Status
1958-1975 1964-1984 1975-1993 1993-2009
Migrants 1.13 1.33 2.50 2.67
Non-migrants 1.93 2.20 2.47 2.56
Note: Includes males present in Palanpur who are aged 15-24 in
the earlier of the two surveys examined. Migrants are those who have left by the later survey, non-migrants are those who are still present in the village. Education is measured in years completed, collapsed into 5 categories (Illiterate, Class 1-5, Class 6-8, Class 9-12, Above Class 12). These categories are given numerical values in order of attainment (e.g. Illiterate is 1). The table reports mean education by migration status.
Source: Author’s Calculations
1.7. Summary
post-colonial democracy to the rapidly expanding service-led economy of the present day.
This chapter has demonstrated how Palanpur has evolved through this process, and how it is not a peculiar village in any obvious way. We have shown that the changes in employment, education and migration patterns are broadly consistent with data from other sources for India. With this in mind we now progress to using these data to tackle two questions of central importance to our understanding of economic development which can only be answered with data of this length and detail.
Chapter 2 examines the process of structural transformation within Palanpur, how this compares to sectoral reallocation as documented in the literature at a national level, and what this can tell us about structural transformation in development more generally. In chapter 3 we explore the importance of networks within the village labour market in light of this movement away from agriculture, and the long run effects of these networks for their members.
References from Chapter 1
Ansari, N., 1964. Palanpur: a study of its economic resources and economic activities.
Continuous Village Survey, (41).
Baland, J.-M., Drèze, J. and Leruth, L., 1999. Daily wages and piece rates in agrarian economies.Journal of Development Economics, 59(2), pp.445–461.
Bliss, C.J. and Stern, N.H., 1982.Palanpur: the economy of an indian village. Oxford
Uni-versity Press.
Bliss, C. and Stern, N., 1978b. Productivity, wages and nutrition: part ii: some observa-tions.Journal of Development Economics, 5(4), pp.363–398.
Bosworth, B., Collins, S.M. and Virmani, A., 2006. Sources of Growth in the Indian Eco-nomy.India Policy Forum, 3(1), pp.1–69.
Buera, F.J. and Kaboski, J.P., 2012a. Scale and the origins of structural change.Journal of Economic Theory, 147(2). Issue in honor of David Cass, pp.684–712.
Buera, F.J. and Kaboski, J.P., May 2012b. The rise of the service economy.American Eco-nomic Review, 102(6), pp.2540–69.
Feenstra, R.C., Inklaar, R. and Timmer, M.P., October 2015. The next generation of the penn world table.American Economic Review, 105(10), pp.3150–82.
Foster, A.D. and Rosenzweig, M.R., 2002. Household division and rural economic growth. English.The Review of Economic Studies, 69(4), pp. 839-869.
Foster, A.D. and Rosenzweig, M.R., 2004. Agricultural productivity growth, rural eco-nomic diversity, and ecoeco-nomic reforms: india 1970-2000. English.Economic Develop-ment and Cultural Change, 52(3), pp. 509-542.
Foster, A.D. and Rosenzweig, M.R., 2008. Chapter 47 economic development and the de-cline of agricultural employment. In: Schultz, T.P. and Strauss, J.A. eds. Vol. 4, Hand-book of Development Economics. Elsevier, pp.3051–3083.
Government of India, 2011.Census of india 2011.
Herrendorf, B., Rogerson, R. and Valentinyi, Á., 2014. Chapter 6 - growth and structural transformation. In: Aghion, P. and Durlauf, S.N. eds. Handbook of economic growth.
Himanshu, Bakshi, I. and Dufour, C., 2011a.Poverty, inequality and mobility in palanpur: observations from palanpur. LSE Asia Research Centre, (Working Paper 45).
Himanshu, Jha, P. and Rodgers, G., eds., 2016.The changing village in india: insights from longitudinal research. eng. First edition. Oxford University Press. isbn: 9780199461868.
Himanshu, Joshi, B. and Lanjouw, P., June 2016. Non-farm diversification, inequality and mobility in palanpur.Economic and Political Weekly, 51(26-27), pp.43–51.
Himanshu, Lanjouw, P., Mukhopadhyay, A. and Murgai, R., 2011.Non-farm diversifica-tion and rural poverty decline: a perspective from indian sample survey and village study data. LSE Asia Research Centre, (Working Paper 44).
Himanshu, Lanjouw, P., Murgai, R. and Stern, N., September 2013. Nonfarm diversifica-tion, poverty, economic mobility, and income inequality: a case study in village india.
Agricultural Economics, 44(4-5), pp.461–473.
Himanshu and Tyagi, A., 2011a.Change and continuity: agriculture in palanpur. LSE Asia
Research Centre, (Working Paper 48).
Himanshu and Tyagi, A., 2011b.Tenancy in palanpur. LSE Asia Research Centre,
(Work-ing Paper 47).
Kattumuri, R. and Tiwari, D.K., 2011.Developments in education in palanpur, a village in uttar pradesh. LSE Asia Research Centre, (Working Paper 49).
Lanjouw, J.O., 1999. Information and the operation of markets: tests based on a general equilibrium model of land leasing in india.Journal of Development Economics, 60(2),
pp.497–527.
Lanjouw, P. and Rao, V., 2011. Revisiting between-group inequality measurement: an application to the dynamics of caste inequality in two indian villages.World Develop-ment, 39(2). Ethnicity and Ethnic Strife, pp.174–187.
Lanjouw, P. and Stern, N., June 1998.Economic Development in Palanpur over Five Dec-ades, OUP Catalogue 9780198288329. Oxford University Press.
Mukherjee, A. and Ray, D., 1991. Wages and involuntary unemployment in the slack season of a village economy.Journal of Development Economics, 37(1), pp.227–264.
Sharma, N. and Drèze, J., 1996. Sharecropping in a north indian village.The Journal of Development Studies, 33(1), pp.1–39.
Sinha, D., 2011.Nutrition status in palanpur. LSE Asia Research Centre, (Working Paper
51).
Sinha, D. and Coppoletta, R., 2011.The invisible half - women’s status in palanpur. LSE
Asia Research Centre, (Working Paper 50).
Appendix to Chapter 1
A.1. Variable Definitions
Table A.1.: Variable Definitions
Variable Definition
Population Individuals who are living in the village during the survey
Households Households with any members living in the village during thesurvey
Total Land Cultivated Land cultivated, in acres, by households who are present inthe village during the respective survey
Land owned (acres)
by HH Land owned, in acres, by households who are present in thevillage % Landless HHs Percentage of households which own no land
% Land Leased percentage of total land cultivated by village residentsLand leased in by households present in the village as
% HHs in Non-Farm present in the village who works in a primary or secondaryPercentage of households which have at least one member occupation which is in the non-farm sector
% HHs in Own Cultivation
Percentage of households which have at least one member present in the village who cultivates land owned or leased
by the household % HHs in Agricultural
Labour Percentage of households which have at least one memberpresent in the village who works for a wage in agriculture
Land Productivity Real value of agricultural output (in 1960 Rupees) per acreof land cultivated
Labour Productivity Real value of agricultural output (in 1960 Rupees) peragricultural worker (cultivator or labourer)
Real HH Income Per
Capita Real household income per household member present in thevillage Income: % Non-Farm Percentage of household income from non-farm sources
Mean Max Education Maximum level of education achieved by any individual presentin HH averaged across all households present in year
Mean HH Education Mean level of education within HH, averaged across allhouseholds present in year
% HHs Educated Class 9+ have at least one member who is educated at or above class 9The percentage of households present in the village which
Education
Education is coded as 1-5. 1: Illiterate, 2: Able to read/write OR education between class 1 and 5, 3: Education
between class 6 and 8, 4: Education between class 9 and 12, 5: Education beyond class 12
The Fractal Nature of Structural Transformation
2.1. Introduction
Structural transformation is one of the most widely studied phenomena in the history of Economics as an academic discipline. From the seminal contributions of Lewis (1954), the observations of Kuznets (1973), through to modern contributions such as Duarte and Restuccia (2010) - there innumerable papers concerning structural transformation in the macroeconomic literature. Equally many observers have noted the increasing importance of the non-agricultural sector in rural areas of developing countries, see Lanjouw and Lanjouw (2001) for a cross-country review. However, to our knowledge, no attempt has been made to reconcile these macro and micro findings explicitly, and the microeconomic foundations of the transition from an agricultural economy to an industrial economy are not especially well understood. Thus, in this chapter we ask how similar the experience of structural transformation is at different geographical and population levels. Does a country experience structural transformation in the same way as a village, a district or a state?
remain resident in a rural area.
In this thesis we define structural transformation as the reallocation of economic activ-ity across agriculture, manufacturing and services. This structural transformation is characterised by Kuznets (1973) as “Major aspects of structural change include the shift away from agriculture to non-agricultural pursuits and, recently, away from industry to services; a change in the scale of productive units, and a related shift from personal enterprise to impersonal organization of economic firms, with a corresponding change in the occupational status of labor.” We examine these features of structural transform-ation, in light of more recent cross-country work by Herrendorf et al. (2014); Buera and Kaboski (2012b); Buera and Kaboski (2012a), for the village of Palanpur, the district of Moradabad, the state of Uttar Pradesh and the country of India. We follow the macroe-conomic literature on structural transformation by using manufacturing to refer to the sector of the economy which does not include agriculture or services.1
The focus of our study is India. Structural transformation in India has been docu-mented by Bosworth et al. (2006) and Verma (2012), among others, who use a growth accounting framework to examine the contribution of broad sectors to overall growth in India GDP from 1960-2004. Their findings are consistent with the description of struc-tural transformation by Kuznets above. They emphasise the service led growth of India from 1980 onwards, but Bosworth et al. (2006) argue that the role of services in the In-dian growth experience is overstated. Bosworth and Collins (2008) compare the growth experience of India to that of China.
However, even if we know that at the country level there is a sectoral shift away from agriculture it does not necessarily follow that we will see comparable reallocations at all
1Strictly speaking it is probably more proper to refer to this sector as industry (as do the World
levels of the economy. If agricultural and non-agricultural development are substitutes then it may be that smaller geographic areas specialise in the sector in which they have comparative advantage. We would then expect to see differential patterns in structural transformation for different snapshots of the economy. Foster and Rosenzweig (2004); Foster and Rosenzweig (2008) use a sample of households in villages in rural India who are surveyed three times in a 28 year period to explore the relationship between growth in agricultural technology and the non-farm sector. They find large increases in income from the non-farm sector in their villages, and that these increases are largest where ag-ricultural productivity growth is smallest. This is consistent with the finding from Bustos et al. (2016) who show that the adoption of a land-augmenting technology in Brazil led to a reduction in the industrial sector, while in contrast the adoption of labour-saving agricultural technology led to growth in the industrial sector. Thus, if it is agricultural productivity growth which is the driving force behind this sectoral reallocation then the spatial distribution of sectors, and therefore the congruence of sub-samples of this changing economy, will depend on the factor-bias of the technical change2.
Our examination of structural transformation at the village level uses data from Pa-lanpur. The Palanpur data are uniquely suited to this purpose as they cover an extremely long time period, from 1957 to 2015. These 60 years span a period of rapid change and development within India. The other feature of the Palanpur data which allows us to explore structural transformation at the village level is that it was undertaken as a full census of the village. Usual panel data, particularly in rural areas of developing coun-tries, face the dual challenges of (selective) attrition and household division. Most survey designs do not retain in their sample any or some sub-divisions of households which do
2See Gollin et al. (2002) andGollin et al. (2007) for models in which agricultural productivity growth is
not remain intact between survey rounds. These household divisions are not uncommon: in the ARIS-REDS panel data 30% of the original sample farm households had divided by the time of resampling 12 years later3. In the Palanpur data 64% of the original survey
households have split at least once. Foster and Rosenzweig (2002) show using the ARIS-REDS panel data for a representative sample of rural India that this household division is non-random. It depends, for example, on land holdings, within household inequality in schooling, and marriages. Thus if one examines the nature of structural transformation using a typical survey which samples households within villages then this non-random nature of division, and therefore attrition, will lead to biased estimates of the relative sizes of sectors. The Palanpur data avoid this problem because all household splits are sampled in subsequent surveys as long as they remain in the village. Due to the nature of the survey we observe who migrates out of the village but do not observe their out-comes. However, this is the same as when we examine sectoral distributions at any level of aggregation - those who emigrate from India are no longer captured in the data for sectoral allocations at the country level. It is also true of most household surveys in developing countries which do not specifically focus on migration.
We combine our data on Palanpur with sector level data for Moradabad district, Uttar Pradesh and India. Armed with these data we compare the nature of structural trans-formation for each of these geographic areas with the stylised facts documented for cross-country data by Herrendorf et al. (2014).
We show that where the data are available these stylised facts hold true at all levels. The share of total employment which is agricultural has declined for India, Uttar Pra-desh, Moradabad district and Palanpur. Agricultural productivity has increased. Income
3The Additional Rural Incomes Survey and Rural Economic and Demographic Survey conducted by
per capita has risen. Economic activity has relocated from agriculture into both man-ufacturing and service sectors within Palanpur. For low levels of development this in-crease in the growth of manufacturing is faster than for services, and the employment share of services is bounded away from zero - both of these features are found in the cross-country data. We also find that the ratio of the manufacturing and service sectors evolves in a way which is strikingly similar to the cross-country averages as described in Buera and Kaboski (2012a). The manufacturing sector initially grows faster than the service sector, but the continuing expansion of the service sector eventually reduces the ratio - resulting in a hump-shape. The novel observation that this occurs even within a village economy seems to run counter to the prevailing perception in the literature which focuses on services as the principal component of non-farm employment in rural areas.
The results of this chapter are consistent with the agricultural technological change experienced by India, and its component parts, via the Green Revolution being labour-saving. Our findings also suggest that agricultural and non-agricultural development are complements. This complementarity is in contrast to the results of Foster and Rosenz-weig (2004); Foster and RosenzRosenz-weig (2008) who find that agricultural and non-agricultural growth are substitutes. This complementarity means that development policies aimed at increasing agricultural productivity aid non-agricultural development which is im-portant because non-agriculture is the more productive sector. This suggests that the large amounts of money spent on agricultural technological innovations and higher pro-ductivity crops have improved the incomes of many of the world’s rural poor. However, our focus is a single village and we must learn how widespread the features of local development documented here are before we can draw strong policy conclusions.
microe-conomic studies of the process of development, such as those reviewed in Foster and Rosenzweig (2008), and the vast macroeconomic and theoretical literatures which build upon the models of those such as Matsuyama (1992) to examine the nature of develop-ment at the national level. To our knowledge this is the first explicit examination of the nature of structural transformation at the level of a single village. The unique nature of the Palanpur data enables us to conduct this exercise.
We believe this chapter contributes to a nascent literature on the spatial dimension of the exit of rural workers from agriculture. Our description of India through the devel-opment experience suggests that there exist rural areas of developing countries where it is not a relocation of from rural to urban environments, but rather a reallocation of sectoral activity within rural areas. This illustrates the important distinction between urbanisation and structural transformation. While the two are clearly related concepts (Michaels et al. (2012)), and urbanisation may be the consequence of structural trans-formation if there are agglomeration externalities, they are distinct economic phenom-ena. In a context such as this it is therefore not necessary for there to be rural-urban migration together with reduced agricultural activity. It appears that the existence of ad-equate transport infrastructure and sufficiently local manufacturing or services allows development of the non-agricultural sector without large migrant flows. This is consist-ent with the large rural-urban wage gap and low mobility which are a feature of India, Chauvin et al. (2017); Munshi and Rosenzweig (2016).
Related to this is another strand of the literature which considers transport costs, in-frastructure and development. Gollin and Rogerson (2014) calibrate a model to answer policy questions about the impact of transport costs on structural transformation.4Their
4They model location and occupation type as perfect complements, and thus don’t distinguish
model suggests that the extent of structural transformation is driven by improvements in agricultural productivity and transportation productivity, and these productivity im-provements are complementary.5While there have been improvements in the
transport-ation infrastructure around Palanpur during the study period, mostly through improved road quality in surrounding areas, it has always had access to the railway network. This relatively good transportation infrastructure, and corresponding relatively low transport costs, may be an important explanatory factor in Palanpur’s structural transformation experience in the face of increasing agricultural productivity. If there were more compar-able data to the Palanpur data it would be interesting to see whether this fractal nature of structural transformation holds in all settings, or if there is heterogeneity by village transportation infrastructure (or travel time to nearest urban location). If this feature of fractal structural transformation is common only to those areas with sufficiently good transport infrastructure then this suggests that existing estimates of the impact of trans-port infrastructure (e.g. Donaldson (2018); Michaels (2008)) may be underestimates since they do not include the long run general equilibrium increases in local incomes which come through sectoral reallocation.
This result has implications for development policies. It is suggestive of a policy av-enue to reduce rural poverty through reducing the urban-rural wage gap and overcome the low levels of migration in India compared with other countries of similar levels of de-velopment (Munshi and Rosenzweig (2016)) - increased transport infrastructure allows rural areas to benefit from more productive non-agricultural pursuits in urban centres, while allowing individuals to remain part of their traditional rural social insurance net-works which constrain usual forms of migration.
5Other papers which examine the importance of transport costs in development include Atkin and
The following section describes the stylised facts of structural transformation from the cross-country literature, and the data we use. We then examine how well these styl-ised facts fit the data for India (in section 2.3), Uttar Pradesh (in section 2.4), Moradabad District (in section 2.5), and Palanpur (in section 2.6). Section 2.7 discusses the simil-arities and differences in the development experience of each of the geographic areas. Finally section 2.8 concludes.
2.2. Stylised Facts and Data
It has long been recognised, starting with the seminal work of Lewis (1954), that struc-tural transformation - the reallocation of economic activity across agriculture, manufac-turing and services - is one of the most pervasive elements of economic development. Kuznets (1973) listed it as the third of six main features of modern economic growth. This transition away from agriculture is necessary because individual demand for agricul-tural goods is relatively price and income-inelastic as incomes increase, and because of the presence of land as a fixed factor in agricultural production which limits its capacity for labour. Herrendorf et al. (2014) present the stylised facts of structural transformation using cross-country data from a variety of sources and find that it is characterised by: the share of agriculture in total employment, value added, and final consumption expendit-ure falling with development; the share of services in total employment, value added, and final consumption expenditure rising with development; the share of manufactur-ing in total employment, value added, and final consumption expenditure is n-shaped (or hump-shaped) with development.
the employment share. In the service sector both the employment share and the nominal value added share are bounded away from zero even at very low levels of development; the lowest value added share of services is around 20% and the lowest employment share is around 10%. This is consistent with work by Broadberry et al. (2013) who show that even in 14thcentury Britain the share of male workers in the service sector was just below
20%6.
Equally it is clear that, at the level of the world, agricultural productivity growth is essential for sustained economic development. Increases in agricultural productivity which are labour-saving lead to industrial growth (Bustos et al. (2016)). Additionally, the work of Buera and Kaboski (2012b) shows an acceleration in the rate of relative growth of the service sector in the later stages of the process of structural transformation. Buera and Kaboski (2012b) document this stylised fact for a panel of 31 countries, who use 9,200 in 1990 international dollars as their threshold, based on evidence from the United States. They argue that this acceleration in the share of services at higher incomes appears to be a common feature of structural transformation, and that it is driven by growth in skill-intensive services. This feature is consistent with the findings of Herrendorf et al. (2014), who show that this acceleration in the service sector share tends to coincide with the peak manufacturing share. In their data this threshold occurs at approximately a log GDP per capita of 9 in 1990 international dollars, which is 8,103 in 1990 international dollars.
Buera and Kaboski (2012a) describe a new stylised fact in their panel of countries, that for low levels of GDP per capita the manufacturing sector expands more quickly than does the service sector. They show the average ratio of manufacturing to services share in value added increases from below 0.2 to a peak of approximately 0.75 before declining
again as the manufacturing share declines past the threshold described above.
2.2.1. Data
When trying to examine structural transformation across countries data comparability is one of the primary issues faced. This is no less complicated when trying to document features of this transformation across different geographical areas. Although since we are looking within a country we do not need to focus on accurate purchasing power parity adjusted estimates.
In the structural transformation literature employment shares are typically calculated using hours worked by sector. We cannot employ these measures due to data availability at lower levels of disaggregation. Hence, we focus on workers by sector and abstract from hours worked. This ignores possible changing patterns of hours worked by level of development, and may mean that our employment shares do not exactly match the percentage of labour inputs employed in each sector. This could be an issue if the hours worked in agriculture change differentially by area in consideration. However, we have no reason to believe this is happening within a single country.
Given concerns about the under-representation of female employment in the Palanpur data, and that this under-representation is probably most prevalent in the agricultural sector, we use the percentage of male workers working in agriculture from the total male population when examining employment shares.
work as cultivators or agricultural labourers to generate the total number of workers in the agricultural sector, and population to construct a percentage share. As we use total population and not number of workers as is typical within the literature, the numbers we will find will be lower than one might expect. However, we take advantage of estim-ates of the labour force participation rate to show these numbers are comparable with those in the literature when we inflate them.
We use this same narrow definition of agricultural employment for the Palanpur data. We count only those who are employed in cultivating their own land, or who work as agricultural labourers. There exist at all levels a number of services, many of which relate to agriculture. One example of this type of service within Palanpur is tractor rental. So while the labour of the tractor owner is engaged in the supporting the agricultural sector and increasing its productivity, it is not counted in the figures for agricultural employment. However, in constructing our employment data in this way we allow for direct comparability across all levels of observation.
Within the cross-country literature both production and consumption measures of sectoral shares are used, value added shares and final consumption expenditure shares respectively7. The decision for us over which measure to use is made easy, since there
are no data on final consumption expenditure shares for any of our levels of interest. Therefore, we use production measures of sectoral shares in what follows. Data on In-dian sectoral shares of GDP come from the InIn-dian National Accounts produced by the Indian Central Statistical Organisation (CSO) via Reserve Bank of India (2016-17), these are measured at current prices at factor cost.8For Uttar Pradesh we use estimates of state
7Herrendorf et al. (2014) show where these two different measures can give different quantitative results,
particularly for the manufacturing sector.
8See Bosworth et al. (2006) for a detailed description on the construction of India’s GDP and sectoral
domestic product and the percentage of state domestic product by sector from Ozler et al. (1996) for 1961-1993 and data from the CSO from 1994 onwards. There are no GDP or income estimates available at the district level for Moradabad. At the village level the Palanpur survey measures income in 5 of the 7 surveys. Therefore we use percentage of income from cultivation as a measure of the relative size of the agricultural sector.
Agricultural yield data for India for 1961-2014 come from the World Bank (Various years) World Development Indicators9. Detailed information on crop yields in Palanpur
are collected in the 1958, 1963, 1975, 1984 and 2009 surveys. For comparability with other data sources we use only the yields and cultivated area from the farming of wheat, Bajra (pearl millet) and Paddy - the cereal crops which are grown in the village - to calculate cereal yields in kilograms per hectare. Land productivity measures for cereal for Uttar Pradesh and Moradabad come from ICRISAT (2015), again in kilograms per hectare. These are available from 1966-2011.
One of the stylised facts described in Herrendorf et al. (2014) is the n-shaped trend in the share of manufacturing, both in terms of employment and income shares. Due to data constraints it is hard to examine these manufacturing shares at levels below that of a country. However, we have coded occupations for the Palanpur data as manufacturing or services. Thus we will use these employment shares to consider the existence of this hump-shape in manufacturing. We do not expect a pronounced hump since Palanpur is not yet at the level of development needed to reach the peak of manufacturing employ-ment share, typically over a log GDP per capita of 9 (in 1990 international dollars)10 in
the cross-country data. A comparison of the price level between countries and villages is inherently difficult and unreliable. Bearing this in mind, log GDP per capita of 9 is
8,103 in 1990 international dollars, while the village average income in 2009 (the highest observed) is approximately 688 in 1990 international dollars11, well below the observed
threshold in the data. Thus, we should not see any decline in the manufacturing sector share even if the pattern is consistent with the cross-country data. In fact, in the Mad-dison 2018: Bolt et al. (2018) dataset India has yet to reach this level of GDP per capita by 2016.
2.3. India
We now turn our attention to the development experience of India. Due to the work of Sivasubramoniam (2000) there is long time-series of comparable data on sectoral shares available for India. These data are available for 1900-2000. Combining this with estim-ates of per capita GDP from Maddison (2010) we can see from Figure 2.1 that India’s experience is in many ways typical of a country during the process of development. The value added share of agriculture in current prices is initially above 50% but as Indian per capita income grows this share falls to below half of its 1900 level. This activity moves out of agriculture into both manufacturing and service sectors. However, consistent with the cross-country stylised facts the manufacturing sector expands more quickly than the services sector for low levels of development. For the first 40 years of the sample the an-nualised growth rate of the manufacturing share is around 3%, while that of services is 0.7%. As India has developed this manufacturing sector growth rate has slowed, while the service sector has kept growing. We also observe, consistent with the cross-country evidence, that the service share is strongly bounded away from zero even at the lowest
11Using the World Bank International Comparison Program Database and the CPI for India from the WDI.
Figure 2.1.: Sivasubramoniam (2000) GDP shares against GDP per capita 20 30 40 50 60
Current Value Value-Added Share of Agriculture
6.5 7 7.5 8
Log of GDP per capita (1990 international dollars) Agriculture 0 5 10 15 20 25
Current Value Value-Added Share of Manufacturing
6.5 7 7.5 8
Log of GDP per capita (1990 international dollars) Manufacturing 30 35 40 45 50
Current Value Value-Added Share of Services 6.5Log of GDP per capita (1990 international dollars)7 7.5 8
Services
Indian Structural Transformation
Note: Development Experience of India - 1900-2000
Source: GDP shares: Sivasubramoniam (2000). GDP per capita: Maddison (2010)
levels of development. In fact Broadberry et al. (2015) estimate a non-zero service sector share in 1600.
2009 Rupees). Over this period India has been one of the fastest growing economies in the world. Much has been written about the liberalisation underta