Thesis by
Carol Lee Kornblith
In Partial Fulfillment of the Requirements For the Deeree of
Doctor of Philosophy
California Institute of Technology Pasadena, California
1972
(submitted December 17, 1971)
ACKNCMLEDGMENTS
I am thankful to Dr. James Olds for the laboratory space, equipment, and support he has provided me. In addition, he has
supplied ideas, guided,
and
advised me throughout
mygraduate career.
Most importantly, he has provided the patience and encouragement tosee me through this research.
The members of my committee; Dr. R. Owen, Dr. F. Strumwasser, Dr. A. van Harreveld, and Dr.
c.
Wiersma have given me some very helpful ccxnments and suggestions for this research. I would like to thank each of them.I am grateful to the members of Dr. Olds' laboratory - the people of the former Brain Research Laboratory at the University of Michigan and the present members of the lab at Caltech - for their
technical assistance and advice. In particular, Mary Ann Linseman and Menahem Segal have been sounding boards for my ideas, helped me
through difficult periods, and made very useful suggestions during the preparation of this thesis.· Richard Hirsh, John Disterhoft, and
David Hiatt have provided some very rousing discussions during the course of this research.
ABSTRACT
Unit activity was recorded from the rnidbrain and pons of 40 freely moving rats in an appetitive classical conditioning situ<Jtion. Responses to auditory stimuli were 9bscrved from 100 units before and during a conditioning procedure in Hhich presentation of food occurred
1 sec after the onset of the auditory stimulus. Conditioned unit responses (i.e., spike rate accelerations or deceleretions) were
considered to be positive when 1) no similar responses appeDred prior
to conditioning
,
and 2) latencies were equal to or less than those of sensory responses derived from the inferior colliculus. Such short la.t~ncy conditioned unit responses were recorded from 11 probeslocated in the mid-lateral part of the ventral reeion of the brain
stem. This region was differentiated from paramedian, far lnterel and
dorsal parts of the brain stem reticular formation. Conditioned unit
responses of considerc.bly loni:;or latencies were recorded from
76
probes located in these other regions. .Among the longer latency responses interesting differences appeared in experiments conducted after the first conditioning series was completed. With additionaltrdning, units in the "reticular activating system" of midbrllin and
pons tended to yield stabilized responses in the early portion of the CS-US interval closely related in time to the orientation responses evoked by the CS. In contrast, _the responses of units in the limbic
DurinG extinction when the auditory stimulus was no loneer followed
by presentation of food, many of the responses were reduced to their pre-conditionin[; levels. However, there was u tendency for units Hhich harl. displayed short latency responses on the first conditionine
d<•Y to be more resistant to extinction than units Hhich had displ a::,red lon~er lctency conditioned responses. The data 1·1ere interpreted as
TABLE OF CONTENTS
TITLE PAGE
Acknowledgments ••••••••••••••••••••
...
• •• i iAbstract . . . • . . . • . . . . • . . . • . . i i i Table of Contents . . . v Introduction .... . . • . . . • . . . • . . . 1 Methods • ••••••••••••••••••••••••••••••••••••••••••••••••••••••••••••• 4 Results . . . • • . . . • . . . • • . . . • . . . 18 Discussion ...•...•....•...•..•...•....• 47
References ••••••••••••••••••••••••••••••••••••••••••••••••••••••••••
61
INTRODUCTION
Herrick's classicul study of the brain of the tiger salomMder
(1948)
set the stage for the theory that the reticular neuropil atDll levels bcb1cen sensory und motor mcchMisms conatitutcd the
predecessor of the vertebrute intc~~ative mechanisms. At o.:Ll D nterior-posterior levels it was viewed as containing the basic requirements for decision making and conditioning. Its less organized parts from rnidorain to medulla were seen as beine ancestral to the more complex integrative mechanisms, including the cortex. Through a lengthy period following the discoveries of Magoun and his colleaeues (Hagoun Md P.hines,
1946;
Rhines and Magoun,1946;
Moruzzi and Nagoun,1949)
special relations of the reticular formation to ~rousal tended to generc.te a view of it as a 11\·raking mechanism.11: But even at this timethere survived a belief that the reticular formation was to some degree a small and perhaps primitive brain, but nevertheless a more complete brain than would be suggested by the "wakine mechanismit theory. The work of the Scheibels
(1958)
and of Brodal(1957),
end more recent theorizing of Kilmer, HcCulloch, and Blum(1968)
carriedforward the more total brain concept: a concept which received considerable sustenance from the centrencephalic views of Penfield
(1952).
The problem is that direct evidence from studies at the ml31llr.1.alian level did not of.fer substantial support to the view that decision processes ~nd learning processes occurred in the reticular formation.conditionine; of the arousc.tl reaction. The implication was that local
chanr;es occurred in the reticular forrna.tion. But these studies did
not offer recorclines from the reticular formation to substantiate the
sugccsted source of the change. Studies by John and Killam (1959),
Ellison, et al.
(196
8
),
and earlier·studies from our laboratory (Oldsand Hirano, 1969; Olds, llink and Best, 1969; Phillips and Olds, 1969) all shov1ed changes in the reticular formation. Particularly interest-ing were 11learned responsestt in the reticul<ir formation that appeared
to a stimulus depending on whether it was relevant to the currently
active drive (Phillips and Olds,
1
969
),
and responses in reticularfor;;i~tion that accompanied the unimal1s attentional interest rather
than his motor responses (Ellison, et al.,
1969).
There were alsointcr(~sting units thut were 8ccelerated just prior to the point in
time when the a.nimul anticipated the unconditioned stimulus and
prepared for a consummatory response (Olds, Mink £ind Best, 1969).
The difficulty in these cases was that no aspect of the experiment
certified that the primary changes involved were local; alterations
elsei·rhere could have caused the new response to be projected to the
reticular formation.
With regard to decision making, the findings of Olds
(1962)
and others on self-stimulation and of Glickman and Schiff (1967) and others on changed drive behaviors caused by stimulating in specificparts of the tegmentum suggested' a relationship between stimulation
of fibers in this region and decision processes. At least the
major behavioral directions: and these were the decisions supposed to be made in this area according to the theory of Kilmer, McCulloch and Blum
(1968).
The difficulty in this case was that the stimulation experiments did not clarify the problem of whether these were onlypassing fibers or whether critical aspects of the drive and reward
processes might be local.
The present experiment was designed to ask directly whether local integrative processes concerned with learning take place in the
reticular formation. Learned changes in neuronal processes were studied with a special view to the question of whether they might involve local changes, and if these occurred the further aim was to determine whether they might be delimited in locus to particular
HETH ODS
Subjects and Probes
The subjects were 40 adult, male, albino, Holtzr:ian rats. Probes
for recording units were of fine nichrome wire (62.5p diameter),
factory insulated with ena.171.el, and cut vd.th scissors to form a blunt,
uninsulated tip. Eight or nine of these probes were chronically
implanted under stereotaxic and neurophysiological guidance in each
fu"1in1c-i.l. Probes were aimed at re,gions of the posterior diencephalon
and brain stem extending from
3.5
to9
nun posterior to bregma. Allprobes were approximt:.tely 1 mm lateral to the sagittal suture and
8 nun below the surf ace of the skull. Probes were lowered by
stereo-taxic 1:1ethods to within •
5
nun of the intended area Dnd then slowlyadvl!l'lced until clear, unitary spikes were observed (4 to 1 sit:;nal..to_
noise ratio). The background noise level was about 25 microvolts and
acccptuble unitary spikes were of 100 microvolts or more. In each
wiimul one lori:;e uninsulated wire (25g_µ di<.imeter, 5 rran in lcnGth)
wc..s implanted in the anterior lateral region of the cortex to serve
as an indifferent probe. All probes were fixed in place with acrylic
and brought out to a 10-contact plaque that was similarly fixed to
the skull. At lee.st
J
days were allowed for recovery beforeexperi-ments were begun. During this period and during experiments animals
~·1ere mc.intained on a 24 hr light schedule and on a lir:iited diet so
thc.t 1·reight was kept at 70-80
%
of the preoperative level. Followingof nembutal <ind perfused with physiological saline followed by a 10
%
f ormilin solution. Brains were sectioned at
60_,µ-
and alternl:!.tesections were stained for fibers and cells with Weil and cresyl violet,
respectively. The probes left fairly cleo.r tracks in brain tissues,
and the point of recording could be.determined with relative ease.
In some cases a small marking lesion (10 ~a for 15 sec) was mnde at
the end of the experiment to facilitate locnlization of the tip of the
probe (see Fig. 1). Histology was not available for
5
probes. Thed;.ta from these probes are presented in the result section with that
for probes implanted at the same coordinates and a.re indicated in
Appendix II.
Cages and Stimuli
Experiments were cc::.rried out in a
13
inch diameter circularplastic cage (housed within a larger, sound-attenuating enclosure).
Penetrating through the center of the top of the cage ws.s an 11-wire
cable which was fixed to the animal 1 s plaque at the lower end f.nd to
a corrur.uta.tor und counterbalonced arm at the upper end. Ten of the
wires were of low noise cable (Microdot) and were connected to the
brain probes. The llth wire was a length of noisy 11hebring a:i..dn-lead
which wus open circuited at the lower end. Minimal movements by the
animal caused relatively large voltages to be generated in this lead
and its amplified signal served as an indicator of the animal's
movement, thus providing a measuring system for the behavioral response
C) D)
Fig.1 Histological material indicating probe locations in Al zona incerta, probe 8614-7; ·
Bl medial lemniscus, probe 8492-6; Cl pontine tegmental nucleus, probe 8733-5;
Dl ventrolateral pontine reticular formation, probe 8216-6. Bl and Dl have small marking lesions. The code numbers identify the probes for comparison with Table 1.
omplifier id.th frequency range of 500-2000 Hertz and then into s Schmitt
trigger. The trieger rCJ.te was then used as the measure of behavior.
The experimental cage wus equipped with a. loudspeaker for
presentation of a tone CS, n mechanical pellet dispenser to deliver
u food pellet US, und a continuously available water bottle. The
pellet dispenser disch~rged with a loud auditory signal and dropped
pellets into a locc..lized part of u food chute. Animals were hungry
prior to experiments and were hand trained prior to the beginning of
the experiment to retrieve pellets rapidly ufter discharge by the
dispenser. If pellets were not retrieved within
7
sec of magazine discharge they were withdrawn automaticaJJ.y. A count wo.s kept ofunretrieved pellets, and if this number amounted to more than 50
%
of
the total, the data were not accepted.
Recordings
Prior to the experiment all probes were screened for acceptable
unitary activity. ElectricEJl signals from the best of the fine wire
probes were fed through VJnplifiers Hith a frequency rEll'lge of
500-10,000 He!tzond then into waveform discriminators which utilized
height and time-constllnt "Window"' discriminators to select single units
for counting (Olds,
1965;
Olds,1967).
Spikes from what appeared ona. storDge scope to be from several different neurons were often so
similar in amplitude and wave-shape as to be indistinguishable by the
automatic counting device. Nevertheless, each spike was in itself
to the pool recorded as "'one unit"' were from a small family of
similar neurons localized at the recording point. A computerized
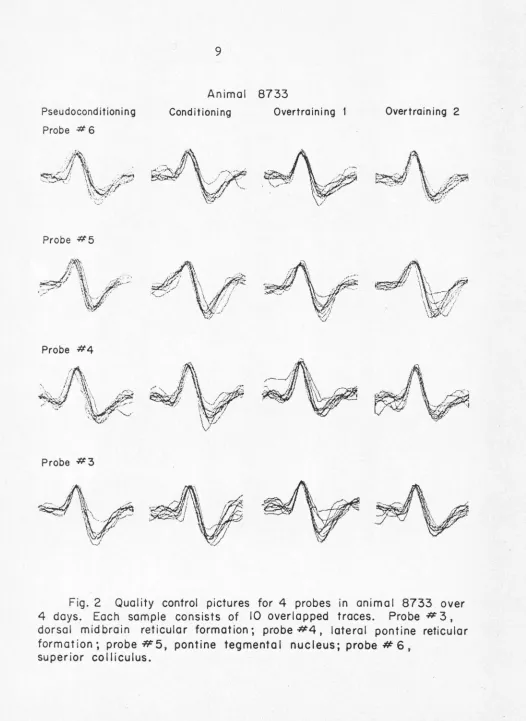
"quality contro11r system was used to plot out sc.mples of the recorded
units. These were plotted out in sets of 10 overlapped traces and
about 30 sets (JOO units) were sampled daily from each probe (see
Fie. 2). These tracings were qualitatively evaluated by visual
inopoction unct cnnos whore tmit.s of widely different amplitude or
wuvc-::;hape Here counted lls one, or cases where clearly non-unitary
spikes were accepted were excluded from the data prior to further
analysis. Careful comoarison of the analog output from the fine probe
amplifiers and the digital output from the discrirninators indicated
that not only were spikes of several similar shapes counted as though
all were one single unit, but also sometimes two spikes thc..t were
identiccil in appearance on the storage tube of a CRO were discriminated
so thut one w~s counted and the other not. Nevertheless, all of the clearly observable correlations between behavioral events and changes
in nnitary spike rate were equally visible whether analog traces or
computerized evaluation of digital output was used. Therefore,
because the latter was faster and more objective, the present data
are based on computerized counts derived from the automatic
discriminator system.
Procedure
The first day of the experiment was devoted to a
Pseu docond it ion in g
Probe # 6
Probe #5
Probe #4
Probe #3
Animal 8733
Conditioning Overtraining Overtraining 2
Fig. 2 Quality control pictures for 4 probes in animal 8733. over 4 days. Each sample consists of 10 overlapped traces. Probe # 3,
dorsal mid brain reticular formation; probe #4, lateral pontine reticular formation; probe H5, pontine tegmental nucleus; probe# 6,
[image:14.548.10.536.23.744.2]per minute, 3 sec trials were presented. The first second involved
only recording of background unit and behavioral activity (vv:i..th no
sign to the animal that a trial had started). At the beeinning of the
second second, one of three stimuli was presented (an auditory signal
of 1,000 cps, square pulses; a different auditory signal of 10,000 cps;
or the pellet dispenser which yielded a noise and a 45 mg pellet). If
one of the two tones was applied, it was continued for the remaining
two seconds of the trial. I f the food magazine was discharged this
was discrete, but the animal usually retrieved the pellet and had
beflun to eat prior to the end of the trial. Unit and behav-lor
recording was continuous for the whole 3 sec period. On each tri.a.l
one of the three stimuli was selected on a. pseudo-random basis so that
the incidence of the three was about equal over the 16 hr course of
the day•s experiment. There were about 320 trials of each of the
three types; 960 trials in all. The experiment was run a.utomatica.l~y
hetween
4
pm one day and 8 am the following day. Then there was an8 hr pa.use before the second day1s experiment was begun.
'I'he second day was prirnarily devoted to a conditioning experiment.
However, for the first 150 trials (i.e., about 50 of each of the three
kinds) the schedule of pseudo-conditioning was retained. Tue switch
was then made to a. conditioning series without any other break in the
procedure. Time intervals between trials remained the same. In this
case the three kinds of trials were: 1) tone 1 (called CS+) presented
at the end of the first second and continued as before, but with the
2) tone 2 (called CS-) presented at the end of the first second without
any correlated US, b.I1d
3)
no stimulus presented at all. For half ofthe a1ri.mW.s the high tone wo.s the CS+ and for the others the low tone
was so used. There 1·ras roughly the sb.11\e number of presentations of
tone 1, tone 2, and the food mli.caz1J:le us on day 1, but now the
mc:gazine was correlated with one of the two tones so that the tone
preceded and overlapped the presentation of the food magazine (with a
1 sec CS-US interval). The third (blank) time period was inserted so
that the total distribution of magazine and stimulus presentations over
time would be equal for the tuo procedures (pseudo- and reeiJ.
condition-:in,g).
Some of the a.nimols received additional days of conditioning in
order to ussess the effects of overtrainine. In these cases the
procedure was identical to that of the first real conditioning day,
except that no pseudo-conditioning triuls were presented at the
be~inninc of these days.
After either 1 or 2 duyo of overtrainine, ooverttl tmimulo wore
placed on an extinction schedule to determine if, and in what mnnner,
the conditioned responses would extinguish. The procedure was
identical to th&t of pseudo-conditioning.
Time Intervals
For each probe averages were computed, i.e., pre-stirnulus and
post-stimulus histogra:ns. The averages included all of the trials
~·/ithin el.ch trh.l the minimum time division (bin) was 10 msec;
thus there were 100 divisions per second. Finer grain analysis of
latencies therefore could not be nade. On each trial (for each probe)
a 1 or a 0 wv.s placed in each minimum time bin dependine; on whether
there had been any unit identifications made during that time interval.
\·lhile it \·rould have been more accurate to place the actual counts in
these bins, critical evaluation of preliminary data showed that the
sWle latencies and the same curve shapes were generated by either
method. This was partly due to the low probability of firing in the
units studied. Therefore, because binary entries 1vere less expensive,
this method was chosen.
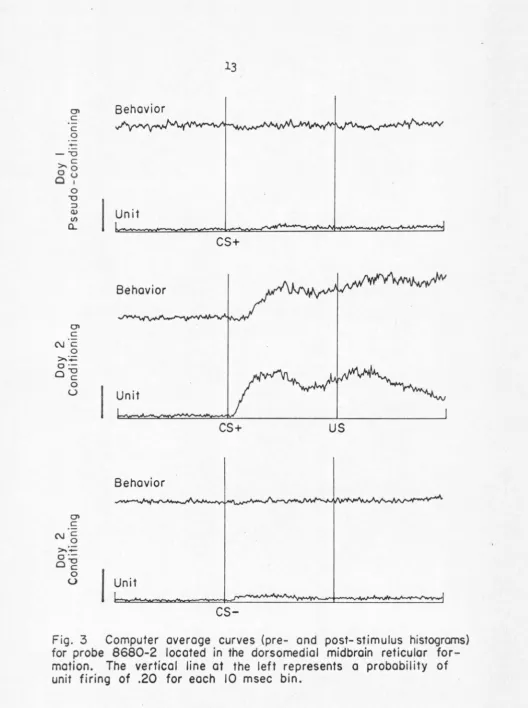
In computing avera3es, the contents of all the first bins were
odded, similarly the contents of all the second bins, and so forth.
In each case, the sum was divided by the number of trials; the result
w£..s & fr&ction denoting the proportion of tirnes that a unit detection
had been made in the indicated time interval (see Fig.
3).
Es.ch ofthe first 100 intervals (which were prior to stimulus application)
provided separate estimates of the proportions to be expected from a
rIDldom selection of a number of time bins equal to the number of
trials. The tine bins immediately following stimulus application
provided an estimate of the change in background firing rate caused
by applicntion of the auditory stimulus. Similar analyses \·Tere made
of data derived from the movement detector. In this case the "trigger
0\ c c 0 +-- "O
>. c
0 0
oY
0 "O ::J Q) C/)a..
0\ c NC 0 >.+::o·-o-g
0 u 0\ c NC 0 >.·.;:o·-o-g
0 Behavior Unit BehaviorI
UnitBehavior
u
Unitcs+
CS+
us
[image:18.551.10.538.15.722.2]after its onset. The anclysis of the unit data was conducted in two
•·mys. In one case, onl~,r the first 8 bins follm·tlng st.llnulus onset
1·rcre considered in order to mitigate unit effects fed back frora
behavior (called cnrly response anulysis). In the second case, the
entire second following stimulus on$et was considered (called late
rcs~onse onulysis).
Responses l.ll1d Lutcncics
A "response" Has mi c.:.ccclerat.:i on or deceleration of unit spike
rate c used by presentation of the auditory signal. The method of
w.'1olysis weis to establish a mean and standard deviation on the basis
of the first 100 (pre-sti.Inulus) bins. In the early response analysis
the post-stimulus bins were then 1iroupcd in twos:- 1 and 2
=
the period from 0-20 msec o.fter sti.I:mlation;3
and 4=
the period from 20-40 andso forth. The average rate over e.11 320 trials for each of these
pld.rs Has computed separately and this rate was converted into a
stl•ndardized deviation by subtracting the background mean over all
320 trials and dividing by the standard deviation of the backeround
me<0n. A response was considered to characterize a tine intervlll
(0-20, 20-40, 40-60, or 60-80 msec after stimulus onset) if the
average score for the pair of bins involved was at least
1.55
standarddeviations (p
<
.03,
hm-tailed) from the mean background rate (seeAppendix I). The end of the first time interval to show such a
deviation wc:is counted as the latency of the response. Latencies are
stimulation. 3ecause of the interest in very short latency conditioned
responses a single bin computation for the first bin was made. In this
case the requirement of a score of et least 2 standard deviations
(p
<
.046, two-tailed ) from the mean background rate was made (seeAppendix I). The first bin ,,ras most likely to contain electrical and
mechanical nrtifacts from the tone presentation and 10 msec responses
were still considered sonewhat questionable.
The late response analysis was conducted in a similar manner.
Tne post-stimulus second was divided into ~ sec periods: bins 1-25 =
the period from 0-250 msec after stimulation; 26-50
=
the period from250-500 r.tsec,and so forth. The average rate for each of these groups
was cor.tputed separately and this rate was also converted into a
st•indardized deviation. A response 1'18.S considered to characterize a
til::i.e interval if the averc~t;e score for the group of bins was ut least
1.00 standard deviations (p
<
.001, two-tailed) from the meanback-ground rate (see Appendi..'{ I). Such responses were highly visible.
The latency of an unconditioned response vias considered to be the
end of the first time interval which showed a significant deviation
in the srune direction on both the first day (pseudo-conditioning) and
the second day (conditioning). The latency of a conditioned response
Has counted as the end of the first time interval which after
conditioning showed a significant deviation from the background rate
nnd was also hrice any deviation in the same direction on the pseud
o-conditioning day. During overtraining a response was considered to
standard devie.tiono or more. This decree of ch<:.inee was apparent on
visual inspection.
The criteria of conditioning were chosen to assure 1) that there
i'Ias a rno.rked change caused by conditioning, and 2) that the change did
not represent nerely the disappeurancc of a prior response.
Conditioning seemed to cause some responses to disappear or to become
smaller, but it was not clear whether this was so. Some of these
changes must haye been due to habituation, the change beinG complete
at the end of the first day. Others were likely due to conditioning,
the Hhole change occurring on the second day. There were only
14
c&ses Hith latencies of 80 :msec or less th~t met the criterion which
was the inverse of thut for conditioning: namely, a significc.mt
response .on day 1 C1Ild a response of less than half of that on day 2.
I3ccc:use there Here feH clises and the source of the change vTas unclear,
it wcis deemed wiser to put these £•side for further experimental
<malysis. The criteria used were limited to identifying changes
caused by conditioning if these consisted in the appeare.nce of
res_'.Jonses where there «:ere none before, or in doubling of pre-exinting
responses (whether these were in the excitatory or inhibitory
direction). The criteria described above were not considered to be
statistical procedures, but merely tools used as 'objective criteria
for selection of new responses.
LeE:.rning Curves
tricll-by-trial sequence of trnining. For each probe 1·rhich showed a
leE.rned res )onse for Hhich dei.ta was c.vailable the post-stimulus
histogram from the condi tionine day was exb.Tnined to determine the
period of the response. This consisted of the portion of the
CS-US
intervul which shm·red a continuous chunge in the same direction
outside the rDrJ.se of variability observed in the backcround activity
of the pre-stimulus interval. Learning curves were obtoined by
subtracting the average probability of firing during the background
period from tht.t during the portion of the
CS-US
interval of interest.The difference in firinc rate from background was plotted for the
CS+
in 10 trial t;roups. The averaee pre-stimulus backeround rate was
plotted in 20 tri~l groups (10 each for
CS+
andCS-).
Average curvesarc presented for the first 250. triuls of pseudo-conditioning and for
20 pre-pairing trials and the first 250 trials after pairing began
during conditioning for the various brain regions and behavior.
An Dnalysis was made to determine the initial point of changed
responsiveness to the
CS+
for each unit and for the behavior of eachre;.t. The largest pre-pui.ring point w&s compared with successive points
on the learning curve. The first of three successive points on the
learning curve which were greater than the largest pre-pairing point
vras considered as the initial point of changed responsiveness to the
RESULTS
One hlll1dred units in 40 animals were observed. Unit responses
1·rere thus generully recorded from more than one probe in each animal.
The lll1it responses observed were a function of the location of the
recording probes.
Fi
e
.
l.,. is s.n exbl'nple of different responses fromtHo probes in the same animal.
Unconditioned Responses
Unconditioned responses were recorded from a total of 52 units (see
Appendix II for the latencies rind distribution of these responses).
These responses were most frequent in the posterior midbrain and
central pontine reticular formation. Most of these responses occurred
within 80 msec after stimulus onset.
Seventeen units displayed unconditioned responses with latencies
of 20 nsec or less. These were mainly in the posterior midbra.in and
the central pontine reticular f ormution where they appeared in
6
of14
cuses(43
%
)
and4
of14
cases (29%), respectively. The other7
short latency unconditioned responses occurred in the central region
of the posterior pontine reticular formation, the dorsolateral rer;ion
of the anterior pontine reticular formation, the central lateral
region of the anterior midbrain reticular f orr:i.ation, the region of the
medial lemniscus, dorsomedial red nucleus, dorsomedial central gray
and zona incerta. Only 2 units had lll1Conditioned responses with
latencies in the 10 msec interval which was considered questionable
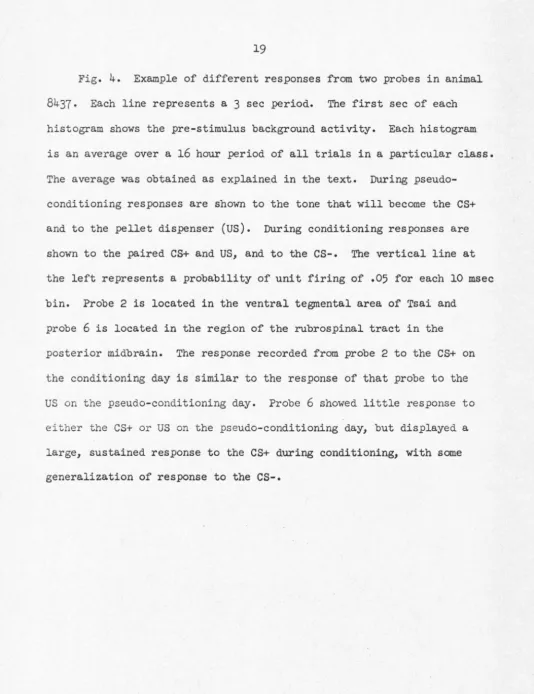
Fig.
4.
Example of different responses from two probes in animal8437.
Each line represents a3
sec period. The first sec of eachhistogram shows the pre-stimulus background activity. Each histogram is an average over a
16
hour period of all trials in a particular class.The average was obtained as explained in the text. During
pseudo-conditioning responses are shown to the tone that will become the CS+
and to the pellet dispenser (US). During conditioning responses are
shown to the paired CS+ and US, and to the CS-. The vertical line at
the left represents a probability of unit firing of .05 for each 10 msec bin. Probe 2 is located in the ventral tegmental area of Tsai and
probe
6
is located in the region of the rubrospinal tract in theposterior midbrain. The response recorded from probe 2 to the CS+ on
the conditioning day is similar to the response of that probe to the
US on the pseudo-conditioning day. Probe
6
showed little response toeither the CS+ or US on the pseudo-conditioning day, but displayed a large, sustained response to the CS+ during conditioning, with some
[image:24.557.8.542.30.724.2]Pseudo-conditioning
Behovior
Probe 2
I
Probe 6 ~CS+
Conditioning Behovior
the substantia ni~ra and dorsomediol region of the posterior midbra.in
reticular f ornation.
Thirty-nine units displayed unconditioned responses which began
within 80 msec after stimulus onset. The largest percentage of these
responses occurred in the posterior.midbrain where
9
of1.4
units(64%)
showed such responses. The proportion of these responses in other
reeions Has: centrW. pons,
8
of1.4
units(57%);
posterior pons,4
of9
units
(44
%
);
unterior pons,6
of1.4
units(43%);
posterior diencephalon,4
of13
units (31%); central midbrain,6
of26
units(23
%
);
andanterior midbrain, 2 of 10 units (20%). Figure
5
gives an example of~n unconditioned response from a unit in the reGion of the medial
lcmniscus.
In
13
cases unconditioned unit responses displayed latenciesGreater than 80 msec.
There were only
5
units which displayed inhibitory unconditionedresponses. These units were locc..ted in 1) superior colliculus,
2) central midbrai.n reticular formation,
3)
medial midbrain reticularformation,
4)
ventromedial midbrein reticular formation, and5) central pontine reticular formation.
Conditioned Responses
A significant conditioned response characterized 87 of the 100
units studied (see Fig. 6 and Appendix II for the latencies and
distribution of these responses). These responses were most frequent
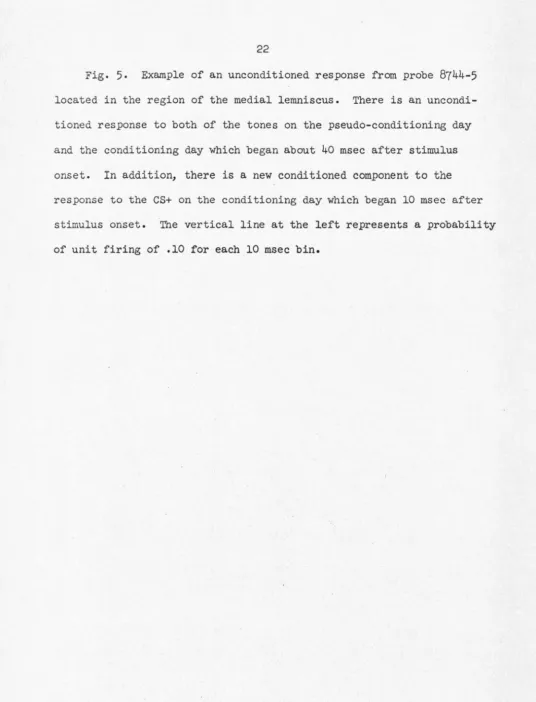
[image:26.552.5.540.31.733.2]Fig.
5.
Example of an unconditioned response from probe8744-5
located in the region of the medial lemniscus. There is an
uncondi-tioned response to both of the tones on the pseudo-conditioning day
and the conditioning day which began about
40
msec after stimulus onset. In addition, there is a new conditioned component to theresponse to the CS+ on the conditioning day which began 10 msec after
stimulus onset. The vertical line at the left represents a probability
[image:27.557.4.540.28.730.2]Ol
c c 0
- -0
>. c 0 0
o'-(
0
-0
:::::l
(l) (/)
Q_
Ol c
C\J c
0
>. ·.;::
o·-o-g
0(.)
I~
~
CS+
cs-I ... __ ..
~
~L
..
L.~ ~
cs-Fig. 6. Map indicating latencies and distribution of conditioned
responses. Sections A3290-Pl00 from atlas of Koenig and Klippel
(1963). Sections -7.0 and
-7.4
from atlas of Pelligrino and Cushman [image:29.549.6.540.18.728.2]LATENCY OF CONDITIONED RESPONSE
A3290fL
Al60fL
11
~
rrr~
~
,
T
;
;
·J I -·
.
,\
~
•
'
..
• 10 msec; • No conditioned response.
A2420fL Al760fL AI020fL
PIOOfL
-
---
1
-7.0 -7.4of the conditioned unit responses began before the behavioral response
(prior to 80 msec). Forty-six of the units also displayed uncondition
-ed responses.
Very short latency conditioned responses in a questionable 10 msec
c
Lte
G
ory
) c
h
n
ro
c
ter
i
zed
5
uni
ts
loc
a
t
e
d in 1) r
ee
ion o
f
t
ho
v
ent
ral
tegmcntDl decussotion, 2) dors£1 portion of the pontine reticular
formation, 3) pontine tegmental nucleus, 4) region of the medial
leroniscus, ltnd 5) region of the transverse pontine fibers (see Fig ?A).
Only the response of the unit localized in the region of the medial
lernniscus w~s followed by a significant conditioned response in the
20 msec interval.
Snort lntcncy conditioned responses with 20 msec latencies
(cppeoring 0-20 msec after stimulus onset) characterized 6 units
located in 1) zona incerta, 2) central region of the posterior pontine
reticular formation, 3) ventrolateral region of the anterior pontine
reticular for1nation, 4) dorsal region of the posterior pontine
reticular formation, 5) region of the superior cerebellar peduncle,
end 6) ventral tegmental area of Tsai (see Fig. ?B). Most of these
responses were of short duration. The unit in the ventral tegmental
area of Tsai was the only one to show u sustained conditioned response
in every interval of the early response analysis. These short latency
conditioned responses were not augmentations of unconditioned responses
since there was no indication of response in this interval on the
pseudo-conditioning day. There was no generalization of these
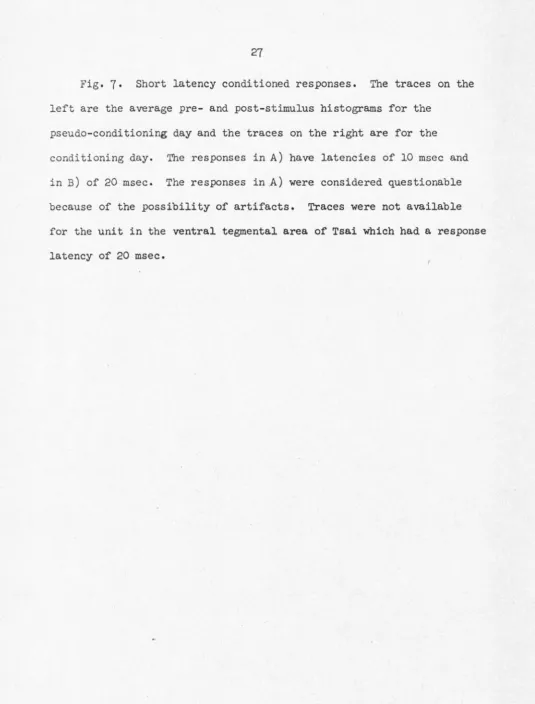
Fig.
7.
Short latency conditioned responses. The traces on theleft are the average pre- and post-stimulus histograms for the
pseudo-conditioning day and the traces on the right are for the
conditioning day. The responses in A) have latencies of 10 msec and
in B) of 20 msec. The responses in .A) were considered questionable
because of the possibility of artifacts. Traces were not available
for the unit in the ventral tegmental area of Tsai which had a response
[image:32.552.5.540.24.728.2]Pseudo-condi t1oning Conditioning
A)
ventrol tegmentol decussotion
CS+ US
pontine RF
pontine tegmentol nucleus
Ly,,.,.. t b
.~
mediol lemniscus
I .. d '
tronsverse pontine fibers
Bl
zono.
1ncerto+ 0
pontine RF
J • I
pontine RF
pontine RF
superior cerebellar peduncle
There were
44
units in all with conditioned responses displayinglatencies of less than 80 msec (prior to the overt behavior). These
were present throughout the extent of the brain stem, occurring most
frequently in the posterior midbrain and anterior pons where 8 of
14
units
(57%)
showed such latenciesil1
each group. The proportion ofthese responses in other areas was: posterior pons,
5
of9
units(56%);
central pons,
6
of14
units(43
%
);
posterior diencephalon,5
of13
units
(38%);
central midbrain, 10 of 26 units(38%);
and anteriorrrQdbrain, 2 of 10 units (20%). Nineteen of 41 units in the
non-specific reticular formation of the midbra.:i.n and pons were in this
group. These were not localized to a particular region of the
reticular formation. In
6
cuses the response in the first significantinterval w&s an e.ueznentation of un unconditioned response.
There were
43
units with conditioned responses displayingl Qtencies ereater than BO msec.
Five of the
87
units displayed inhibitory conditioned responses.Three of these were derived from that part of the midbr&in "reticular
active.ting system" surrounding the widest part of the central gray
matter.
Thirteen of the units studied did not significantly change their
response to the CS+ as a result of the conditioning procedure. These
units were distributed in the following manner:
5
units in the centralmidbrain; 2 units in the anterior midbrain; 2 units in the posterior
midbrain; 2 units in the central pons; 1 unit in the posterior
Comparison of Unconditioned and Conditioned Responses
A comparison was made of the response magnitude of those units
which showed only
an
unconditioned response with those that showedonly a conditioned response during the first 80 msec after onset of
the CS+ over
4
days of the experiment. For each unit the interval ofpeak response prior to 80 msec on the first conditioning day was
chosen for comparison. The medinn standardized score for each eroup
is nresented (see Table
1).
There wus no significo.nt difference inthe magnitude of unconditioned and conditioned responses on the
conditioning day or on either of the overtraining days by the median
toot (Hays,
1966).
Bt.ckground (Spontaneous) Firing Rates
Within a dcy there was little change in the unit background
firing rates. There was some change in the background rate of firing
from one day to the next. Such changes were most likely due to
changes in the 11·setting1t of the unit discriminators between days.
However, it is also possible that the firing rates of these units are
not constant over long periods of time or that a shift occurred in
recording to a different neuron from the small family of similar
neurons localized at the recording point.
Lellrning Curves
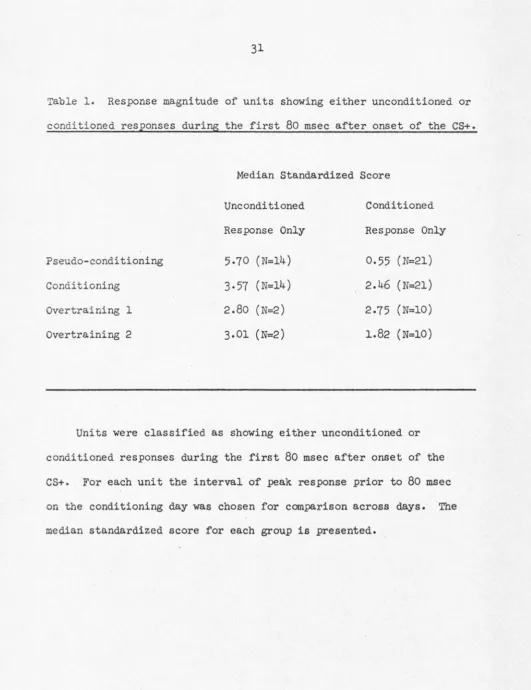
Table 1. Response magnitude of units showing either unconditioned or
conditioned responses during the first 80 msec after onset of the CS+.
Pseudo-conditioning
Conditioning
Overtraining 1
Overtraining 2
Median Standardized Score
Unconditioned
Response Only
5.70 (N=l4)
3·
57 (N=l4)2.80 (N=2)
3.0l (N=2)
Conditioned
Response Only
0. 55 (N=21)
2.46 (N=21)
2.75 (N=lO)
1.82 (N=lO)
Units were classified as showing either unconditioned or
conditioned responses during the first 80 msec after onset of the
CS+. For each unit the interval of peak response prior to 80 msec
on the conditioning day was chosen for comparison across days. The
[image:36.551.7.539.31.722.2]each brain area studied are presented in Fig. 8. Comparison of the
first t.nd second halves of each individulll curve by a Mann-Whitney.
test (Hays, 1966) indicated thot the trends seen in the average
curves h-ere representative of the members of the group making up that
curve. Each average curve was analyzed for a consistent increase or
decrease using a one-way anulysis of variance \vith repeated measures
over trillls (Winer, 1962).
During pseudo-conditioning none of the bra.in areas showed
sienificc.:nt changes in firine rate to the CS+ over trials. Almost
all of the brain areas showed no significant changes in background
firing rate. The only exception was the central pons which showed a
sienificant increase (p
<
.05) in background firing rate during thecourse of pseudo-conditioning. There was a significant decre<:i.se
(p( .01) in the behavioral curve in response to the CS+ durine
pseudo-conditioning.
All of the brain are&s and behavior showed signific.unt increases
(p
<
.01) in response to the CS+ during conditioning. None of thebra.in areas showed significant changes in background activity during
conditioning. Behavior showed a significant decrease (p
<
.01) inbackground rate during both pseudo-conditioning and conditioning.
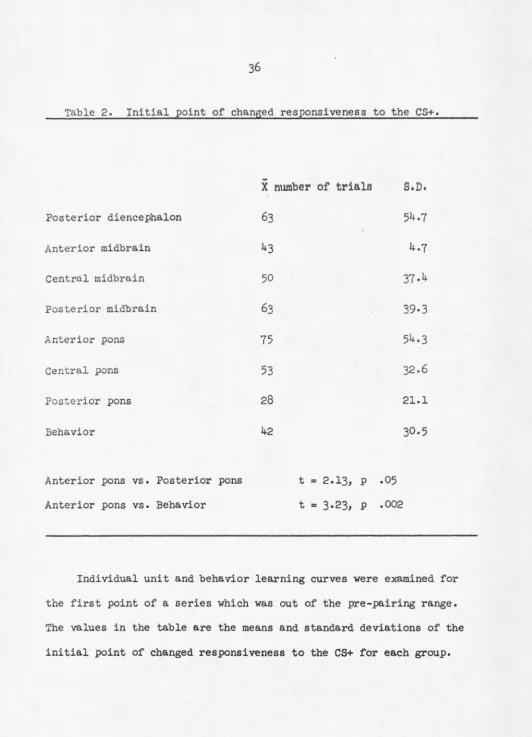
The results of the analysis of the initial point of chsnged
responsiveness to the CS+ are presented in Table 2. The mean number
of trials after pairing began for a learned trend to emerge ranged
from 28 to 75 for the various brain areas. The mean for the
behavioral learning curves was 42. The anterior pons
(X
= 75) and
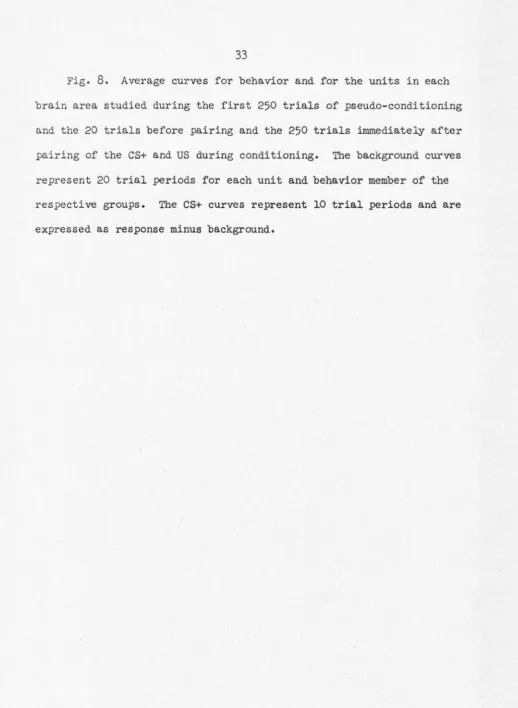
Fig.
8.
Average curves for behavior and for the units in eachbrain area studied during the first 250 trials of pseudo-conditioning
and the 20 trials before pairing and the 250 trials immediately after
pairing of the CS+ and US during conditioning. The background curves
represent 20 trial periods for each unit and behavior member of the
respective groups. The CS+ curves represent 10 trial periods and are
[image:38.554.20.539.21.730.2]PSEUDO-CONDITIONING
CONDITIONING
u
w
([)
""'
([)w
~
o_
5
0
5
0
([) 5
--- BACKGROUND
--cs+
,
...___
...I '
'
---,---
....-
... ..,,/ ', ,,"; I '
_,., ~
POSTERIOR DIENCEPHALON N =II
ANTERIOR MIDBRAIN N
=
4
CENTRAL MIDBRAI N N
=17
I I I I t I I I I
50 100 150 200 250 -20 50 100 150 200 250
TRIALS TRIALS
PS EU DO-CONDITION I NG
CONDITIONING
5
0
u
5w
(j)~
w
~Q_ 0
(j)
•
,,
I \ /\ I \ I \
--- BACKGROUND
--cs+
t
ANTERIOR PONS N
=
14
CENTRAL PONS N
=10
--, ,' \ ,...I \ '
5 I \ / '
-- \ / - \ I \ I ' ... ,,
u
w
20(j) ~
(j)
1-z
6
0
u
',1 ' , I \ / \ I '
,
,,
'
' I
"
POSTERIOR PONS N
=
7
I I I I
50 100 150 200 250 -20 50 100 150 200 250
TRIALS TRIALS
..
x
number
of trials
s'
!:) •Posterior diencephalon
63
54.7
Anterior midbrain
43
4.7
Central midbrain
50
37.4
Posterior midbrain
63
39.3
Anterior pons
75
54.3
Central pons
53
32.6
Posterior pons
28
21.1
Behavior
42
30.5
Anterior pons vs. Posterior pons t
=
2.13,
p.05
Anterior pons vs. Behavior t
=
3.23,
p.002
Individual unit and behavior learning curves were examined for
the first point of a series which was out of the pre-pairing range.
The values in the table are the means and standard deviations of the
[image:41.553.8.540.14.751.2]difference (p ( .05, two-tailed) in the mean number of trials to show
a learned trend by a t test (Hays, 1966). The anterior pons was the
only brain area. which differed significc;ntly (p< .002, two-tailed) from
behavior in the mean number of triuls to show a learned trend. Ovcrtrll.ining
There were
41
units with data available for 2 days of overtraining.Responses durine the first and last quarter of the 1 sec CS-US interval
were analyzed separately in order to obtain a general picture of these
chanees. A response was considered to be altered by further training
if it differed from the previous day's response by~ 0.5 standard
deviations or more. Eieht units were eliminated from the first quarter
second data and
4
llllits from the last quarter second data becuusethere was no significant conditioned response in those intervals on anv
of the three conditioning days.
The response in the first quarter of the second was increased or
stayed the same in 14 units and showed some decrease in 19 units
during the course of overtraining. Nine of the unit decreases reached
the pseudo-conditioning level by the end of overtraining. These units
Here locei.ted in the 1) posterior hypothalamic nucleus, 2) posterior
lateral hypothalumic area, J) medial mamilla.ry nucleus,
4)
re8ion ofthe mamillary peduncle, 5) region of the mamillothalarnic tract, 6) ventromedial red nucleus, 7) region of the medial lernniscus,
8) ventral teernental area of Tsai, and 9) dorsal pontine reticular
8 units which first showed a. significant conditioned response during
overtraining. These units wore located in the 1) posterior latero.l
hypothal&mic area, 2) region of the msmillary peduncle, 3) superior
colliculus, 4) red nucleus, 5) region of the medial lemniscus,
A
)
substantia nig
ra, 7) dorso
m
edis.1 p
ontine reticular
formntion,
and
8) medial raphe. In the last quarter of the second the response was
increased or stayed the same in
7
units and showed some decrease in30 units during overtraining. Ten of the unit response decreases
reached the pseudo~conditioning level by the end of overtraining.
These units were located in the 1) zona incerta, 2). medial forebrain
bundle region, .3) region of the basal optic tract, 4) ventronedial
red nucleus, 5) region of the crus cerebri, 6) dorsal midbrain
reticular form~tion, 7) ventral midbrain reticular formation, 8)
dorsomcdial pontine reticular forrnation, 9) medial pontine reticular
form~tion, and 10) ventrolateral pontine reticular formation. Only
2 of these were near the limbic midbrain areas. There were 6 units
which first showed a significant conditioned response during
over-training. These units were located in the 1) region of the msmillary
peduncle, 2) basal optic tract ~nd nucleus, 3) ventral midbrain
reticular formation,
4)
·substantia nigra,5)
dorsal pontine reticularformation, and 6) mediel pontine reticular formation. Figure 9
indicates the direction of response change during ovcrtruinine in the
bra.in areas studied. 1'"'igure 10 given Em excmple of a response which
stabilized in the early portion and a different response which
st~bilized in the later portion of the CS-US interval during
Fig.
9.
Map indicating the pattern of response in overtraining.A) shows responses from the first quarter of the CS-US interval. B)
shows responses from the last quarter of the CS-US interval.
[image:44.550.6.538.20.738.2]PATTERN OF RESPONSE IN OVERTRAINING
A)
A3290fL A2420fL A 17601-' A 1020fL Al60fL PIOOfL -7.0
8)
Fig. 10. Example of responses fran A) probe 8614-7 located in
the zona incerta in which the response stabilized in the early portion
of the CS-US interval during overtraining, an~ B) probe 8680-7 located
in the red nucleus in which the response stabilized in the late
por-tion of the CS-US interval during oyertraining. The upper trace
represents the behavior and the lower trace represents the unit
[image:46.550.4.541.30.730.2]Behavior Pseudo-conditioning
I
CS+ CS+
Conditioning
~I
I+.!~
CS+ US CS+ US
Overtroining I
... .J IAM~ ...
CS+ US CS+ US
Overtroining 2
J.,.l\,:,..Mj.L,. ....
..H>~JA.!.
M hthat of the latter, the behavioral latency for a particular subject
docs not appeur to shift over days, implying that the chanee in the
unit response over duys is not directly related to the behavior.
Extinction
Thero were 16 unita with data available for 2 dc..ys of extinction.
Tho qu£lrtor oocond intorvll.l d ta. were analyzed to determine if the
ro:Jponoes would return to their pscudo-conditionine level when the
CS+ was no lo~er followed by presentation of food.
In 2 c,ses with units located in the posterior ml:IJ1lilla.ry nucleus
ru1d substLntia niera the response was reduced to the pseudo-condition
-int; level on the first extinction day. In 8 cases the unit response
was reduced to the pseudo-conditioning level on the second extinction
day. These units were locuted in the posterior hypothalamus,
posterior lateral hypothruamic area, region of the mcmiillary peduncle,
substontia nigra, ventral midbrain reticular formation, and
3
unitsin the region of the medial lemniscus. Only 2 of the 10 responses
\·1hich did extinguish had displayed conditioned responses with
latencies of 80 msec or less on the first conditioning day. Both of
these units were in the region of the medial lemniscus. Figure 11
gives an example of a response Hhich did extinguish from a unit in
the recion of the medial lernniscus. The shift in background firing
rvte from day 1 to day 2 may reflect a release from inhibition ~s
a consequence of conditioning or a shift in recording to a different
Fig. 11. Example of a response that was extinguished from probe
8817-5 located in the region of the medial lemniscus. The vertical
line at the left represents a probability of unit firing of .10 for
CJ'I
c c
0
- -0
>. c
0 0
a
y
0 -0 ::J Q) (/') 0... CJ'I c
C'J
·
c:
0
>. ·..;::
o·-0~ 0 u CJ'I c
r<> .~
>.
2
0 ...
0 ~
o;j' > 0 c 0 ... >- u
0 c
o·..;::
x
w
C'J
c
LO 0
...
>. u
0 c
0 ·.;::
><
w
CS+
CS+
us
CS+
CS+
recordinc point.
'T'here were 6 units which still displnyed a. siGnificant
conditioned response in ·t least 1 of the quarter second intervals
nftcr 2 da;>rs of extinction. These responses were not confined to any
particul<Jr portion of the
CS-US
interval. The units were located inthe 1) H fields of Forel, 2) recion of the mwnillary peduncle,
1
3)
rccion of the r.iedial lenmiscus,4)
ventral midbrain reticulur-1.or-,,a.tion, 5) ventral tecmenta.l area of Tsai, t.nd 6) ventral pontine
reticular formc.i.tion. Four of these 6 units in which the conditioned
response did not extineuish ha.d. conditioned responses ·with latencies
DISCUSSION
Short latency conditioned unit responses (i·tlthin 20 msec after
CS onset) were recorded from 11 of the 100 probes. This was a.
a
u
ffi
c
icntly
lor
c
c
setof
very
co.rly
conditioned
unitres
p
onses
oo ti1t1t the brain stem reticular formation mieht be considered us a siteof locnl changes involved in some of the aspects of classical
conditioning. These very short latency conditioned responses were
not present in large enough numbers to perr:iit precise localization
of tho specific parts of the brain stem which might have been
particularly involved. The fact that our statistical criterion for
en curly conditioned response would be met sometimes by cha.nee durine
b lQrGe nur.lber of tests makes the data difficult to interpret.
Fortunately, the points discovered lmre not evenly distributed among
the points tested. They were not observed in the far lateral third
of the midbrain teQllentum and they were not found in the medial third
either; thus they took a mid-lateral position. At the midbrain level
they were present only in the lower half of the region studied.
These 20 msec conditioned responses were not only absent in the tectum,
but they were also absent in the upper half of the midbrain reticular
f orrnation. They i·rere present in the lower half of the mid brain
reticular formation in a mid-lateral position. In the pontine
reticular formation they also had a mid-lateral position. But the
pontine reticular formation in its most posterior part seems to have
only a. "lower half," being limited above by colliculi and fibers to
-~esponscs as being mainly in the lo·.'ler half of the pontine reticular
for;:1<..tion. In general, these responses were churacteristic for the
11inte,cre:.tive11 region of the reticular formation described by Brodal
(1957)
for the cat.By one criterion these short l~a.tency conditioned responses
could be considered to be fairly specific since only a small
proportion of these units showed such responses (about 1 in every
14
ccses). In a s:i.n-.ilar recent study (Olds, et al.,1972)
responsesin the posterior thal@nus were found to be more frequent (there was
r;iore than 1 short latency response for every 2 cases), while in the
cortex E.tnd hippocampus short latency responses a.mounted to only about
1 in JO, and 1 in 21 cases,respectively. When responses appeared in
1..n urea in l <..rge proportion they were considered to be non-specific.
By this analysis, the reticular examples were more specific than
those in posterior thalamus but less so than those in cortex.
In order to study the lone -run characteristics of learned
responses ob:Jerved in the brain stem the e;roup was increancd in oize
by ad.ding to those elements yielding very early conditioned responses
the others that showed conditioned changes during the course of the
CS-US intcrvcl. These were studied with two ma.in questions in mind:
1) what were the eventual stable levels of these responsen after
overtraining ( &s the behavior became more automatic), and 2) what
were the characteristic changes during extinction when the behavior
wc...s "unlearned. 11
up into tHo funilies during overtraining. One eroup eventuall.y
yielded stl1ble responses in the latter portion of the CS-US interval
(Lt the tine \-:hen the cmimlll i·/ll.s mtJJdng preµarctory responses reltJ.ted
to tho US). The other Group eventunlly yielded ::;table rcnponacs only
in the early portion of the CS-US interval (ut the time Hhen the
nnir.wl HLJs nw.kint:; orientinr; responaes related to the CS). These two
kinds of stabilization patterns Hhich appeared during overtrainine
ch£1racterized tHo menningfully different anatomical areas. These cc.n be indicuted by the following description. At the midbrain level the
non-specific parts of the tegmentum are divided into at least two
rclativel.y clearly separated syatema. One is the "reticular system"
described by 1-!vgoun and his colleagues (Magoun und Rhines, 1946;
Rhines CJ.nd Hagoun, 1946; 1-Ioruzzi and Maeoun, 19L,.9). This system is identified with that pa.rt of the brain usually called the reticular
for;nc.tion by w-iatomists (Brodal,
1957;
Scheibel and Scheibel,1
9
5
8
).
The other system in the ventral tegmental area has strongbi-direction-al connections and close functional similarity with the hypothalamic
rr.edilll forebrain bundle area described as a reward or motivational·
system (Olds, 1962). This limbic midbrain system extends from the
supramc:ruillary region through the area of Tsai, including an area
pro:x:imal to the substantia nigra and interpcduncular nucleus. These
two non-specific systems yield respectively 11arousal11 on the one hand, und ".motivationaln effects on the other when stimulated electricall.v (Olds and Peretz, 1
q6o).
While there are relations between them,that stvbilized in the early portion of the CS-US interval were
derived from probes in the reticular arousal system. The resr)onses
thnt stubilized in the latter portion of the CS-US interval were derived from probes in the limbic midbrain motivational system.
During extinction tests the most interesting differences followed si.mi la.r, but not identical lines. In this case early responses
(closer in time to the CS) were more rosistlmt to extinction and later
responses (closer in time to the conditioned behavior itself) were less resist~nt, usuully being completely extinguished when the behavior
wu.s also gone.
Several objections may be raised to the interpretation of this
date. as indicating parts of the brain stem where local changes
occurred during learning. It night be argued that alterations in
other parts of the brain could have been projected to the reticular
formation. A tonicaJ.J.y active element (a "dynamic engram"') might
result in the message taking a path which was functionally closed
prior to conditioning.
In
this case the point of the observed newconditioned response would be the effective site of the dynamic
engram. If such a mechanism were involved it should be observable
us a chonge in background firing rate of the tonically active element.
The somata of these elements might be in the recording area or
else-where, but their fibers 1·10uld necessarily project to the recording
region. It is on this basis that the local region might be
~·;ould c:.j1ibit a 11leurning curve" that would have o. trial-to-trial
chur ctcr similar to that of the conditioned response. While there
were no such changes in the bac.<r;round activity of the brain stem
units observed here, it is possible that such changes occurred in
other structures which project to the brain stem. In future
experi-T:lents eitter.ipts will be made to determine whether this in fact occurs
usirll; the present methods. Trial-to-trial changes in background
firing retes are already measured in these tests. In further studies
it i·:ill be necessary to map the brain with ca.re, seeking the
back-eround rute chenges that correlate with these response changes. Then
tests i·rill be made for projection from areas 1·rith background changes
to c.rcas vrith response chunges. \•/hile the mappine approach may seem
time co~sur.ri.ng, a finite number of scimples can give a fair
representa-tion even if the population approaches infinity as sc.unpling theory
clci.rly indicates.
It might be suggested that the animals were r.1ore aroused after
conditioning and that t.1is added arousal made the units more
responsive. Since the animals were equally aroused and in an
essentially identical situation on the first day during
pseudo-conditioning, back~round arousal could not account for the observed
conditioned responses. Moreover, if background arousal was a factor
then the conditioned responses should have been equal for the CS+
and the· CS-, and they were not.
One might question the validity of generalizing the anatomical
reeion, a middle integrating re~ion, and a medial output region) to
the present study of the brain stem of the rat. Herrick
(194
8
)
described a very siniler picture for the brain stem of the sal amander.
Since the reticulo.r formu.tion is so similar in species <.ts di verse as
the c~t l.lrtd the sulsr.i.tinder, it seem!l reasonable to assume thli.t these
divisions apply nlso to the rat.
Historict.J.ly, the reticulo.r formation was viewed as an undiffe
r-cntiuole mass of diffusely interconnected short-wconed cells in the
central portion of the brain stem extending from the lower border of
the nedulla. to the diencephalon. The assumed lack of orderly
arra.'1genent within the reticulur formation and the accompanying
difficulty in investigating such an area may account for the relative
paucity of analysis of the reticular formation in the first few
decades of this century. This Etttitude was expressed by W. F. Allen
Hriting in 1932 that "It is well knovm from embryology that most of
the left-over cells of the brain stem and spinal cord which are not
concerned in the formation of motor root nuclei and purely sensory
relay nuclei a.re utilized in the production of the formatio
reticuleris."
It is now generally agreed that the reticular formation receives
input from all of the ascending afferent systems ~.Amassian l.l.nd Devito,
1954
;
Scheibel, et al.,1955)
and cortic8.l. areas. In turn, itprojects primarily to the spinal cord, cerebellum, thalamus, and
cortex (Brodal,
1957).
Investigations of the fine structure of theorganization (Scheibel and Scheibel, 1958). Each portion of the stem
receives input primarily from collaterals of fibers passing by that
region. This separation of input in layers or "discs" a1ong the
anterior-posterior axis may be represented by the different rates of
learning in the various regions along the brain stem. Afferents enter
the reticular formation in a plane perpendicular to the long axis of
the bruin stem, while reticular cell dendrites show maximal arboriza-tion along this same plane. Therefore, synapses are formed between
axons and dendrites running parallel to each other. Cells in the
lateral region tend to project medially, whereas most medially situated
reticular cells have bifurcating axons that project long distances rostrally and caudally, emitting frequent collaterals along their
course. There is also some separation in the medial region of cells
that project primarily in a rostral or caudal direction. In the
medulla and pons, the former tend to be more caudally located than
the latter, implying a considerable potential for integration between
ascending and descending projections. In the present study recordings
were probably made from the large elements observed by the Scheibels.
The data are consistent with the view of the Scheibels that these are integrative mechanisms involved in higher processes. Other
investigators have postulated that the reticular formation is
impor-tantly involved in learning processes (Penfield, 1952; Gastaut, 1958;
Kilmer, et al., 1968; Bloch, 1970).
Some studies of conditioned unit responses and evoked potentials
1970); others have focused on mapping the conditioned responses in
the