Munich Personal RePEc Archive
Peer punishment with third-party
approval in a social dilemma game
Tan, Fangfang and Xiao, Erte
Max Planck Institute for Tax Law and Public Finance, Munich,
Germany, Carnegie Mellon University
21 December 2011
Online at
https://mpra.ub.uni-muenchen.de/35473/
Peer Punishment with Third-Party Approval
in a Social Dilemma Game
Fangfang Tan1 and Erte Xiao2
Abstract
This paper investigates how punishment promotes cooperation when the punishment enforcer is a third party independent of the implicated parties who propose the punishment. In a prisoner’s dilemma experiment, we find an independent third party vetoes not only punishment to the cooperators but punishment to the defectors as well. Compared with the case when the implicated parties are allowed to punish each other, both the cooperation rate and the earnings are lower when the enforcement of punishment requires approval from an independent third party.
Keywords
Social dilemmas, third party, punishment, cooperation, experiment
JEL classification
C72, C92, D63
1
Department of Public Economics, Max Planck Institute for Tax Law and Public Finance, Marstallplatz 1, D-80539, Munich, Germany, fangfang.tan@tax.mpg.de. Tel: + 49-89-24246-5252, Fax: + 49-89-24246-5299.
2 Corresponding author. Department of Social and Decision Sciences, Carnegie Mellon University, 208 Porter
1. Introduction
Punishment is a common means to enforce cooperation in a society. Numerous laboratory studies have shown that cooperation can sustain even among strangers under peer punishment mechanisms where the implicated parties can propose and enforce punishment on defectors (e.g., Fehr and Gächter, 2000; Masclet et al., 2003; Falk et al., 2005). In many naturally occurring environments, however, an independent third party decides whether or how to enforce sanctions proposed by the implicated parties. For example, tribe leaders or organization managers often have to decide whether to implement sanctions requested by the community or organization members. In this paper we take a first step toward understanding how sanctions promote cooperation when enforcers are independent of punishment proposers.3
Previous studies show that individuals are often willing to impose costly punishment on defectors in view of the long-term benefit of building a cooperative relationship (Gürerk et al., 2006; Gächter et al., 2008). In addition, negative emotions trigger costly punishment on wrongdoers even when there is no monetary benefit from doing so (Sanfey et al., 2003; Xiao and Houser, 2005; Hopfensitz and Reuben, 2009). However, emotions experienced by the punishment receivers, such as vengeance or spite, also lead to antisocial punishment (i.e., punishment imposed on cooperators either by cooperators or by defectors).
Based on these previous findings, we construct two hypotheses surrounding the decisions of an independent third party who is empowered with the right to uphold or negate proposals for punishment. On the one hand, a third party, as an outsider, is more likely to veto antisocial punishment (Hypothesis 1) as his judgment is less likely to be influenced by vengeance and more likely to be consistent with the existing social norms (Fehr and Fischbacher, 2004; Xiao, 2010; Cubitt et al. 2011). Indeed, previous studies on antisocial punishment argue for the importance of “shunning retaliation and centralizing punishment in the hands of the state” (Herrmann et al., 2008). On the other hand, a third party who is not in the position of the victims and who does not benefit from long-term cooperation may reject imposing costly punishment on the defectors (Hypothesis 2) for reasons such as short-run efficiency. Croson and Konow (2009) also find that impartial spectators punish less than implicated stakeholders due to the difference in their moral judgment.
Antisocial punishment has been shown to have a detrimental effect on cooperation, but punishment toward defectors can promote cooperation (see, e.g., Ertan, et al., 2009; Falk et al., 2005; Herrmann et al. 2008; Masclet et al., 2003; Nikiforakis, 2008; Xiao and Kunreuther, 2011). Thus, our hypotheses imply that the intervention of a third party is a double-edged sword: It promotes cooperation if antisocial punishment is pervasive, but it reduces cooperation when antisocial punishment is rare.
To test our hypotheses, we design an experiment based on a finitely repeated prisoner’s dilemma game. In the baseline, players can directly impose costly
punishment after observing each other’s actions. In the target treatment, players make punishment proposals to an independent third party. Punishment will be implemented at the proposer’s cost if the third party approves it.
We find the cooperation rate is significantly lower in the target treatment than the baseline. Supporting our hypotheses, the data show that third parties reject both antisocial punishment and punishment towards defectors. Although the third parties’ intervention reduces the occurrences of costly punishment, the average earnings are still lower in the target treatment than the baseline.
2. Experiment
Our experiment consists of two treatments: baseline and third-party approval (TPA). Subjects are randomly assigned to a group of three. Each subject interacts with the same group in the same role (A, B, or C) for 20 periods.4
[image:4.595.164.504.360.454.2]In the first stage of each period, subjects A and B decide simultaneously whether to cooperate (Option I) or defect (Option II) in a prisoner’s dilemma game (see Table 1). The decision results in a payoff, in which the exchange rate is 40 tokens to 1 euro.
Table 1: Payoff table of the prisoner’s dilemma game
Person B
Option I Option II
Option I 30 30 15 40 Person A
Option II 40 15 20 20
In the second stage, upon observing each other’s choices, A and B simultaneously and independently select how many tokens to deduct from the other player. Every three tokens deducted from the other player costs a player one token. The deduction amount does not go to any player’s earnings. The maximum amount of tokens one could be punished is 40 within a period.
In the baseline, C is merely an observer of the experiment. In the TPA treatment, C must decide simultaneouslywhether to veto the punishment decisions proposed by A and/or B, if any. Punishment proposals are implemented upon C’s approval.5 The punishment proposers do not incur any cost if the proposed punishment is not
4 We use a fixed matching scheme since we are interested in a repeated interaction environment such as firms or
communities.
5
approved.
In both treatments, all the decisions are revealed to each player at the end of each period. To keep the information symmetry between treatments, A and B still can see each other’s punishment proposals in the TPA treatment even if C bans any of them.
C’s earnings in both treatments are independent of the outcome of the game. The program randomly draws a number from the prisoner’s dilemma payoff matrix (15, 20, 30, 40) with an equal probability, and this is common knowledge. Moreover, C learns his own earnings only at the end of the experiment, while A and B never know the actual earnings of C. This setting minimizes the possibilities that players’ decisions are affected by the comparison of earnings between the third party C and the players A and B.
We conducted our experiment at the CentER lab at Tilburg University. We recruited 37 independent groups for the baseline treatment and 38 groups for the TPA treatment (225 subjects in total). The experiment was programmed and conducted in z-Tree (Fischbacher, 2007). Each period counted toward final earnings, resulting in average earnings of €12.90 per person for a 40-minute session.
3. Results
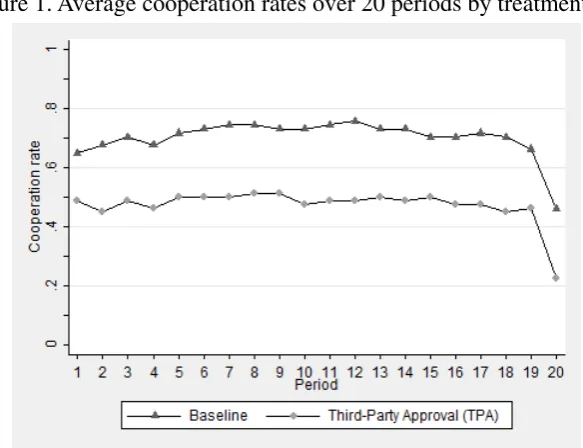
[image:5.595.156.448.453.677.2]Figure 1 plots the dynamics of the average group cooperation rates in both treatments. We find that the average cooperation rate is significantly lower in the TPA treatment than the baseline (0.47 vs. 0.70, Mann-Whitney test, p < 0.05).6 Furthermore, the average earnings are also marginally significantly lower in the TPA treatment (23.52 vs. 25.30, p < 0.10).
Figure 1. Average cooperation rates over 20 periods by treatment
To understand the observed treatment effect on cooperation, we test our hypotheses by comparing the punishment decisions across treatments. Given that
6 All tests reported in this paper are two-sided Mann-Whitney rank-sum tests. In all the analysis, we treat each
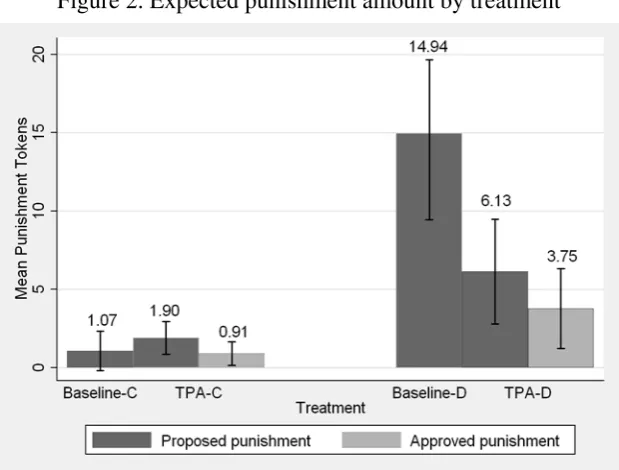
punishment severity is determined by both the frequency and the amount, we report the expected proposed and enforced punishment amount on the cooperators and defectors across treatments in Figure 2 (Table A1 in the appendix summarizes the punishment frequencies and average amounts across treatments).
We find supporting evidence for Hypothesis 1 that third parties reject antisocial punishment. As shown in Figure 2, in the TPA treatment, third parties significantly reduce the implementation of antisocial punishment proposals (1.90 vs. 0.91, p < 0.05). The data also support Hypothesis 2 that third parties lower punishment on defectors (6.13 vs. 3.75, p < 0.1). Moreover, our data suggest an indirect effect of third parties’ interventions on the punishment proposals especially for the defectors, which may also contribute to the low cooperation level in the TPA treatment. Compared to the baseline, As and Bs propose much less punishment on defectors in the TPA treatment although the difference is not statistically significant (6.13 vs. 14.94, p = 0.13). The proposed antisocial punishment remains very low in the TPA treatment as in the baseline, although it is marginally significantly higher than the baseline (1.90 vs. 1.07, p < 0.1).
Consistent with previous studies, our data suggest that antisocial punishment decreases cooperation while punishment imposed on defectors increases cooperation. In both treatments, cooperators, if not punished, continue cooperating in about 90% of the cases in the next period. In contrast, if punished, cooperators in both treatments continue cooperating in less than 50% of cases. Defectors, if not punished, cooperate in less than 10% of the cases in both treatments in the next period. But when defectors are punished, they switch to cooperation in 22.58% of the cases in the baseline and 35% of the cases in the TPA treatment.
As we discussed above, our hypotheses indicate that the overall effect of the third party’s intervention may be determined by how often antisocial punishment occurs. In our experiment, antisocial punishment occurred only in a few cases. In particular, cooperators are punished in 17 out of 1036 cases (1.64%) whereas defectors are punished in 80 out of 444 cases (18.02%) in the baseline. In the TPA treatment, cooperators are proposed to be punished in 54 out of 716 cases (7.54%) whereas defectors are proposed to be punished in 291 out of 804 cases (36.19%).
Figure 2. Expected punishment amount by treatment
Notes: For each group in each treatment, we calculate the product of the average punishment amount on cooperators (defectors) in a period and the frequencies of punishment decisions on cooperators (defectors). The expected punishment amount is the average of these products. Baseline-C represents antisocial punishment on cooperators in the baseline treatment; TPA-C represents antisocial punishment on cooperators in the TPA; Baseline-D means punishment on defectors in the baseline; TPA-D means punishment on defectors in the TPA. In the baseline, the proposed punishment is also the approved punishment.
4. Conclusion
Our study offers the first evidence that while third-party intervention controls antisocial punishment, it could lower cooperation in social dilemmas by diminishing punishment on defectors. As a first step, we exclude many features of the punishment mechanism with third-party approval in a naturally occurring environment. For example, we randomly assign a subject to be a third party in the experiment. In reality, the right to be the enforcer is either decided by law (such as judges) or selected by the governed people (such as tribe leaders). Moreover, a third party often benefits from good reputation and cooperation among the involved parties. Nevertheless, our findings draw attention to the importance of studying how these features influence effective punishment institutions when an independent third party is empowered with the right to uphold or negate punishment.
Acknowledgement
References
Croson, R., Konow, J. 2009. Social preferences and moral biases, Journal of Economic Behavior & Organization 69 (3), pp 201-212.
Cubitt, R. P., Drouvelis, M., Gächter, S., Kabalin, R. 2011. Moral judgments in social dilemmas: How bad is free riding? Journal of Public Economics 95, pp253-264.
Ertan, A., Page, T., Putterman, L. 2009. Who to punish? Individual decisions and majority rule in mitigating the free rider problem. European Economic Review 53,
495-511.
Falk, A., Fehr, E., Fischbacher, U. 2005. Driving forces behind informal sanctions.
Econometrica 73, pp2017-2030.
Fehr, E., Fischbacher. U. 2004. Third-party punishment and social norms. Evolution and Human Behavior 25(2), pp63-87.
Fehr, E., Gächter, S. 2000. Cooperation and punishment in public goods experiments.
American Economic Review 90(4), pp980-994.
Fischbacher, U. 2007. z-Tree: Zurich toolbox for ready-made economic experiments.
Experimental Economics 10(2), pp171-178.
Gächter, S., Renner, E., Sefton, M. 2008. The long-run benefits of punishment.
Science 322, pp1510.
Gürerk, Ö, Irlenbusch, B., Rockenbach, B. 2006. The competitive advantage of sanctioning institutions. Science 312 (5770), pp108-111.
Herrmann, B., Thoni, C., Gächter, S. 2008. Antisocial punishment across societies.
Science 319(5868), pp1362-1367.
Hopfensitz, A., Reuben, E. 2009. The importance of emotions for the effectiveness of social punishment. The Economic Journal 119(540), pp1534-1559.
Masclet, D., Noussair, C., Tucker, S. and Villeval, M. C. 2003. Monetary and non-monetary punishment in the voluntary contributions mechanism. American Economic Review 93, pp366-380.
Nikiforakis, N. 2008. Punishment and counter-punishment in public good games: Can we really govern ourselves? Journal of Public Economics 92(1-2), pp91-112. Sanfey, A., Rilling, J., Aronson, J.A., Nystrom, L., Cohen, J.D. 2003. The neural
basis of economic decision-making in the ultimatum game. Science 13(5626),
pp1755-1758.
Xiao, E. 2010. Profit seeking punishment corrupts norm obedience, SSRN working paper.
Xiao, E., Houser, D. 2005. Emotion expression in human punishment behavior.
Proceedings of the National Academy of Sciences 102 (20), pp7398–7401.
Appendix
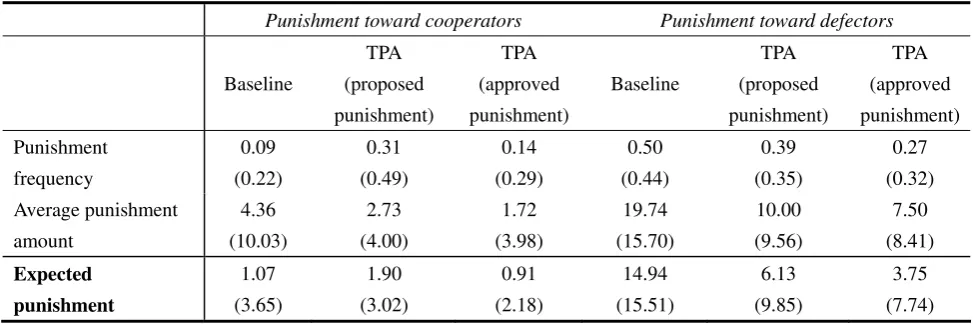
Table A1: Punishment frequencies and average amount across treatments
Notes: Standard errors in parentheses. For each group in each treatment, we calculate how often a player’s partner proposes (a third party approves) punishment for him if he cooperates (defects). “Punishment frequency” is the average of these numbers. Similarly, for each group in each treatment, we calculate the average punishment amount a player’s partner proposes (or approves) if he cooperates (defects). “Average amount” is the average of these numbers.
Punishment toward cooperators Punishment toward defectors
Experiment Instructions (TPA Treatment)
Thank you for coming to the experiment. Please read these instructions carefully!
Talking is not allowed at any time during this experiment. If you have a question,
please raise your hand, and an experimenter will assist you.
This experiment consists of 20 periods. Each participant is in the role of either Person A, or Person B, or Person C. Each participant’s role will be randomly determined by the computer at the beginning of the experiment and remain the same during the experiment. The computer will also randomly group a Person A with a Person B and a Person C at the beginning of the experiment. Each participant will stay in the same group during the whole experiment (i.e. 20 periods).
Each period consists of two stages as described below:
Stage 1:
Person A and Person B will simultaneously and individually decide whether to choose “Option I” or “Option II”. Each one’s earnings are determined as follows: (a) if both Person A and Person B select Option I, each earns 30 tokens; (b) if both Person A and Person B select Option II, each earns 20 tokens; and (c) if one selects Option I and the other one selects Option II, the one who chooses Option I earns 15 tokens and the one who chooses Option II earns 40 tokens. The payoff table below lists all the possible payoff outcomes for each possible scenario. The number on the left in each cell is Person A’s payoff and the number on the right is Person B’s payoff.
Payoff Table
Person B
Option I Option II
Option I 30 30 15 40 Person A
Option II 40 15 20 20
Person C’s earnings in each period is determined by a random process. The computer will randomly assign 30, 15, 40 or 20, with equal chance, as Person C’s earnings in
Stage 2
At the beginning of the second stage, all participants of a group will be informed of the decisions and earnings of the Person A and the Person B of the group. Again, Person C’s earnings will not be revealed to anyone including Person C him/herself.
First, Person A will have an opportunity to individually propose to the Person C in his/her group whether to deduct any amount of tokens from the matched Person B’s payoff. Every three tokens deducted from Person B’s payoff, if approved by Person C (see details below), will cost Person A one token. Meanwhile, Person B will also have
the same opportunity to propose to Person C whether to deduct any amount of tokens from the matched Person A’s payoff. Similarly, every three tokens deducted from Person A’s payoff, if approved by Person C, will cost Person B one token.
The maximum deduction amount a person can impose on the other is 40 tokens. That is, you can propose to deduct from the other person’s payoff by any amount of tokens between 0 and 40. However, the amount should be an integer number (e.g. 0, 1, 2…).
Next, Person C will see both Person A’s and Person B’s decisions and payoffs in the first stage, and also Person A’s and Person B’s proposals in the second stage.
If either Person A or Person B proposed any deduction for the matched Person B or Person A, then Person C will have to decide whether to approve the proposal(s). If Person C decides to approve the proposed deduction amount, then the deduction will be implemented. In this case, the proposer’s earnings will also be deducted by one-third of the deduction amount as we noted above. Person C’s payoff will not change no matter what decision he/she makes. (Note: Person C does not know his/her randomly assigned payoff in the first stage when making this decision).
If neither Person A nor Person B proposed any deduction, then Person C does not have any decision to make. No change will be made for any one’s earnings.
At the end of each period, each participant will see the decisions of each one in his/her group, the final earnings of Person A and B in that period.
periods. After all the 20 periods finished, each participant will receive a cash payment in private. The exchange rate of tokens to Euro is:
40 tokens = 1 Euro
Examples
Below are some examples to illustrate how payoffs in each period are determined. Suppose, in one period, in the first stage, Person A chose Option I and Person B chose Option II. Thus, Person A earns 15 tokens and Person B earns 40 tokens in the first stage. Suppose, in the second stage, Person A proposed to deduct 9 tokens from Person B’s earnings and Person B proposed to deduct 6 tokens from Person A’s earnings. Also, suppose the computer randomly assigns 30 tokens as Person C’s earnings in that period.
If Person C approved Person A’s proposal but rejected Person B’s proposal, each one’s earnings in this period are as follows:
Person A’s earnings=15-3=12 Person B’s earnings=40-9=31 Person C’s earnings=30
If Person C approved both proposals in the above scenario, then each one’s earnings in this period are as follows:
Person A’s earnings=15-3-6=6 Person B’s earnings=40-2-9=29 Person C’s earnings=30
If Person C rejected both proposals in the above scenario, then no one’s earnings would be changed. Each one’s earnings in this period are as follows:
Person A’s earnings=15 Person B’s earnings=40 Person C’s earnings=30
Now suppose in the second stage of that period, Person A proposed to deduct 8 tokens from Person B’s earnings and Person B did not propose any deduction amount. In this case, Person C only needs to decide whether to approve Person A’s proposal.
If Person C approved it:
Person A’s earnings=15-2.67=12.33 Person B’s earnings=40-8=32 Person C’s earnings=30
Person A’s earnings=15 Person B’s earnings=40 Person C’s earnings=30
Summary
To repeat, each participant will play in the same group for 20 periods. Each period consists of two stages. In the first stage, each Person A and Person B will decide whether to choose Option I or Option II which will decide each one’s earnings in the first stage. Person C’s earnings in a period will be randomly determined by the computer (Person C will know this amount only at the end of the experiment after all the decisions have been made. Person A and Person B will not be informed about this amount throughout the experiment). In the second stage, after knowing Person A and Person B’s decisions in the first stage, Person A (Person B) will decide whether to propose any deduction amount to the paired Person B (Person A). The proposed deduction amount will implemented only if Person C approves it. Person C’s earnings will not change no matter whether s/he approves the proposal(s).
Please raise your hand if you have any questions at this moment.
The next several pages outline the procedure of the experiment and the
Next, Person C will see both Person A’s and Person B’s decisions and payoffs in the first stage, and also Person A’s and Person B’s proposals in the second stage. Then, Person C decides whether to approve or reject the proposal if any.