Munich Personal RePEc Archive
The efficiency and effectiveness of social
spending in the EU-27 and the OECD –
a 2011 reanalysis
Tausch, Arno
Corvinus University of Budapest, Innsbruck University, Department
of Political Science
19 September 2011
Online at
https://mpra.ub.uni-muenchen.de/33516/
1
The efficiency and effectiveness of social spending in
the EU-27 and the OECD
–
a 2011 reanalysis
Arno Tausch
1,
Adjunct Professor of Political Science at Innsbruck University
Visiting Professor of Economics, Corvinus University, Budapest
Regular Lecturer of International Development, Vienna University
Address
Universitätsstraße 15, 2. Stock West
A-6020 Innsbruck
Tel.: +43 (0) 512 / 507 - 7051
Fax: +43 (0) 512 / 507 - 2849
e-mail:
[email protected]
[email protected]
[email protected]
mobile: Austria (++43 ) 664 16 15 250
Home: ++43 2235 44 6 49
personal academic website:
http://www.editions-harmattan.fr/index.asp?navig=auteurs&obj=artiste&no=20427
(editions L’Harmattan, Paris)
Abstract:
In this contribution, we look again at the trajectory and the efficiency of the
‘European social
model’
(EMS). We re-apply an econometric methodology, which was already used in the
study Herrmann, Heshmati et al., 2008, 2009. In that study, the authors said that apart from
1
2
Finland and the Netherlands, some new EU-27 member countries, especially the Czech
Republic and Slovenia, provided some answers to the question about the efficiency of state
expenditures in reducing poverty rates, while countries like the Federal Republic of Germany
achieved only a mediocre ranking. Considering the fact that social expenditures often amount
to ¼ or even 1/3 of the GDP in advanced Western democracies, this question has acquired
new and additional importance during the current international debt crisis, affecting several
European countries such as Greece.
Put in simple terms: aren’t the Germans, French … also
throwing a lot of money out of the window, while the world is now fixed on the Greeks?
The most influential social science journal article on the subject, mentioning the ESM in the
title, was written by Scharpf, 2002 and maintains that efforts to adopt European social policies
are politically impeded by the diversity of national welfare states, differing not only in levels
of economic development and hence in their ability to pay for social transfers and services
but, even more significantly, in their normative aspirations and institutional structures.
Hyman, 2005, even says that there is simply no agreement what 'social Europe' means in the
first place, let alone how it should be defended against the challenges inherent in the
neoliberal approach to economic integration. Jepsen and Pascual, 2005 were equally sceptical
about the subject. They even maintain that the very use of the concept under scrutiny here
–
the EMS - in the academic and political debate is simply a rhetorical resource intended to
legitimize the politically constructed and identity-building project of the EU institutions.
In our re-analysis of the underlying issues, we first come to the conclusion that the USA not
only had lower unemployment and higher economic growth rates than the EU-15.
Globalization inflows were smaller than in the EU-15, and
–
most importantly
–
the tendency
towards sectoral inequality as a proxy for overall inequality was less pronounced than in the
EU-15. The average, unweighted performance of the other Western democracies rather
resembles the European performance. So the dire fact number one, established in this essay, is
that during globalization, the ‘European social model’ is not better
avoiding the ills of
inequality than the USA or other Western democracies.
Following the methodology, developed in Herrmann et al., 2008, 2009, and based on the
latest Eurostat data, we then come to the conclusion that currently European social policy
only lifts 6.80% of the total European population, i.e. 29.44% of the poor population, out of
poverty. A very huge amount of money is required for this. Social transfers amount to ¼ of
the European GDP in 2006. To lift just 1% of the population out of poverty, a staggering
3.66% of the GDP is now needed on the level of the EU-27. We also show that Sweden,
Luxembourg, Finland, Spain, Denmark, Estonia, the Netherlands, Germany, the UK and
France currently spend 5% or more of their GDP to lift just 1% of the population out of
poverty. In most EU-27 member countries, only 1/3 or less of the poor population are lifted
out of poverty by social transfers. I.e. 2/3 or more of the population are practically not
reached by this gigantic machinery EMS, which consumes ¼ of European GDP.
3
only many different single experiences and models of social policy, and these experiences do
not confirm stereotypes, typologies or other generalized approaches. Our conclusions from
the data for 2003 suggest that very efficient models, like the Slovak Republic and the Czech
Republic, but also Luxembourg, Hungary and Poland, have to be contrasted by the laggards
and high-cost models, like Spain and Mexico, but also Finland, Switzerland, New Zealand,
and South Korea. The comparison of the aggregate efficiency parameters would even suggest
that there was a convergence of efficiency trends from the mid-1980s onwards across the
Atlantic.
Again applying the politometric methods, developed in the study Hermann
et. al.
2008, 2009,
we document the fact that the PIIGS
–
i.e. Portugal, Ireland, Italy, Greece and Spain, which
currently are at the centre of the financial storm, affecting Europe (Baglioni and Cherubini,
2010; Andrade and Chhaochharia, 2010; and Zemanek, 2010), do not perform well on our
refined social protection expenditure effectiveness indicator. The five leading countries
according to our analysis with the latest Eurostat 2008 data are Hungary; Slovakia; Bulgaria;
Czech Republic; and Poland, which are all new member states of the Union. The least
efficient social sectors are to be found in Latvia, Estonia, the UK and Greece.
We also present data from a re-analysis of the UNICEF report (2007) on child poverty in
advanced countries. Based on a standard SPSS XVIII principal component analysis of the
UNICEF variables, and weighting the five resulting factors according to their contribution in
explaining the total variance of the model we arrive at the conclusion that there is no evidence
which would suggest that there is a single European social model, to be distinguished from
the rest of other Western countries. Not surprisingly, the Scandinavians and North-west
Europeans lead the way: Finland; Sweden; Netherlands; Switzerland and Denmark. The most
lamentable situation of young people was to be encountered in the Baltic Republics, the USA
and Japan.
Confronted with the dire fact that neither the European political class, nor the academic
community have come up with convincing evidence on the European social model (EMS), we
arrive at the final conclusion that the ESM hardly exists.
Keywords: social spending, European Commission, index numbers and aggregation,
cross-sectional models, spatial models, economic integration, regional economic activity,
international factor movements, international political economy
4
Introduction
In this contribution, we look again at the trajectory and the efficiency of the
‘European social
model’
(EMS).
As of April 13
th, 2011, there were an astonishing 268000 entries for the exact
occurrence of this English language term on the Internet (of these, 12000 in
‘Google books’,
and 8150 in
‘Google Scholar’
alone).
Thus, there exist an almost unlimited number of
opinions, but also academic studies on the subject, and there is a lack of clear definitions and
empirical criteria, let alone a consensus on the existence of this European Social Model
(ESM), nor on its trajectory and future.
In this study, we again apply an econometric methodology, which was already used in the
study Herrmann, Heshmati
et al.,
2008, 2009, which created a real furore
2in several
2
Reactions to the study in the international media included:
Associated Press Worldstream - German, 23. Mai 2008 Freitag 2:01 PM GMT, Deutsches
Sozialsystem laut Studie nur mittelmaeßig effizient; Tschechien und Slowenien schneiden am besten ab - Untersuchung des Instituts zur Zukunft der Arbeit
Berliner Zeitung 24.05.08 Deutsches Sozialsystem offenbar nur maeßig effizient
Bild, 23.05.2008 ‘Sozialsystem nur Mittelmaß’ (on IZA (Institute for the Study of Labour, Bonn, FRG) Discussion Papers 3482, ‘Efficiency and Effectiveness of Social Spending’)
Czech Free Press, Válka o modré zlato Neděle, 03 Leden 2010 07:12 Josef Mikovec (on ‘Global
Capitalism, Liberation Theology and the Social Sciences’)
http://www.czechfreepress.cz/index.php?option=com_content&view=article&id=1701:valka-o-modre-zlato&catid=91:ekologie&Itemid=483
ddp Basisdienst, 23. Mai 2008 Freitag 2:54 AM GMT, Deutsches Sozialsystem laut Studie nur Mittelmaß
Der Westen (WAZ-Gruppe), 23.05.2008: Deutsches Sozialsystem nur mittelmaeßig (on IZA (Institute for the Study of Labour, Bonn, FRG) Discussion Papers 3482, ‘Efficiency and Effectiveness of Social
Spending’)
Deutschlandfunk (Interview by co-author Peter Herrmann on the Study ‘Efficiency and Effectiveness of Social Spending’) http://podster.de/episode/621421
Deutschlandfunk (Interview with Arno Tausch on the Study ‘Efficiency and Effectiveness of Social
Spending’)http://www.dradio.de/dlf/sendungen/europaheute/805302/
Die Welt, 23. 05. 2008: ‘Europaeischer Vergleich. Das deutsche Sozialsystem ist nur Mittelmaß’ (on IZA (Institute for the Study of Labour, Bonn, FRG) Discussion Papers 3482, ‘Efficiency and
Effectiveness of Social Spending’)
Frankfurter Neue Presse 24.05.08 Deutsches Sozialsystem/nur mittelmaeßig
Frankfurter Rundschau,24.05.08 ‘Schwache Performance/Deutsches Sozialsystem schneidet maeßig ab’ (on IZA (Institute for the Study of Labour, Bonn, FRG) Discussion Papers 3482, ‘Efficiency and
Effectiveness of Social Spending’)
Hamburger Abendblatt 27. 05. 2008 Studie: Deutsches Sozialsystem ist nur mittelmaessig effektiv
5
European countries. In that study, the authors said that apart from Finland and the
Netherlands, some new EU-27 member countries, especially the Czech Republic and
Slovenia, provide interesting answers to the question about the efficiency of state
expenditures in reducing poverty rates, while countries like the Federal Republic of Germany
achieved only a mediocre ranking.
This lamentable situation is not improved, if we move over to the world media. We just
picked out news items on the exact occurrence of this term from
‘Google news’
. Coincidence
has it that at 9:45 on April 13
that 9:45, the time of the beginning of the final wording of this
article, we are in the midst of a real controversy, involving three key players in the drama
–
the European Commission, European Labour, and European governments. Notably enough a
Chinese, not a European, news dispatch (Xinhua English.news.cn 2011-04-05 21:04:38) is the
first in today’s list, quoting
a
‘EU President Herman Van Rompuy
3’
as saying that recent
comprehensive economic measures approved by European leaders were necessary to save
‘
the
European social model
’
.
Item 2, taken from the influential news agency
Euractiv
(http://www.euractiv.com/en/socialeurope/unions-ensure-noisy-start-eu-summit-news-503451) tells us that thousands of protesters were recently blocking traffic in Brussels as part
of their campaign against neo-liberal austerity reforms agreed upon recently by EU leaders. In
the name of the very same
‘European social model’
they are against the very same proposals,
mentioned by Mr. Van Rompuy above, which he in turn justifies by this very same
‘European social model’
(ESM). Associated Press,
for its part, complicates the picture even
Nuernberger Nachrichten24.05.08 ‘Sozialsystem nicht effektiv genug?’ (on IZA (Institute for the Study of Labour, Bonn, FRG) Discussion Papers 3482, ‘Efficiency and Effectiveness of Social
Spending’)
Osnabruecker Nachrichten 24.05.08 Deutsches Sozialsystem laut Studie nur mittelmaeßig effizient. Tschechien und Slowenien schneiden am besten ab - Untersuchung des Instituts zur Zukunft der Arbeit
http://www.on-live.de/nachrichten_226_DEU_HTML.php?text=20080523APD1074.xml
Radio Praha, News 23.05.2008, http://www.radio.cz/de/nachrichten/104386 (on IZA (Institute for the Study of Labour, Bonn, FRG) Discussion Papers 3482, ‘Efficiency and Effectiveness of Social Spending’)
Spiegel Online23.05.08 Studie. ‘Deutsches Sozialsystem ist Mittelmaß - das tschechische Spitze’ (on
IZA (Institute for the Study of Labour, Bonn, FRG) Discussion Papers 3482, ‘Efficiency and
Effectiveness of Social Spending’)
Stuttgarter Nachrichten24.05.08 ‘Sozialsystem nur mittelmaeßig’ (on IZA (Institute for the Study of Labour, Bonn, FRG) Discussion Papers 3482, ‘Efficiency and Effectiveness of Social Spending’)
Stuttgarter Zeitung24.05.08 ‘Sozialsystem laut Studie mittelmaeßig’ (on IZA (Institute for the Study of Labour, Bonn, FRG) Discussion Papers 3482, ‘Efficiency and Effectiveness of Social Spending’)
Thueringische Landeszeitung 24.05.08 Nachrichten
WNYC Radio and Public Radio International, in collaboration with The BBC World Service, New York Times Radio and WGBH Boston: Lessons from Latin America: An Education for the EU? Tuesday, December 07, 2010. With the European Union in the midst of a severe debt crisis, foreign ministers of the eurozone are meeting this week to discuss remedies for their financial troubles. Latin America went through a difficult debt crisis of their own back in the 1980s, which is often referred to as the "Lost Decade." What lessons can Europe learn from Latin America to help prevent their own lost decade? http://www.thetakeaway.org/people/arno-tausch/
3
6
further by describing in the third dispatch on the Google news list of April 13
th2011
the
positions taken by European Finance Ministers, who, like Mr. Van Rompuy and the Trade
Unions, also justify their austerity actions, against which the trade unionists protested so
vehemently,
in
the
name
of
the
very
same
‘European social model’
(http://www.google.com/hostednews/ap/article/ALeqM5iy86HBj9um8OJ3pdHtOtAbfS2urQ?
docId=b3f7ed5a0afb4f7788b62a9c0da52711).
What is then this EMS, this European social model? Portugal? Sweden? Romania? Italy?
Ireland? The arithmetic mean of the performance of the old and/or new member states of the
EU-27? The lessons from the best or the worse five states according to Eurostat poverty
statistics? In relation to social protection expenditures?
In this article, we try to shed some light on this subject, which many see as the
‘
cornerstone of
the European life-style
’
. The European trade unionists define the ESM as:
‘The European Social Model is a vision of society that combines sustainable economic growth
with ever-improving living and working conditions. This implies full employment, good
quality jobs, equal opportunities, social protection for all, social inclusion, and involving
citizens in the decisions that affect them. In the ETUC’s view, social dialogue, collective
bargaining and workers’ protection are crucial factors in promoting innovation, productivity
and competitiveness. This is what distinguishes Europe, where post-war social progress has
matched economic growth, from the US model, where small numbers of individuals have
benefited at the expense of the majority. Europe must continue to sustain this social model as
an
example for other countries around the world’. (
http://www.etuc.org/a/111
)
Eurofound, which is an official European agency under the jurisdiction of the
EU-Commission,
defines
in
turn
the
EMS
in
pretty
much
the
same
way
(http://www.eurofound.europa.eu/areas/industrialrelations/dictionary/definitions/EUROPEAN
SOCIALMODEL.htm).
Looking at the main research results in the international literature
Arguably, the
book
with the highest global library circulation
4on the subject, Professor Gøsta
Esping-
Andersen’s
work
5, 1990, which achieved 40 editions, published between 1990 and
2010, and which is available in 5 languages, and which is now held by an astonishing 825
global libraries worldwide, making it a real classic of modern social science, maintains that
there are
three European social models
,
not a single one
, which he calls the
liberal/free
market regime
of the Anglo-Saxon countries, the
Nordic/social democratic regimes
, and
4
http://www.worldcat.org/identities/lccn-n84-135803
5
7
the
‘conservative’ European continental welfare regime
s
, linking social benefits to past
work experience and social insurance. Since the advantages and disadvantages of this
classification, with the possible addition of a
fourth category
, the
Mediterranean member
states
of the EU or other possible types of democratic welfare regimes, such a
‘radical type’,
which is sometimes used in reference to Australia and New Zealand, were debated at great
length in the literature (see Arts and Gelissen, 2002; Herrmann et al., 2009 for further hints at
the almost unlimited number of quantitative and qualitative studies on the subject), we will
not deal any further with the question of social policy typologies. What we are interested in
are parameters of efficiency. Many roads may lead to Rome. But just how good are they?
The
Social Science Research Network in New York,
which is the biggest social science
research community in the world today (http://www.ssrn.com/), lists in turn two papers, very
much opposing one another, as the ones with the highest global download figures on the
subject.
Olivier Blanchard
, 2006, ranked number 17
thamong the global economists
(http://logec.repec.org/scripts/authorstat.pf)
thinks that there is indeed a viable European
model,
based on three legs:
competition
in goods markets,
insurance
in labour markets, and
the
active use of macroeconomic policy
.
Alesina and Angeletos
, 2002, (Alesina is rank 23
among the global economists, see again
http://logec.repec.org/scripts/authorstat.pf ) maintain
by contrast that if a society believes like the
EU
that
luck, birth, connections and/or
corruption determine wealth, it will tax a lot
, thus distorting allocations and making these
beliefs self-sustained as well.
Using
Thomson Reuters Web of Science, the most authoritative index of the social
sciences today
(http://thomsonreuters.com/products_services/science/science_products/a-z/web_of_science/), we are similarly confronted with a variety of conflicting views. The most
influential journal article on the subject, mentioning the ESM in the title, was written by
Scharpf, 2002
and maintains that efforts to adopt European social policies are politically
impeded by the
diversity of national welfare states
, differing not only in levels of economic
development and hence in their ability to pay for social transfers and services but, even more
significantly, in their normative aspirations and institutional structures.
Hyman, 2005,
even
says that there is
simply no agreement what 'social Europe' means in the first place
, let
alone how it should be defended against the challenges inherent in the neoliberal approach to
economic integration.
Jepsen and Pascual, 2005
are equally sceptical about the subject. They
even maintain that the
very use of the concept under scrutiny
here
–
the EMS - in the
academic and political debate is
simply a rhetorical resource intended to legitimize the
politically constructed and identity-building project of the EU institutions
. Moving down
the article impact factor list, we find, among others the similarly pessimistic note by Alber,
2006 who concludes: (1)
for most indicators the range of
variation within the European
Union is bigger than the gap between Europe and the United States;
(2) counter to the
idea of policy convergence,
differences in the developmental trajectories of countries with
different institutional arrangements persist;
(3) despite having extended welfare states
similar to those of Continental European countries,
Scandinavian nations have performed
as well as the Anglo-Saxon countries in terms of employment and growth dynamics.
8
success. Montanari et al., 2008, examine key aspects of the development of the main social
insurance programs during the period 1980-2000 in 14 EU Member States. Their results
indicate a
divergence rather than convergence of social insurance replacement rates in
Europe
at that time. In terms of institutional models there is no evidence of a common
European Social Model (ESM) in the area of social insurance over the past decades.
Our own research design
Unsatisfactory, as it may be, a large part of the ESM typology and accounting literature left
out the important question of
globalization
and its
effects on the social situation in Western
democracies
from its horizon. Thus, we will first analyze the development history of the 15
old members of the European Union by comparison with the USA and some other Western
democracies since the 1980s according to their paths of
globalization
. We compare these
with the trajectory of
employment
, the
reduction of inequality
, and
economic growth
. We
will carry out this analysis with IMF data (real GDP per annum), the ETH Zurich
globalization time series data, the University of Texas Inequality Project data, based on
payment in 21 industrial sectors, and unemployment rates as per cent of the civilian labour
force (OECD). The data sources are documented in the Appendix and in Graph 1. Thus we
will highlight differences and or similarities between the trajectories of globalization and
social policy outcomes for the entire EU-15 in comparison with the US and some other major
western democracies.
With Herrmann
et al.
2009, and based on the latest Eurostat data and OECD data, we then go
on to ask ourselves
how efficient social policy is
.
Finally, we present data from a SPSS XVIII principal components re-analysis of the UNICEF
report (2007) on child poverty in advanced countries, weighting the five resulting factors
according to their contribution in explaining the total variance of the model. We finally ask
ourselves whether or not our data analysis offers any conclusion for the dramatic financial and
global situation in the PIIGS states
–
i.e. Portugal, Ireland, Italy, Greece and Spain, which
currently are at the centre of the financial storm, affecting the Eurozone.
Globalization and social outcomes in western democracies
9
This first approximation yields very clear empirical results, which might provide a new input
to the trodden paths of the entire
‘European social model’
debate. The
USA not only had
lower unemployment and higher economic growth rates than the EU-15. Globalization
inflows were smaller than in the EU-15, and
–
most importantly
–
the tendency towards
sectoral inequality as a proxy for overall inequality was less pronounced than in the
EU-15
. The average, unweighted performance of the other Western democracies rather resembles
the European performance. So the dire fact number one, established in this essay, is that
during globalization, the
‘European social model’
is not better than the USA or other Western
democracies:
11
Note: The EU-15 countries in our sample were: Austria; Belgium; Denmark; Finland; France; Germany; Greece; Ireland; Italy; Luxembourg; The Netherlands; Portugal; Spain; Sweden; UK. The other developed Western democracies comprised: Australia; Canada; Israel; Japan; New Zealand; Norway. Economic growth: IMF economic growth data (real GDP per annum) and growth predictions April 2009,
http://www.imf.org/external/datamapper/index.php. Globalization: ETH Zurich globalization time series data),
http://globalization.kof.ethz.ch/static/rawdata/globalization_2010_short.xls The Zurich data, used in this study, refer only to the ETH economic globalization time series, which covers ‘actual flows’, combining trade (per cent of GDP), foreign Direct Investment (flows, per cent of GDP); foreign direct investment (stocks, per cent of GDP); portfolio investment (per cent of GDP); income payments to foreign nationals (per cent of GDP).
Inequality: Theil Index of Inequality, based on payment in 21 industrial sectors; calculated from UNIDO sources in University of Texas Inequality Project, http://utip.gov.utexas.edu/data.html. Unemployment:
unemployment as per cent of the civilian labour force: http://stats.oecd.org/Index.aspx. In order to visualize our time series data in a single graph system and on a single easily comprehensible left hand scale, we had to rescale the data by multiplying the University of Texas time series Inequality (Theil Indices of the inequality of wages by sectors) data by a factor of 250 and to divide the ETH globalization flow data by a factor of 10, to produce scales, which range from 0 to 12.
To abolish poverty, 4/5 of total EU-27 GDP would be required
12
and the European South, long regarded as the number 1 success stories of the enlarged EU
since the 1970s and 1980s
6.
Euro-pessimists would expect a repetition of the Argentina script of the 1970s and 1980s on
our side of the Atlantic during the next decade, while Euro-optimists would have to continue
to expect that the European Common Agricultural Policy (CAP), the regional and structural
policies, the Common Foreign Policy and the European Monetary Union, on all of which we
spend an awful lot of money, are and continue to be
‘shining paths’
for humanity.
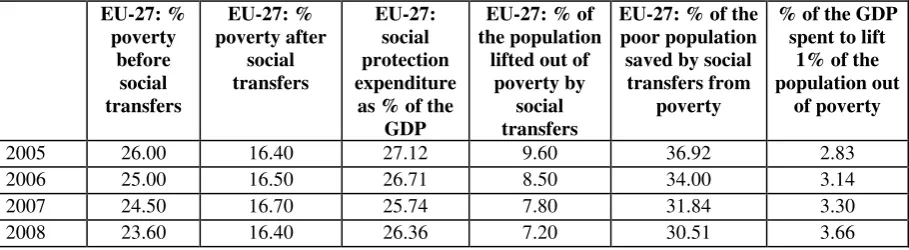
[image:13.595.70.525.402.527.2]Following the methodology, developed in Herrmann
et al.
2009, and based on the latest
Eurostat data, we first have to recognize that
European social policy only lifts 6.80% of the
total European population, i.e. 29.44% of the poor population, out of poverty
.
7A very
huge amount of money is required for this. Social transfers amount to ¼ of the European GDP
in 2006. To lift just 1% of the population out of poverty, a staggering 3.66% of the GDP is
now needed (Table 1). Tables 2 and 3 show that
Sweden, Luxembourg, Finland, Spain,
Denmark, Estonia, the Netherlands, Germany, the UK and France currently spend 5%
or more of their GDP to lift just 1% of the population out of poverty.
In most EU-27
member countries, only 1/3 or less of the poor population are lifted out of poverty by social
transfers. I.e. 2/3 or more of the population are practically not reached by this gigantic
machinery EMS, which consumes ¼ of European GDP.
Table 1: The ‚European social model’
- EMS
EU-27: % poverty before social transfers EU-27: % poverty after social transfers EU-27: social protection expenditure
as % of the GDP
EU-27: % of the population
lifted out of poverty by
social transfers
EU-27: % of the poor population saved by social
transfers from poverty
% of the GDP spent to lift
1% of the population out
of poverty
2005 26.00 16.40 27.12 9.60 36.92 2.83
2006 25.00 16.50 26.71 8.50 34.00 3.14
2007 24.50 16.70 25.74 7.80 31.84 3.30
2008 23.60 16.40 26.36 7.20 30.51 3.66
Source: our own compilations from Eurostat,
http://epp.eurostat.ec.europa.eu/portal/page/portal/product_details/publication?p_product_code=KS-SF-11-017
and http://epp.eurostat.ec.europa.eu/portal/page/portal/structural_indicators/indicators/social_cohesion
6
For current news about the financial crisis affecting Greece, Ireland and Portugal, see http://www.ftd.de/
7
Poverty is defined as corresponding to Eurostat criteria (Persons at-risk-of-poverty after social transfers). The risk-of-poverty threshold is set at 60 % of the national median equivalised disposable income. See
13
Table 2: The (in)efficiency of European social protection: % of the GDP necessary to lift
1% of the population out of poverty
Country 2007 2008
Bulgaria 0.37 0.66
Romania 0.64 0.69
Poland 1.06 1.36
Hungary 1.31 1.44
Latvia 0.76 1.54
Slovakia 1.48 1.65
Lithuania 1.51 2.13
Ireland 3.20 2.70
Czech Republic 3.00 2.97
Cyprus 1.87 3.07
Portugal 3.47 3.24
Greece 3.06 3.25
Slovenia 3.80 3.47
EU-27 3.30 3.66
Malta 3.75 3.85
Italy 4.31 4.21
Austria 5.93 4.55
Belgium 4.19 4.64
Euro 16 4.79 4.91
France 5.16 5.21
UK 5.97 5.27
Germany 5.13 5.67
Norway 4.98 6.23
Netherlands 5.15 6.47
Estonia 4.73 6.55
Denmark 5.65 6.60
Spain 6.18 6.88
Finland 5.77 6.92
Luxembourg 8.05 9.59
Sweden 8.56 10.87
Iceland 7.39 12.96
Source: our own compilations from Eurostat,
http://epp.eurostat.ec.europa.eu/portal/page/portal/product_details/publication?p_product_code=KS-SF-11-017
14
Table 3: % of the poor population, lifted out of poverty by social transfers
Country 2007 2008 2009
Iceland 22.66 14.41 12.07
Switzerland 12.21
Estonia 11.82 10.55 15.81
Luxembourg 15.09 13.55 16.29
Sweden 24.46 18.12 16.35
Spain 14.72 14.41 16.67
Finland 25.29 21.84 18.34
UK 17.11 19.40 21.36
Germany 26.21 24.38 22.50
Norway 27.06 24.00 23.81
Euro 16 25.81 26.17 24.64
Denmark 30.36 27.61 24.71
Malta 25.13 25.13 25.25
Italy 23.75 26.09 25.51
Netherlands 35.03 29.53 26.49
Cyprus 38.49 27.03 27.03
Belgium 29.63 29.33 27.72
Portugal 27.60 28.85 28.11
Greece 28.27 28.47 28.62
Austria 28.14 33.33 29.41
EU-27 31.84 30.51 29.44
France 31.05 31.72 29.89
Lithuania 33.45 27.54 30.17
Latvia 41.11 24.26 31.28
Slovenia 32.75 33.51 33.92
Poland 49.71 44.59 38.49
Czech Republic 39.24 41.18 38.57
Ireland 25.54 34.60 41.63
Slovakia 50.70 47.09 43.88
Romania 45.97 47.06 48.03
Bulgaria 63.76 52.23 52.81
Hungary 58.16 56.03 58.53
Source: our own compilations from Eurostat,
http://epp.eurostat.ec.europa.eu/portal/page/portal/product_details/publication?p_product_code=KS-SF-11-017
and http://epp.eurostat.ec.europa.eu/portal/page/portal/structural_indicators/indicators/social_cohesion
15
EMS -
‘European social model’,
Europe should be different from all other western
democracies under investigation. But clearly, this is not the case.
Neither ‘light
-
house to the world’ nor ‘sick man on the Bosporus’
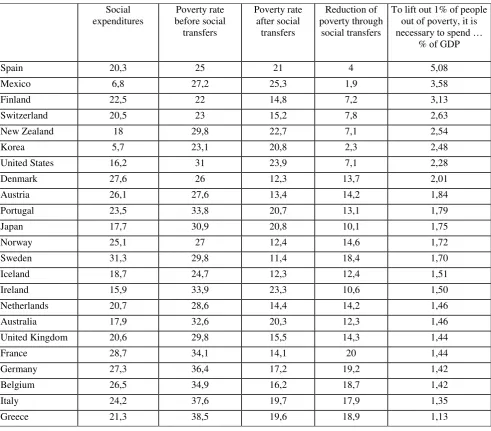
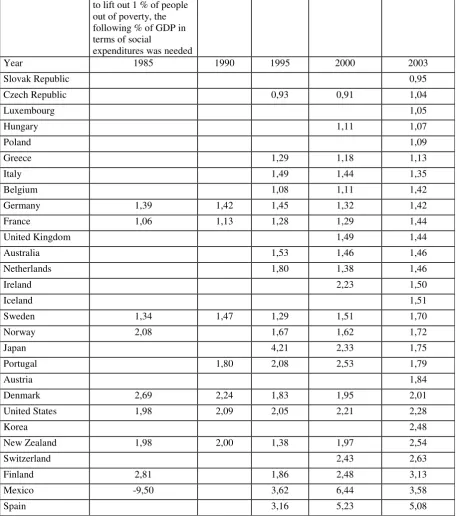
[image:16.595.77.445.331.684.2]Our analysis reveals that there are only many different single experiences and models of
social policy, and these experiences do not confirm stereotypes, typologies or other
generalized approaches. Our conclusions from the data suggest that very efficient models, like
the Slovak Republic and the Czech Republic, but also Luxembourg, Hungary and Poland,
have to be contrasted by the laggards and high-cost models, like Spain and Mexico, but also
Finland, Switzerland, New Zealand, and South Korea. The relatively good performance of
Greece, Italy and Belgium on this scale is rather a big surprise. The US,
nota bene,
belongs
rather to the international laggards on this scale:
Table 4: how much it costs to lift 1% of people out of poverty
–
OECD countries
Year 2000 2003
Slovak Republic 0.95
Czech Republic 0.91 1.04
Luxembourg 1.05
Hungary 1.11 1.07
Poland 1.09
Greece 1.18 1.13
Italy 1.44 1.35
Belgium 1.11 1.42
Germany 1.32 1.42
France 1.29 1.44
UK 1.49 1.44
Australia 1.46 1.46
Netherlands 1.38 1.46
Ireland 2.23 1.50
Iceland 1.51
Sweden 1.51 1.70
Norway 1.62 1.72
Japan 2.33 1.75
Portugal 2.53 1.79
16
Denmark 1.95 2.01
USA 2.21 2.28
Korea 2.48
New Zealand 1.97 2.54
Switzerland 2.43 2.63
Finland 2.48 3.13
Mexico 6.44 3.58
Spain 5.23 5.08
Source: our own calculations from Eurostat and OECD.stats, Microsoft EXCEL and SPSS XVIII
[image:17.595.81.442.69.199.2]The comparison of the aggregate efficiency parameters would even suggest that there was a
convergence of efficiency trends from the mid-1980s onwards across the Atlantic (Table 5).
In the EU-15, the cost to lift 1% out of poverty was 2.8% of the GDP, while in the US it was
2.3%:
Table 5: Aggregate social efficiency, EU-15 and USA since the mid 1980s
1995 2000 2003
EU-15 social transfers in % of GDP
27.6 26.8 27.7
USA social transfers in % of GDP
15.4 14.6 16.2
EU-15 poverty before social transfers
26.0 23.0 25.0
USA poverty before social transfers
31.3 30.3 31.0
EU-15 poverty after social transfers
17.0 15.0 15.0
USA poverty after social transfers
23.8 23.7 23.9
EU-15 % of the pop. lifted out of povery by social transfers
9.0 8.0 10.0
USA % of the pop. lifted out of povery by social transfers
7.5 6.6 7.1
EU-15 % GDP cost to lift 1% of the population out of poverty
3.1 3.4 2.8
USA % GDP cost to lift 1% of the population out of poverty
17
Source: our own compilations and calculations, based on SPSS XVIII, Innsbruck University, based on Eurostat (http://epp.eurostat.ec.europa.eu/portal/page?_pageid=1090,30070682,1090_33076576&_dad=portal&_schema= PORTAL) OECD.stats (http://stats.oecd.org/WBOS/index.aspx)
More sophisticated methods of comparison, based on the analysis of regression residuals
Our more sophisticated approach is based on a statistical analysis of residuals, established in
Herrmann et al., 2009. It has been argued in Herrmann
et al.,
2009 that the simple arithmetic
used to calculate the percentage of the GDP necessary to lift 1% of the poor out of poverty is
misleading insofar as it is easier for very poor states to be successful than for richer states,
whose initial number of poor people before social transfers is smaller. Applying politometric
methods, developed in Hermann
et. al.,
2009, we document our research results for the early
mid 2000s on the basis of the OECD data and for 2008, based on the regression residual
approach, in the Appendix. It might be sufficient to note that both our data series well
document the fact that the PIIGS
–
i.e. Portugal, Ireland, Italy, Greece and Spain, which
currently are at the centre of the financial storm, affecting Europe (Baglioni and Cherubini,
2010; Andrade and Chhaochharia, 2010; and Zemanek, 2010), do not perform well on our
refined social protection expenditure effectiveness indicator. The only plausible exception,
Ireland in 2008, insofar supports the argument of those who say that the Irish crisis, much
more than for the rest of the PIIGS, is a Bank-system driven crisis and was not so much a
question of inefficient state expenditures. The five leading countries according to the Eurostat
figures for 2008 and our politometric methods, documented in the Appendix, are Hungary;
Slovakia; Bulgaria; Czech Republic; and Poland, which are all new member states of the
Union. The least efficient social sectors are to be found in Latvia, Estonia, the UK and
Greece.
The comparison on the basis of the OECD statistics for the first part of the 2000s reveals the
following tendency. The efficiency leaders in poverty reduction were the Czech Republic; the
Slovak Republic; Iceland; Hungary; and Luxembourg.
The least efficiencies in poverty
reduction were to be found in Spain, the US, Portugal, New Zealand and Ireland
.
The European Social Model and future generations
18
2), the data again would have to confirm this (http://news.bbc.co.uk/2/hi/6359363.stm). Based
on a renewed standard SPSS XVIII principal component analysis of the UNICEF variables,
and weighting the five resulting factors according to their contribution in explaining the total
variance of the model (see Appendix), we first arrive at the following scale of child welfare in
advanced countries, based on the five factor analytical items, documented in the Appendix.
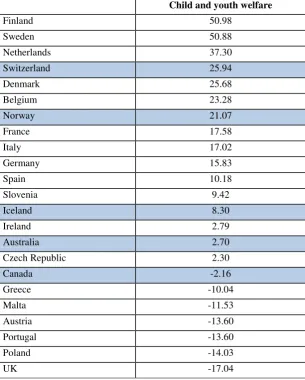
Again, there is no evidence, which would suggest that there is a single European social model,
to be distinguished from the rest of other Western countries. Not surprisingly, the
Scandinavians and North-west Europeans lead the way: Finland; Sweden; Netherlands;
Switzerland and Denmark. The most lamentable situation of young people according to such
criteria as the combined weight of the criteria of education and social empowerment; lifestyle,
social cohesion and social-economic status; subjective well-being and peer relationships and a
climate of non-violence was to be encountered in the Baltic Republics, the USA and Japan.
Table 6:
–
child and youth welfare
–
factor analytical results, based on UNICEF
Child and youth welfare
Finland 50.98
Sweden 50.88
Netherlands 37.30
Switzerland 25.94
Denmark 25.68
Belgium 23.28
Norway 21.07
France 17.58
Italy 17.02
Germany 15.83
Spain 10.18
Slovenia 9.42
Iceland 8.30
Ireland 2.79
Australia 2.70
Czech Republic 2.30
Canada -2.16
Greece -10.04
Malta -11.53
Austria -13.60
Portugal -13.60
Poland -14.03
19
Hungary -18.54
New Zealand -19.06
Japan -20.52
Estonia -27.96
USA -36.49
Latvia -55.74
Lithuania -58.12
Source: our own compilations and calculations, based on SPSS XVIII, Innsbruck University, based on UNICEF data (http://www.unicef-irc.org/cgi-bin/unicef/Lunga.sql?ProductID=445)
It is now legitimate to raise the question of costs again. One might argue for example that the
US Federal Government spends a lot less on social expenditures than most European states.
Graph 2 plots social expenditures, as documented by OECD, with the social policy outcome
for the young generations, as documented in Table 6 above:
Graph 2: social expenditures and child and youth welfare
Source: our own compilations and calculations, based on SPSS XVIII, Innsbruck University, based on UNICEF data (http://www.unicef-irc.org/cgi-bin/unicef/Lunga.sql?ProductID=445) and OECD.stats
20
It is now legitimate to compare the ‘social policy inputs’ (measured by social expenditures per
GDP) and the ‘social policy output’, measured by a social policy outcome variable (i.e. in our
[image:21.595.70.493.279.679.2]case, the data from Table 6). We again apply the regression residual method, introduced by
Herrmann et al., 2009. Table 7 documents these efficiency parameters of social expenditures
(residuals from the regression line, plotted in Graph 2). Which country was most efficient in
using its social expenditures for child and youth welfare?
Finland, the Netherlands,
Switzerland, Sweden and Ireland were the leaders among the western democracies
compared, while Austria, Hungary, the USA, Portugal and Poland were the laggards
.
The social systems of these countries may have cared well for other groups, like the elderly,
but they were not able to respond to the necessities to provide for the needs of future
generations.
Table 7: the (in)efficiency of social expenditures to bring about child and youth welfare
Social expenditures per
GDP
Child and youth welfare
Trend value: child and youth
welfare, statistically predicted by
social expenditures
per GDP
(in)efficiency of social spending in
providing child and youth welfare
Finland 22.50 50.98 6.54 44.44
Netherlands 20.70 37.30 1.23 36.07
Switzerland 20.50 25.94 0.64 25.30
Sweden 31.30 50.88 32.48 18.40
Ireland 15.90 2.79 -12.92 15.71
Iceland 18.70 8.30 -4.67 12.97
Spain 20.30 10.18 0.05 10.13
Australia 17.90 2.70 -7.02 9.72
Norway 25.10 21.07 14.20 6.87
Italy 24.20 17.02 11.55 5.47
Belgium 26.50 23.28 18.33 4.95
Denmark 27.60 25.68 21.57 4.11
Czech Republic 21.10 2.30 2.41 -0.11
Germany 27.30 15.83 20.69 -4.86
France 28.70 17.58 24.81 -7.23
New Zealand 18.00 -19.06 -6.73 -12.33
Japan 17.70 -20.52 -7.61 -12.91
Greece 21.30 -10.04 3.00 -13.04
UK 20.60 -17.04 0.93 -17.97
Poland 22.90 -14.03 7.72 -21.75
Portugal 23.50 -13.60 9.48 -23.08
USA 16.20 -36.49 -12.04 -24.45
21
Austria 26.10 -13.60 17.15 -30.75
Source: our own compilations and calculations, based on SPSS XVIII, Innsbruck University, based on UNICEF data (http://www.unicef-irc.org/cgi-bin/unicef/Lunga.sql?ProductID=445) and OECD.stats
(http://stats.oecd.org/WBOS/index.aspx)
Summary and conclusions
Confronted with the dire fact that neither the European political class, nor the academic
community have come up with convincing evidence on the European social model (EMS), we
present our own new evidence on the subject. Our approach is efficiency analysis driven and
establishes the following facts:
1.
The USA not only had lower unemployment and higher economic growth rates than
the EU-15. Globalization inflows were smaller than in the EU-15, and
–
most
importantly
–
the tendency towards sectoral inequality as a proxy for overall
inequality was less pronounced than in the EU-15. The average, unweighted
performance of the other Western democracies rather resembles the European
performance.
2.
We have to recognize that European social policy only lifts 6.80% of the total
European population, i.e. 29.44% of the poor population, out of poverty. A very huge
amount of money is required for this. Social transfers amount to ¼ of the European
GDP in 2006. To lift just 1% of the population out of poverty, a staggering 3.66% of
the GDP is now needed.
3.
The comparison of the aggregate efficiency parameters would even suggest that there
was a convergence of efficiency trends from the mid-1980s onwards across the
Atlantic (Table 5).
4.
Applying politometric methods, developed in Hermann
et. al.,
2009, we arrive at the
conclusion that the five leading countries with a cost efficient poverty reduction
system are Hungary; Slovakia; Bulgaria; Czech Republic; and Poland, which are all
new member states of the Union. The least efficient social sectors are to be found in
Latvia, Estonia, the UK and Greece (based on Eurostat, data for 2008).
5.
A comparison on the basis of the OECD statistics for the first part of the 2000s reveals
the following tendency. The efficiency leaders in poverty reduction were the Czech
Republic; the Slovak Republic; Iceland; Hungary; and Luxembourg. The least
efficiencies in poverty reduction were to be found in Spain, the US, Portugal, New
Zealand and Ireland.
22
education and social empowerment; lifestyle, social cohesion and social-economic
status; subjective well-being and peer relationships and a climate of non-violence was
to be encountered in the Baltic Republics, the USA and Japan.
7.
Which country was most efficient in using its social expenditures for child and youth
welfare? Finland, the Netherlands, Switzerland, Sweden and Ireland were the leaders
among the western democracies compared, while Austria, Hungary, the USA, Portugal
and Poland were the laggards. The social systems of these countries may have cared
well for other groups, like the elderly, but they were not able to respond to the
necessities to provide for the needs of future generations.
We should finally return to the text, published by Eurofound during the middle of the global
financial
crisis,
on
th
e
European
Social
Model
(‘ESM’)
23
Appendices to this study
Statistical sources used in this analysis (accessed on April 13
th, 2011) and the results
from the year 2011 at one glance
ECFIN/E3(2007)/REP/50604 and ‘Child Poverty and Well-Being in the EU: Current status and way forward”downloadable at http://www.libertysecurity.org/article1937.html
Eurostat
(http://epp.eurostat.ec.europa.eu/portal/page?_pageid=1133,47800773,1133_47802588&_dad=portal&_schema= PORTAL ) and
http://epp.eurostat.ec.europa.eu/portal/page/portal/product_details/publication?p_product_code=KS-SF-11-017
and http://epp.eurostat.ec.europa.eu/portal/page/portal/structural_indicators/indicators/social_cohesion
Herrmann, Peteret al. ‘Efficiency and Effectiveness of Social Spending”,IZA DP No. 3482, 2008, available at
http://www.iza.org/index_html?lang=de&mainframe=http%3A//www.iza.org/de/webcontent/publications/papers /viewAbstract%3Fdp_id%3D3482&topSelect=publications&subSelect=papers
OECD.stats (http://stats.oecd.org/WBOS/index.aspx),
24
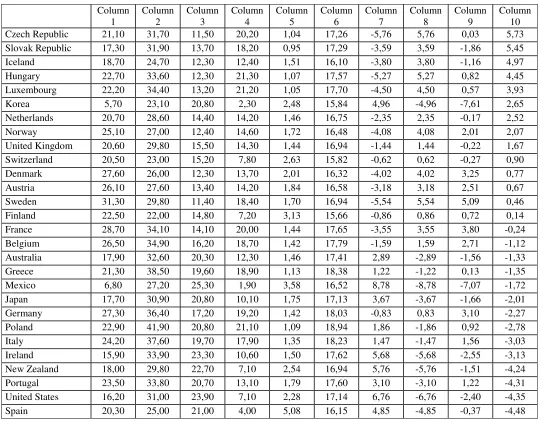
Analytical efficiency parameters of the reduction of poverty
–
a regression analytical approach
–
OECD countries, early 2000s
Column 1
Column 2
Column 3
Column 4
Column 5
Column 6
Column 7
Column 8
Column 9
Column 10 - efficiency
Czech Republic 21.10 31.70 11.50 20.20 1.04 17.26 -5.76 5.76 0.03 5.73
Slovak Republic 17.30 31.90 13.70 18.20 0.95 17.29 -3.59 3.59 -1.86 5.45
Iceland 18.70 24.70 12.30 12.40 1.51 16.10 -3.80 3.80 -1.16 4.97
Hungary 22.70 33.60 12.30 21.30 1.07 17.57 -5.27 5.27 0.82 4.45
Luxembourg 22.20 34.40 13.20 21.20 1.05 17.70 -4.50 4.50 0.57 3.93
Korea 5.70 23.10 20.80 2.30 2.48 15.84 4.96 -4.96 -7.61 2.65
Netherlands 20.70 28.60 14.40 14.20 1.46 16.75 -2.35 2.35 -0.17 2.52
Norway 25.10 27.00 12.40 14.60 1.72 16.48 -4.08 4.08 2.01 2.07
UK 20.60 29.80 15.50 14.30 1.44 16.94 -1.44 1.44 -0.22 1.67
Switzerland 20.50 23.00 15.20 7.80 2.63 15.82 -0.62 0.62 -0.27 0.90
Denmark 27.60 26.00 12.30 13.70 2.01 16.32 -4.02 4.02 3.25 0.77
Austria 26.10 27.60 13.40 14.20 1.84 16.58 -3.18 3.18 2.51 0.67
Sweden 31.30 29.80 11.40 18.40 1.70 16.94 -5.54 5.54 5.09 0.46
Finland 22.50 22.00 14.80 7.20 3.13 15.66 -0.86 0.86 0.72 0.14
France 28.70 34.10 14.10 20.00 1.44 17.65 -3.55 3.55 3.80 -0.24
Belgium 26.50 34.90 16.20 18.70 1.42 17.79 -1.59 1.59 2.71 -1.12
Australia 17.90 32.60 20.30 12.30 1.46 17.41 2.89 -2.89 -1.56 -1.33
Greece 21.30 38.50 19.60 18.90 1.13 18.38 1.22 -1.22 0.13 -1.35
Mexico 6.80 27.20 25.30 1.90 3.58 16.52 8.78 -8.78 -7.07 -1.72
Japan 17.70 30.90 20.80 10.10 1.75 17.13 3.67 -3.67 -1.66 -2.01
Germany 27.30 36.40 17.20 19.20 1.42 18.03 -0.83 0.83 3.10 -2.27
Poland 22.90 41.90 20.80 21.10 1.09 18.94 1.86 -1.86 0.92 -2.78
Italy 24.20 37.60 19.70 17.90 1.35 18.23 1.47 -1.47 1.56 -3.03
Ireland 15.90 33.90 23.30 10.60 1.50 17.62 5.68 -5.68 -2.55 -3.13
New Zealand 18.00 29.80 22.70 7.10 2.54 16.94 5.76 -5.76 -1.51 -4.24
Portugal 23.50 33.80 20.70 13.10 1.79 17.60 3.10 -3.10 1.22 -4.31
USA 16.20 31.00 23.90 7.10 2.28 17.14 6.76 -6.76 -2.40 -4.35
25
Analytical efficiency parameters of the reduction of poverty
–
a regression analytical approach
–
EU-27 countries, 2008
Country Column 1 Column 2 Column 3 Column 4 Column 5 Column 6 Column 7 Column 8 Column 9 Column 10 - efficiency
Hungary 22.71 28.20 12.40 15.80 1.44 17.95 -5.55 5.55 0.00 5.55
Slovakia 16.02 20.60 10.90 9.70 1.65 14.67 -3.77 3.77 -0.16 3.93
Bulgaria 15.48 44.80 21.40 23.40 0.66 25.13 -3.73 3.73 -0.18 3.90
Czech Republic 18.72 15.30 9.00 6.30 2.97 12.38 -3.38 3.38 -0.10 3.47
Poland 18.56 30.50 16.90 13.60 1.36 18.95 -2.05 2.05 -0.10 2.15
Romania 14.25 44.20 23.40 20.80 0.69 24.87 -1.47 1.47 -0.20 1.68
Netherlands 28.45 14.90 10.50 4.40 6.47 12.21 -1.71 1.71 0.14 1.56
Slovenia 21.49 18.50 12.30 6.20 3.47 13.76 -1.46 1.46 -0.03 1.49
Austria 28.18 18.60 12.40 6.20 4.55 13.81 -1.41 1.41 0.13 1.27
France 30.76 18.60 12.70 5.90 5.21 13.81 -1.11 1.11 0.20 0.91
Norway 22.44 15.00 11.40 3.60 6.23 12.25 -0.85 0.85 -0.01 0.85
Denmark 29.69 16.30 11.80 4.50 6.60 12.81 -1.01 1.01 0.17 0.84
Iceland 22.03 11.80 10.10 1.70 12.96 10.87 -0.77 0.77 -0.02 0.78
Ireland 22.12 23.70 15.50 8.20 2.70 16.01 -0.51 0.51 -0.01 0.52
Belgium 28.28 20.80 14.70 6.10 4.64 14.76 -0.06 0.06 0.14 -0.08
Sweden 29.35 14.90 12.20 2.70 10.87 12.21 -0.01 0.01 0.16 -0.16
Malta 18.86 19.50 14.60 4.90 3.85 14.19 0.41 -0.41 -0.09 -0.31
Finland 26.31 17.40 13.60 3.80 6.92 13.29 0.31 -0.31 0.09 -0.40
EU-27 26.36 23.60 16.40 7.20 3.66 15.97 0.43 -0.43 0.09 -0.52
Cyprus 18.42 22.20 16.20 6.00 3.07 15.36 0.84 -0.84 -0.10 -0.74
Germany 27.76 20.10 15.20 4.90 5.67 14.45 0.75 -0.75 0.12 -0.87
Luxembourg 20.14 15.50 13.40 2.10 9.59 12.47 0.93 -0.93 -0.06 -0.87
Euro 16 27.47 21.40 15.80 5.60 4.91 15.02 0.78 -0.78 0.12 -0.90
Portugal 24.33 26.00 18.50 7.50 3.24 17.00 1.50 -1.50 0.04 -1.54
Italy 27.79 25.30 18.70 6.60 4.21 16.70 2.00 -2.00 0.13 -2.12
Lithuania 16.16 27.60 20.00 7.60 2.13 17.70 2.30 -2.30 -0.16 -2.15
26
UK 23.72 23.20 18.70 4.50 5.27 15.79 2.91 -2.91 0.03 -2.93
Spain 22.71 22.90 19.60 3.30 6.88 15.66 3.94 -3.94 0.00 -3.94
Estonia 15.05 21.80 19.50 2.30 6.55 15.19 4.31 -4.31 -0.19 -4.13
Latvia 12.62 33.80 25.60 8.20 1.54 20.38 5.22 -5.22 -0.24 -4.98
Column 1 Social expenditures per GDP OECD stats/Eurostat Column 2 Poverty rate before social transfers OECD stats/Eurostat Column 3 Poverty rate after social transfers OECD stats/Eurostat
Column 4 Reduction of poverty through social transfers simple algebraic substraction, based on OECD stats data: Column 2 - Column 3
Column 5 To lift out 1% of people out of poverty, it is necessary to spend … % of GDP
simple algebraic calculation, based on OECD stats: Column 1:Column 4
Column 6 Trend value: poverty after social transfers, as statistically predicted by poverty rates before social transfers
linear trend values EXCEL regression on OECD stats data: poverty before social transfers (x)->poverty after social transfers (y)
Column 7 residual from this regression (‘poverty too large in comparison to what one could expect from our knowledge about poverty before social transfers’)
subtraction of poverty after social transfers data (Column 3) from predicted value (Column 6)
Column 8 analytical measure of poverty reduction (regression residual * -1) simple multiplication of column 7 by (-1) Column 9 Trend value: poverty reduction (social expenditures->analytical measure
poverty reduction)
linear trend value EXCEL regression based on OECD stats data: Column 1 -> Column 8 Column 10 efficiency of social spending in poverty reduction Column 8 minus Column 9
27
The five extracted factors and their contribution to total variance
Component Eigenvalue
Total % of
variance explained by
the model
Cumulated % of total
variance explained
1 6.627 16.569 16.569
2 5.79 14.475 31.044
3 3.947 9.867 40.911
4 3.231 8.079 48.99
5 2.787 6.968 55.958
Matrix of components
Education and social empowermen t Lifestyle, social cohesion and social-economic status European youth policy model subjective well-being and peer relationship s climate of non-violence
REVERSED FOR THE INTERPRETATION OF THE FACTOR SCORES
NO YES YES YES YES
Percentage of children (0-17) in households with equivalent income less than 50 per cent of the median: most recent data.
-0.502 -0.015 0.525 0.328 0.085
Percentage of children reporting low family affluence, aged 11, 13 and 15: 2001.
-0.586 0.607 -0.222 0.312 -0.065
Percentage of children aged 15 reporting less than six educational possessions: 2003.
-0.375 0.211 -0.152 0.531 0.067
Percentage of children aged 15 reporting less than ten books in the home: 2003.
0.134 -0.12 0.003 -0.116 0.385
Percentage of working-age households with children without an employed parent OECD: most recent data.
-0.052 0.294 -0.047 0.068 -0.355
Infant mortality rate (per 1000 live births): most recent data.
-0.495 0.706 0.141 -0.002 0.018
Low birth rate (% births less than 2500g): most recent data
-0.377 -0.425 0.222 0.352 0.042
Measles: % children immunized aged 12-23 months: 2003
-0.186 0.405 -0.28 0.061 -0.212
DPT3: % children immunized aged 12-23 months: 2002.
-0.064 0.336 -0.572 -0.008 -0.356
Polio 3: % children immunized aged 12-23 months: 2002
-0.005 0.376 -0.659 -0.236 -0.349
Deaths from accidents and injuries per 100,000 under 19 years, average of latest three years available.
-0.62 0.358 0.006 -0.42 0.127
Reading literacy achievement aged 15: 2003 0.757 0.216 0.299 0.003 -0.150
Mathematics literacy achievement aged 15: 2003 0.854 0.171 0.091 0.213 0.012
Science literacy achievement aged 15: 2003 0.707 0.191 0.169 0.447 -0.136
Full-time and part-time students in public and private educational institutions aged 15-19 as a percentage of the population of 15-19 year-olds: 2003
0.575 0.154 -0.441 0.25 -0.117
Percentage of 15-19 year-olds not in education or employment: 2003
-0.552 -0.29 0.068 -0.300 0.002
28
skilled work: 2003Percentage of young people living in single-parent family structures, aged 11, 13 and 15: 2001
0.285 0.59 0.356 -0.310 0.035
Percentage of young people living in step family structure, aged 11, 13 and 15: 2001
0.504 0.355 0.358 -0.264 -0.058
Percentage of students whose parents eat their main meal with them around a table several times a week, aged 15: 2000
0.281 -0.034 -0.654 0.225 0.355
Percentage of students whose parents spend time just talking to them several times per week, aged 15: 2000
0.017 0.202 -0.231 0.247 -0.435
Percentage of young people finding their peers
‘kind and helpful’, aged 11, 13 and 15: 2001 0.334 -0.233 -0.14 -0.447 0.371
Percentage smoking cigarettes at least once per week, aged 11, 13, 15: 2001
0.155 0.296 -0.147 0.121 0.135
Percentage of young people who have been drunk two or more times, aged 11, 13, 15: 2001
0.413 0.592 0.327 -0.22 0.014
Percentage of young people who have used cannabis in the last 12 months, aged 15: 2001
0.304 -0.224 0.307 0.282 -0.04
Adolescent fertility rate, births per 1000 women aged 15-19: 2003.
-0.491 0.55 0.571 -0.078 -0.071
Percentage of young people who have had sexual intercourse, aged 15: 2001
0.487 -0.215 0.407 -0.213 -0.053
Percentage of young people who used a condom during their last sexual intercourse, aged 15: 2001
-0.575 -0.32 -0.082 0.225 0.154
Percentage of young people involved in physical fighting in previous 12 months, aged 11, 13, 15: 2001
-0.444 0.379 0.008 0.357 -0.149
Percentage of young people who were bullied at least once in the last 2 months, aged 11, 13, 15: 2001
-0.245 0.471 0.138 -0.179 0.691
Percentage of young people who eat fruit every day, aged 11, 13, 15 years: 2001
-0.449 -0.568 -0.114 0.173 -0.02
Percentage of young people who eat breakfast every school day, aged 11, 13, 15 years: 2001
0.376 0.378 -0.438 -0.134 0.325
Mean number of days when young people are physically active for one hour or more of the previous /typical week, aged 11, 13, 15: 2001
0.048 0.139 0.581 0.119 -0.202
Percentage of young people who are overweight according to BMI, aged 13 and 15: 2001
-0.126 -0.429 0.488 0.249 -0.288
Percentage of young people rating their health as
‘fair or poor’, aged 11, 13 and 15: 2001 -0.128 0.731 0.183 0.056 0.310
Percentage of young people with scores above the middle of the life satisfaction scale, aged 11, 13 and 15: 2001
0.275 -0.774 -0.013 -0.146 -0.192
Percentage of students who agree with the
statement ‘I feel like an outsider or left out of things’, aged 15: 2003
0.249 0.27 0.169 0.503 -0.183
Percentage of students who agree with the
statement ‘I feel awkward and out of place’, aged
15: 2003
0.341 0.055 -0.019 0.514 0.585
Percentage of students who agree with the
statement ‘I feel lonely’, aged 15: 2003 0.161 0.084 0.039 0.617 0.365 Percentage of young people ‘liking school a lot’,
aged 11, 13, 15: 2001
-0.183 -0.235 0.069 0.041 0.462
29
ADDITIONAL ECONOMETRIC AND POLITOMETRIC APPENDICES
WITH FURTHER MATERIALS ON THE SUBJECT AND ON THE
METHODOLOGY
[image:30.595.47.539.254.685.2]I. REDUCING OVERALL POVERTY
Table 1a: Reducing poverty
–
OECD countries
Social expenditures
Poverty rate before social
transfers
Poverty rate after social
transfers
Reduction of poverty through
social transfers
To lift out 1% of people out of poverty, it is necessary to spend …
% of GDP
Spain 20,3 25 21 4 5,08
Mexico 6,8 27,2 25,3 1,9 3,58
Finland 22,5 22 14,8 7,2 3,13
Switzerland 20,5 23 15,2 7,8 2,63
New Zealand 18 29,8 22,7 7,1 2,54
Korea 5,7 23,1 20,8 2,3 2,48
United States 16,2 31 23,9 7,1 2,28
Denmark 27,6 26 12,3 13,7 2,01
Austria 26,1 27,6 13,4 14,2 1,84
Portugal 23,5 33,8 20,7 13,1 1,79
Japan 17,7 30,9 20,8 10,1 1,75
Norway 25,1 27 12,4 14,6 1,72
Sweden 31,3 29,8 11,4 18,4 1,70
Iceland 18,7 24,7 12,3 12,4 1,51
Ireland 15,9 33,9 23,3 10,6 1,50
Netherlands 20,7 28,6 14,4 14,2 1,46
Australia 17,9 32,6 20,3 12,3 1,46
United Kingdom 20,6 29,8 15,5 14,3 1,44
France 28,7 34,1 14,1 20 1,44
Germany 27,3 36,4 17,2 19,2 1,42
Belgium 26,5 34,9 16,2 18,7 1,42
Italy 24,2 37,6 19,7 17,9 1,35
30
Poland 22,9 41,9 20,8 21,1 1,09
Hungary 22,7 33,6 12,3 21,3 1,07
Luxembourg 22,2 34,4 13,2 21,2 1,05
Czech Republic 21,1 31,7 11,5 20,2 1,04
Slovak Republic 17,3 31,9 13,7 18,2 0,95
Source: our own calculations from Eurostat and OECD.stats, Microsoft EXCEL and SPSS XIV
Graph 1a: social expenditures and reducing poverty
–
OECD countries
0 5 10 15 20 25 30 35 40 45 Hu n g ar y L u x em b o u rg P o lan d C ze ch R ep u b li c F ra n ce Ge rm an y Gr ee ce B elg iu m S we d en S lo v ak R ep u b li c Italy No rwa y Un it ed Kin g d o m Au str ia Ne th er lan d s De n m ar k P o rtu g al Ic elan d Au str ali a Ir elan d Ja p an S witze rlan d F in lan d Ne w Z ea lan d Un it ed S tate s S p ain Ko re a M ex ico
social spending rate
poverty before social transfers
poverty after social transfers
reduction of poverty by social transfers
31
Table 1b: Efficiency parameters of the reduction of poverty
–
a regression analytical approach
–
OECD countries
Column 1
Column 2
Column 3
Column 4
Column 5
Column 6
Column 7
Column 8
Column 9
32
Column 1 Social expenditures OECD stats
Column 2 Poverty rate before social transfers OECD stats
Column 3 Poverty rate after social transfers OECD stats
Column 4 Reduction of poverty through social transfers simple algebraic substraction, based on OECD stats data: Column 2 - Column 3 Column 5 To lift out 1% of people out of poverty, it is necessary to spend … % of GDP simple algebraic calculation,
based on OECD stats: Column 1:Column 4
Column 6 Trend value: poverty after social transfers, as statistically predicted by poverty rates before social transfers
linear trend values EXCEL regression on OECD stats data: poverty before social transfers (x)->poverty after social transfers (y)
Column 7 residual from this regression ("poverty too large in comparison to what one could expect from our knowledge about poverty before social transfers")
subtraction of poverty after social transfers data (Column 3) from predicted value (Column 6) Column 8 analytical measure of poverty reduction (regression residual * -1) simple multiplication of column 7
by (-1) Column 9 Trend value: poverty reduction (social expenditures->analytical measure poverty
reduction)
linear trend value EXCEL regression based on OECD stats data: Column 1 -> Column 8 Column 10 efficiency of social spending in poverty reduction Column 8 minus Column 9