Munich Personal RePEc Archive
Bulgaria - EU: Dynamics of
Approximation in Export Specialization
Hadjinikolov, Dimitar
University of National and World Economy, Sofia
March 2012
Online at
https://mpra.ub.uni-muenchen.de/48249/
Иvtsronmlieca
Л c o n o m i c
a l t e r n a t i v e s
Issue 1, 2012
The National Audit Office
and the Scope of Performance Audit
Leadership Development at the Largest
CompaniesOperating in Bulgaria
Bulgaria EU: Dynamics of Approximation
in Export Specialization
Stability of the Bulgarian Banking System
Critical Review of Models,
Containing Cultural Levels beyond
the Organizational One
C O N T E N T S :
Articles
The National Audit Office and the Scope of Performance Audit
Valeri Dimitrov 5
Policies and Mechanisms for Leadership Development at the Largest Companies Operating in Bulgaria
Yosif Iliev 27
Bulgaria - EU: Dynamics of Approximation in Export Specialization
Dimitar Hadjinikolov 38
Classical and Modern Approaches to Public
Administration
Polya Katsamunska 74
Researching the Status of Electronic
Services in the Bulgarian Local Administration
Katya Strahilova 82
Critical Review of Models, Containing Cultural Levels beyond the Organizational One
Kiril Dimitrov 98
Guide for Authors 126
Management Aspects of the Business Intelligent Systems Development
Kamelia Stefanova
Dorina Kabakchieva 46
The Crisis in the Real Economy and the Stability of the Bulgarian Banking System
Articles
Bulgaria - EU: Dynamics of
Approximation in Export Specialization
Dimitar Hadjinikolov' Summary:
The article analyses the sectoral spe cialization of Bulgarian exports, making a comparison with the sectoral specialization of the EU as an entity and some of the new member states. It focuses on the question of whether Bulgaria's five years of EU mem bership contributed to the approximation of the export specialization or differences have remained. In case there is an approximation, is it an accidental or an objective process that is observed in the other new EU mem ber states from Central and Eastern Europe that have a similar economic structure? The answer is sought by using the index of export specialization. This index is calculated on the basis of the product groups, selected by the author in compliance with the Standard Inter national Trade Classification. Moreover, the aggregate sectoral index deviations are com pared by countries. Based on the compara tive analysis, conclusions are made about the current situation of Bulgaria's export spe cialization and about the factors that impact the approximation process of the export spe cialization of the EU member states.
Key words: export specialization, inter national trade, Bulgaria, European Union.
JEL: F13, F14, F15.
Introduction
N
owadays the global economy is characterized by the inclusion of an increasing number of newer "players" in the conditions of an intensifying market competition. Prospects for success have only the companies that are sufficiently big as economic agents to create the neces sary conditions for competitive production on a global scale. Such economic forma tions seem to be the United States, China, Japan, some other big national economies as well as the European Union, which aims to achieve competitiveness by ensuring greater cohesion1.Viewed on a global scale, Bulgaria's national economy is a relatively small one. According to the International Monetary Fund, in 2010 the world Gross Domestic Product (GDP) measured in constant prices and adjusted by purchasing power parity stood at USD 74,385 billion, while that of Bulgaria to USD 97 billion, which means that the domestic economy accounted for only about 0.13 % of the global economy2.
' Dimitar Hadjinikolov is a D.Sc., professor at the International Economic Relations and Business Department of UNWE,
zyxwvutsrqponmlkjihgfedcbaVUTSRPMIHFEDCBA
e-mail: dimitarh @abv.bg1
See: Global Europe, Competing in the World, A Contribution to the EU's Growth and Jobs Strategy, European Commission, DG "External Trade", Brussels, 2006.
2
International Monetary Fund, World Economic Outlook Database, http://www.imf.org
Articles
In the same year, according to the World Trade Organization, global exports amount ed to USD 15,237 billion (current prices), while the Bulgarian exports stood at about USD 21 billion, so the country's share in world exports was 0.135 %A
In other words, both as an economy and as a trade "player" Bulgaria is too small a coun try to be able to create the necessary "start ing positions" from which firms can achieve global competitiveness. Obviously, such com petitiveness can be achieved only through the European Union and through the EU Com
mon Commercial Policy. This was also one of the reasons why Bulgaria orientated towards the European Union, which is a significantly relevant factor in global trade. By comparison, using the same statistical sources, in 2010 the EU accounted for about 20.4 % of the world GDP and about 34 % of the world exports (in cluding trade within the EU).
1. Formulation of the problem
For a member state economy to be able to gain full benefits from the EU's positions in global trade, it is necessary that this
Яд. 1 Commodity Structure of Bulgarian and EU Exports in 2006 and 2010 (by Commodity Sections of SITC). Source:
yxwvutsrponmlihgfedcbaWUTSONIFC
Compiled by author, using data of WTO Statistics database, www.wto.orgNotes: Commodity sections of Standard International Trade Classification - SITC: 0- Foods and live ani-mals; 1 - Non-alcoholic and alcoholic beverages and tobacco; 2 - Unprocessed (crude) materials, inedible (fuel excluded); 3 - Mineral fuels, lubricants and related products; 4 Fats, oils and waxes of animal or vegetable origin; 5 Chemicals and related products; 6 Items classified chiefly by material type (includ ing metals); 7 Machinery, equipment and vehicles; 8 Miscellaneous manufactured articles (other than those mentioned above, incl. Textiles and clothing); 9 Other commodities and transactions.
3
Articles
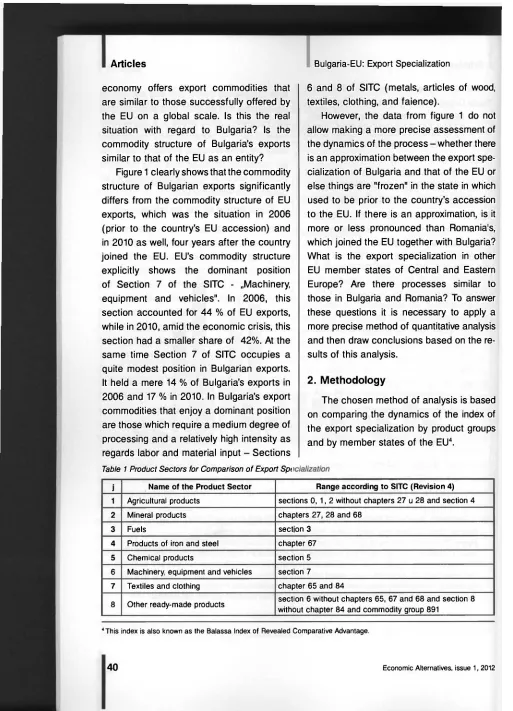
[image:6.612.56.569.38.749.2]economy offers export commodities that are similar to those successfully offered by the EU on a global scale. Is this the real situation with regard to Bulgaria? Is the commodity structure of Bulgaria's exports similar to that of the EU as an entity?
Figure 1 clearly shows that the commodity structure of Bulgarian exports significantly differs from the commodity structure of EU exports, which was the situation in 2006 (prior to the country's EU accession) and in 2010 as well, four years after the country joined the EU. EU's commodity structure explicitly shows the dominant position of Section 7 of the SITC „Machinery, equipment and vehicles". In 2006, this section accounted for 44 % of EU exports, while in 2010, amid the economic crisis, this section had a smaller share of 42%. At the same time Section 7 of SITC occupies a quite modest position in Bulgarian exports. It held a mere 14 % of Bulgaria's exports in 2006 and 17 % in 2010. In Bulgaria's export commodities that enjoy a dominant position are those which require a medium degree of processing and a relatively high intensity as regards labor and material input Sections
Table 1 Product Sectors for Comparison of Export Spt
BulgariaEU: Export Specialization
6 and 8 of SITC (metals, articles of wood, textiles, clothing, and faience).
However, the data from figure 1 do not allow making a more precise assessment of the dynamics of the process whether there is an approximation between the export spe cialization of Bulgaria and that of the EU or else things are "frozen" in the state in which used to be prior to the country's accession to the EU. If there is an approximation, is it more or less pronounced than Romania's, which joined the EU together with Bulgaria? What is the export specialization in other EU member states of Central and Eastern Europe? Are there processes similar to those in Bulgaria and Romania? To answer these questions it is necessary to apply a more precise method of quantitative analysis and then draw conclusions based on the re sults of this analysis.
2. Methodology
The chosen method of analysis is based on comparing the dynamics of the index of the export specialization by product groups and by member states of the EU4.
i Name of the Product Sector Range according to SITC (Revision 4) 1 Agricultural products sections 0, 1, 2 without chapters 27 u 28 and section 4
2 Mineral products chapters 27, 28 and 68
3 Fuels section 3
4 Products of iron and steel chapter 67
5 Chemical products section 5
6 Machinery, equipment and vehicles section 7
7 Textiles and clothing chapter 65 and 84
8 Other readymade products section 6 without chapters 65, 67 and 68 and section 8 without chapter 84 and commodity group 891
4 This index is also known as the Balassa Index of Revealed Comparative Advantage.
Articles Firstly, the product sectors (groups) for calculating the indexes are identified by using the product sections of the SITC. These sections are grouped to arrive at products with similar parameters, which for historical reasons have been categorized in different product sections. The second step is to select the member states which are to be compared. In this case Bulgaria and Romania have been chosen as countries that joined the EU at the same time in 2007, as well as another two countries that joined the union earlier, but have a similar economic structure and level of economic development Hungary and Slovakia. The third step is to identify the time limits within which the comparison is to be made. Since the goal is to see whether the accession to the EU and thus to the EU Common Commercial Policy has an impact on the trade specialization of the acceding states, four periods have been identified: 2003 as the last year prior to the accession of Hungary and Slovakia to the EU; 2006 as the last year before Bulgaria and Romania joined the EU; 2008 a year of economic growth in Central and Eastern Europe; and 2010 a year of economic crisis and also the last year in which the World Trade Organization published the required statistical data. Then follows the fifth step the index of the export specialization of the four coun tries has been calculated by the identified 8 product sectors (Table 1) during the se lected four periods 2003, 2006, 2008 and 2010. The formula used is: 5 WTO Statistics database, www.wto.org V r c ES
'i = ( D
where ES.. is the export specialization of the country /' regarding the product sector /; X.. is the exports of the country / by product sector /; Xwj is the world exports by product
sector /; M.. is the imports of the country /' by product sector j, Mwj is the world imports
by product sector j. However, to obtain a more synthesized result exposing the differences in the export specialization which give a true picture of the economy of each member state, an additional sixth step is taken in which the absolute values of differences between the member states' individual sectoral indexes and the EU export specialization are calculated. The next last seventh step comprises summarizing the absolute values of the differences by member states, by using the following formula:
DES,= E | ( E S . . E S J | (2) where DES. is the aggregate deviation of the export specialization of the country /; ES.. is the export specialization of the coun try i regarding the product sector /; ESeuj is
the export specialization of the European Union regarding the product sector j.
Articles 3. Results
After applying the abovementioned 7 steps, the following results have been obtained reveal
BulgariaEU: Export Specialization
ing the absolute values of differences between the individual sectoral indices of member states and the EU sectoral indices, listed in Table 2 and 3.
Table 2 Absolute Values of Deviations of Export Indices of Bulgaria and Romania from That of the EU (by Product Sectors)
Bulgaria (BG) Romania (RO)
J* 2003 2006 2008 2010 2003 2006 2008 2010 1 0.34832 0.15405 0.12411 0.40191 0.38352 0.30909 0.36952 0.08095 2 0.62101 0.78766 0.63241 0.79798 0.57413 0.50506 0.23627 0.43649 3 0.60459 1.21743 0.02367 0.05182 0.00804 0.03933 0.00174 0.02639 4 0.69048 0.11551 0.41808 0.34575 0.56853 0.10625 0.24194 0.17817 5 0.68259 0.72299 0.61846 0.64574 0.87411 0.85542 0.84898 0.84402 6 0.76760 0.80079 0.81392 0.52584 0.55097 0.55979 0.53775 0.14784 7 0.45109 0.57993 0.58914 0.60894 0.52598 0.56837 0.34024 0.39912 8 0.28276 0.40566 0.47646 0.18710 0.23032 0.38033 0.42013 0.22958
DES 4.44845 4.78401 3.69626 3.56507 3.71561 3.32364 2.99657 2.34255
' Product sectors are indicated in Table 1
Table 3 Absolute Values of Index Deviations of Export Specialization of Hungary and Slovakia from That of the
EU (by Product Sectors)
Hungary (HU) Slovakia (SK)
r 2003 2006 2008 2010 2003 2006 2008 2010
1 0.69149 0.18799 0.47649 0.47693 0.19712 0.07572 0.21696 0.24029
2
0.02652 0.02052 0.16739 0.12396 0.02785 0.24433 0.02192 0.08330
3 0.19862 0.27834
0.15115 0.16030 0.03780 0.03395 0.04794 0.06300
4 0.63340 0.50160 0.49628 0.51769 1.79024 0.88004 0.58457 0.62478
5 0.55035 0.34328 0.31538 0.26271 0.70904 0.61557
0.63752 0.64682
6
0.00090 0.09466 0.12127 0.20809 0.05975 0.07974 0.09146 0.15870
7 0.15747 0.08466 0.00172 0.11879
0.23674 0.24994 0.20338 0.15600
8 0.33631 0.12778 0.05464 0.10156 0.00189 0.20444 0.06587 0.01179 DES 2.59505
1.63883 1.78432 1.97003 3.06044 2.38372 1.86963 1.98468
' Product sectors are indicated in Table 1
Articles
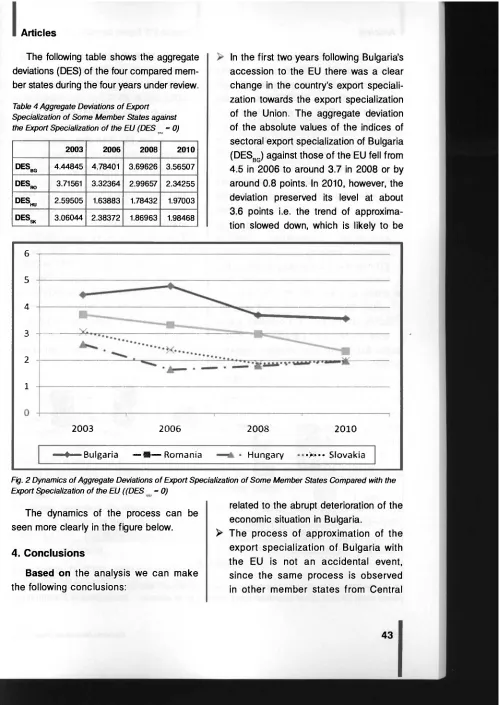
[image:9.612.56.555.41.746.2]The following table shows the aggregate deviations (DES) of the four compared mem ber states during the four years under review.
Table 4 Aggregate Deviations of Export Specialization of Some Member States against the Export Specialization of the EU (DES = 0)
2003 2006 2008 2010
D E S
BG 4.44845 4.78401 3.69626 3.56507 DESPO 3.71561 3.32364 2.99657 2.34255
D E
SH U 2.59505 1.63883 1.78432 1.97003 DESSK 3.06044 2.38372 1.86963 1.98468
In the first two years following Bulgaria's accession to the EU there was a clear change in the country's export speciali zation towards the export specialization of the Union. The aggregate deviation of the absolute values of the indices of sectoral export specialization of Bulgaria (DESbg) against those of the EU fell from
4.5 in 2006 to around 3.7 in 2008 or by around 0.8 points. In 2010, however, the deviation preserved its level at about 3.6 points i.e. the trend of approxima tion slowed down, which is likely to be
6
5
4
3
2
1
2003 2006 2008
2010
• Bulgaria 3 Romania Hungary •>••• Slovakia
Fig. 2 Dynamics of Aggregate Deviations of Export Specialization of Some Member States Compared with the Export Specialization of the EU ((DES = 0)
The dynamics of the process can be seen more clearly in the figure below.
4. Conclusions
Based on the analysis we can make
the following conclusions:
related to the abrupt deterioration of the economic situation in Bulgaria.
Articles BulgariaEU: Export Specialization
and Eastern Europe which are the subject of this analysis. In comparing the data for Romania, for example, we can see that in 2008 the aggregate deviation (DESR0) was about 0.5
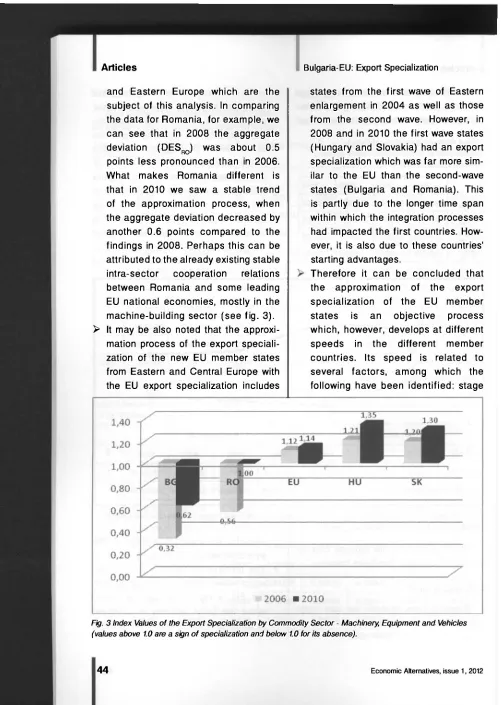
points less pronounced than in 2006. What makes Romania different is that in 2010 we saw a stable trend of the approximation process, when the aggregate deviation decreased by another 0.6 points compared to the findings in 2008. Perhaps this can be attributed to the already existing stable intrasector cooperation relations between Romania and some leading EU national economies, mostly in the machinebuilding sector (see fig. 3).
> It may be also noted that the approxi mation process of the export speciali zation of the new EU member states from Eastern and Central Europe with the EU export specialization includes
states from the first wave of Eastern enlargement in 2004 as well as those from the second wave. However, in 2008 and in 2010 the first wave states (Hungary and Slovakia) had an export specialization which was far more sim ilar to the EU than the secondwave states (Bulgaria and Romania). This is partly due to the longer time span within which the integration processes had impacted the first countries. How ever, it is also due to these countries' starting advantages.
[image:10.612.58.559.38.743.2]Therefore it can be concluded that the approximation of the export specialization of the EU member states is an objective process which, however, develops at different speeds in the different member countries. Its speed is related to several factors, among which the following have been identified: stage
Fig. 3 Index Values of the Export Specialization by Commodity Sector - Machinery, Equipment and Vehicles
(values above 1.0 are a sign of specialization and below 1.0 for its absence).