Munich Personal RePEc Archive
Disentangling water usage in the
European Union: A decomposition
analysis
Valeria, Di Cosmo and Marie, Hyland and Maria, LLop
Economic and Social Research Institute and Trinity College, Dublin,
Economic and Social Research Institute and Trinity College, Dublin,
Universitat Rovira i Virgili and CREIP, Reus
15 November 2012
Online at
https://mpra.ub.uni-muenchen.de/42865/
1
Disent angling w at er usage in t he European Union: A
decomposit ion analysis
Valeria Di Cosmo,
abM arie Hyland,
abM aria Llop
c*a
Econom ic and Social Research Inst it ut e, Dublin
b
Trinit y College Dublin
c
Universit at Rovira i Virgili and CREIP, Reus, Barcelona
* Corresponding aut hor: Whit aker Square, Sir John Rogerson’s Quay, Dublin 2. Em ail: valeria.dicosm [email protected]. Tel: +353 1 863 2033.
M aria Llop acknow ledges funding by t he Spanish M inist ry of Educat ion and Cult ure (grant ECO2010-17728)
and t he Cat alan Governm ent (grant s SGR2009-322 and “ RDI Reference Netw ork in Econom ics and Public Policies” ).
The usual disclaim er applies.
Abstract
The Wat er Framew ork Directive defines com m on objectives for w at er resources t hroughout t he European Union (EU). Given t his general approach t o w at er preservation and w at er policy, t he objective of t his paper is t o analyse w het her com m on pat t erns of w at er consum ption exist wit hin Europe. In particular, our st udy uses t w o m et hods t o reveal t he reasons behind sect oral w ater use in all EU count ries. The first m et hod is based on an account ing indicat or t hat calculat es t he w at er int ensit y of an econom y as t he sum of sect oral w ater int ensities. The second met hod is a subsyst em input -out put m odel t hat divides t ot al w at er use int o different incom e channels w it hin t he product ion syst em. The applicat ion uses dat a from t he year 2005 on w at er consum ption in t he product ion syst em of t he 27 countries of t he EU.
From our analysis it emerges t hat EU count ries are charact erized by very different pat terns of w ater consum ption. M edit erranean and central/ east ern European countries use w ater m ainly for agricult ure w hereas nort hern European count ries use it m ainly for electricit y, gas and w at er supply.
In m ost count ries, t he w at er used by t he fuel, pow er and w at er sect or is consum ed t o sat isfy dom est ic final
dem and. However, our analysis show s t hat for some count ries export s from t his sect or are an im port ant driver of w at er consum ption. Focusing on t he agricult ural sect or, t he decomposit ion analysis suggest s t hat wat er
usage in M editerranean countries is m ainly driven by final dem and for, and export s of, agricult ural product s, w hereas dom est ic final dem and is t he m ain driver of w at er consum ption in cent ral/ east ern European count ries.
Given t hese heterogeneous w at er consum pt ion patt erns, our analysis suggest s t hat M edit erranean and cent ral/ east ern European countries should adopt specific wat er policies if w ater consum pt ion in t he European Union is t o be efficient.
JEL codes: N5; C67
2
1. I ntr oduction
The European Wat er Fram ew ork Direct ive (WFD) (2000/ 60EC) prescribes t hat “M ember St at es shall t ake account of t he principle of recovery of t he cost s of w at er services, including environment al and resource cost s, having regard t o t he economic analysis and in accordance in part icular w it h the pollut er pays principle” .1 The idea behind t his Direct ive is t hat w at er is a scarce com m odit y in Europe and it is at t ribut ed wit h social, ecological and cult ural values. If t hese values are t o be t aken int o account , t he price of w at er should reflect not only t he scarcit y and cost of use but also t he ext ernalit ies generat ed. Since t hese object ives are com m on t o all European Union (EU) m em bers, it is crucial t o det erm ine w het her pat t erns of w at er usage are also com m on t o t he 27 EU count ries and w hat t he m ain drivers of w at er usage are in each st at e. Only in t his w ay can t he policies t hat encourage w at er saving schem es be successful at t he European level.
The m ain aim of t his paper is t o ident ify t he pat t erns of w at er usage in all t he count ries of t he European Union. Specifically, w e invest igat e t he channels t hrough w hich w at er is used w it hin t he product ion syst em of t he 27 EU count ries. Our analysis is based on t w o different met hods for invest igat ing w at er consum pt ion. The first one adopt s an account ing perspect ive and uses m acro-indicat ors of bot h sect oral w at er use and sect oral product ion. This met hod allows us t o ident ify t he
m ost w at er-int ensive sect ors in European count ries, and t he relat ive cont ribut ion of t hese sect ors t o each count ry’s GDP. The second m et hod is based on a subsyst em input -out put m et hodology, w hich reflect s t he different incom e channels t hat explain w at er consum pt ion w it hin t he product ion syst em .
To dat e only a few m ult i-count ry analyses of w at er usage have been m ade. M oreover, t o our know ledge, t he lit erat ure does not cont ain a single com plet e analysis of sect oral w at er use for all EU count ries. By exam ining w at er consum pt ion pat t erns for all count ries in t he EU and across 35
product ion sect ors, our st udy m akes an im port ant cont ribut ion t o t he int ernat ional lit erat ure on virt ual w at er consum pt ion. Our analysis provides new and valuable inform at ion w hich could be useful in t he process of defining and im plem enting a new com m on w at er policy in line w it h t he EU’s Wat er Fram ew ork Direct ive.
Several papers have used an input -out put fram ew ork t o analyse pat t erns of w at er consum pt ion from a single-count ry perspect ive. For exam ple, Lenzen and Foran (2001) const ruct ed an input-out put m odel based on m ult ipliers for Aust ralia. They found t hat t he product ion of food t o sat isfy
dom est ic dem and account ed for 30% of w at er consum pt ion and, sim ilarly, export ed goods account ed for 30% of w at er consum pt ion. Their analysis also show ed t hat Aust ralia export ed subst ant ially m ore virt ual w at er t han it im port ed.
Diet zenbacher and Velázquez (2007) used an input-out put fram ew ork t o analyse t he consum pt ion of w at er in t he Andalusian product ion process. They also analysed how m uch virt ual wat er – i.e. t he am ount of w at er used t o produce goods and services, including t he w at er used t o sat isfy int erm ediat e dem and – w as em bodied in t rade. The Andalusian agricult ural sect or w as responsible
for 90% of direct w at er consum pt ion, but cont ribut ed only 8% t o t he Gross Regional Product . Addit ionally, m ore t han half of t he final out put of t he agricult ural sect or w as export ed t o t he rest of Spain, t he EU and t he rest of t he w orld. The aut hors highlight ed t hat as Andalusia is a relat ively arid
1
The Directive is available here: ht t p:/ /
3 region, t heir result s cont radict ed t he Hecksher-Ohlin t heory w hich st at es t hat count ries (or regions) should specialise in t he product ion of goods t hat use input s w hich are relat ively abundant in t hat count ry/ region.
Guan and Hubacek (2007) used a regional input-out put m odel for eight regions in China t o analyse pat t erns of regional t rade and t he flow of virt ual w at er. They not ed t hat w hile t he nort hern part of
China had only one-fift h of t he w at er resources, it w as support ing m ore t han half of t he populat ion. The aut hors const ruct ed t w o regional input -out put t ables for Nort h and Sout h China, and supplem ent ed t hese wit h dat a on int erregional t rade flow s. They not ed t hat w hile nort hern China had few er w at er resources, it w as a net export er of virt ual w at er; t hey also not ed t hat sout hern China w as a net im port er. These result s are yet anot her cont radict ion of t he Hecksher-Ohlin t heory. The aut hors also st at ed t hat w at er scarcit y in nort hern China is becom ing a barrier t o furt her
econom ic development . To conclude, t he aut hors remarked t hat direct and indirect w at er usage w as not sufficient ly t aken int o account in consum pt ion and product ion decisions, w hich can lead t o t he unsust ainable use of w at er resources.
Zhao et al. (2009) used an input -out put fram ew ork t o calculat e t he nat ional w at er foot print for China, w hich illust rat ed t he w at er used direct ly and indirect ly t o sat isfy final dem and, including dem and for export s. The aut hors highlight ed t he advant age of using t his nat ional w at er foot print indicat or as it m at ches t he use of w at er, an im port resource, t o consum pt ion, w hich m ay be a bet t er
t ool for alt ering w at er consum pt ion pat t erns. They also highlight ed t he im port ance of virt ual w at er and not ed t hat it should be im port ed from relat ively wat er-abundant count ries if w at er securit y is t o be achieved.
Int ernat ional st udies include Hoeskst ra and Hung (2002), w ho calculat ed t he flow s of virt ual w at er (alt hough not w it hin an input-out put fram ew ork) in relat ion t o crop t rade bet w een nat ions in t he period 1995–1999 and found t hat t he m ain virt ual wat er export ers are t he US, Canada, Thailand, Argent ina and India, w hile Sri Lanka, Japan, t he Net herlands and China are t he main w at er
im port ers. One short com ing of t his st udy is t hat it only t akes crop product ion int o account , and not t he ent ire product ion syst em .
Wit hin t he input -out put fram ew ork, an individual sect or, or group of sect ors, can be regarded as a subsyst em w hich int eract s w it h t he ot her sect ors. This approach isolat es t he relat ions of a limit ed num ber of act ivit ies from t he w hole syst em , and show s t he part icular pat t erns of individual unit s as part of t he ent ire product ion sphere. The subsyst em s (econom ic) m odel w as originally proposed by
Sraffa (1960), Pasinet t i (1973, 1988), Deprez (1990) and Scazzieri (1990) am ong ot hers. Subsequent ly, t his m et hod w as ext ended t o t he analysis of pollut ant em issions.2 How ever, as far as w e are aw are, t he subsyst em m odel has not been applied t o w at er usage in t he product ion syst em .
Our analysis show s t hat European count ries are charact erized by very different w at er usage pat t erns. In part icular, agricult ure is t he m ost w at er-int ensive sect or in bot h cent ral/ east ern and
2
4 M edit erranean European count ries; w hereas t he elect ricit y, gas and w at er supply sect or is t he m ost w at er-int ensive sect or in Nort hern European count ries.
Focusing on t he agricult ural sect or, our result s also show t hat in cent ral/ east ern European count ries t he cont ribut ion of agricult ure t o each count ry’s out put is relat ively high (5% of t he GDP on average). The w at er int ensit y in t hese count ries is also above t he EU m ean. How ever, by applying
t he input -out put m et hodology w e find t hat t he w at er used in t he agricult ural sect or of t he cent ral/ east ern European count ries is m ainly dest ined for dom est ic consum pt ion. Therefore, specific policies, orient ed t o w at er dem and, should be applied in order t o influence final consum pt ion and t hus encourage w at er savings in t hese count ries.
The subsyst em input -out put analysis show s t hat in som e of t he M edit erranean count ries m ost of t he w at er used in agricult ure is export ed t hrough agricult ural goods (i.e., em bodied w at er). Therefore, in order t o achieve a m ore sust ainable product ion st ruct ure and enhance w at er savings, an appropriat e
t ariff for w at er should be set in t hese count ries.
The rest of t he paper is organised as follow s. Sect ion 2 describes t he dat abase used in t he analysis and Sect ion 3 present s t he t w o m et hods used t o decom pose sect oral w at er usage. Sect ion 4 cont ains t he result s of t he em pirical applicat ion t o t he 27 European count ries. At t he end of t he paper w e provide som e concluding rem arks.
2. Data
The w at er use dat a and t he input out put t ables used in our analysis are from t he World Input -Out put Dat abase (WIOD: w w w .w iod.org). This dat abase cont ains Input-Out put t ables and environm ent al account s (w hich includes w at er usage) for 27 EU count ries and 13 ot her count ries in t he w orld bet w een 1995 and 2009. The Input-Out put t ables and t he w at er use dat a are present ed at a 35-sect or level of aggregat ion.3 While dat a are available for all years up unt il 2009, w e have chosen t o focus on 2005 in our analysis so t hat w e could analyse pat t erns of w at er use and economic
act ivit y t hat w ere not being affect ed by t he current period of econom ic recession, w hich m ay m ask t he st ruct ural feat ures of w at er use. Our analysis focuses on t he 27 count ries w ithin t he EU.
The w at er use dat a present ed in t he WIOD divides wat er use, in t housands of m3, int o blue, green and grey w at er. Blue w at er is w at er draw n from surface and ground w at er; green w at er is rainw at er absorbed in soil; and grey w at er is w at er w hich is used t o dilut e pollut ant s. In our analysis w e focus on t he use of blue and green w at er (not e how ever t hat green w at er is consum ed only by t he
agricult ural sect or). In m any count ries a large port ion of t ot al grey w at er is consum ed by privat e households. As w e focus on t he product ive sect ors of t he econom y in our analysis w e ignore t he use of grey w at er.
There are a num ber of dat a caveat s in t he WIOD. Wat er use dat a for cert ain sect ors is report ed as zero even t hough it is unlikely t hat no w at er was used (for exam ple, in t he elect ricit y, gas and w at er
supply sect or in bot h M alt a and Cyprus). Det ails of t he m et hodologies and dat a sources used t o const ruct t he econom ic t ables and t he environm ent al account s can be found in Gent y et al (2012) and Tim m er et al (2012); in part icular furt her dat a caveat s are discussed by Tim m er et al (2012).
3
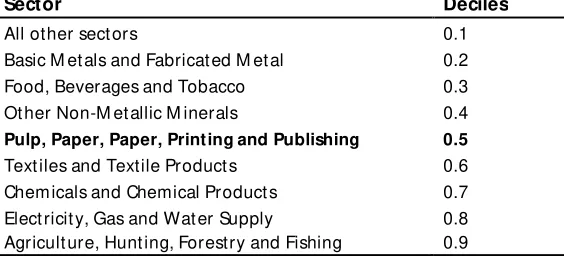
5 The WIOD gives input -out put and w at er use t ables for 35 product ive sect ors alt hough t he vast m ajorit y of w at er used in an econom y is in fact concent rat ed in a sm all num ber of sect ors. Thus, in our analysis w e have chosen t o focus on t he sect ors above t he EU m edian in t erm s of w at er consum pt ion; t hese are t he Agricult ure, Hunt ing, Forest ry and Fishing sect or; t he Food, Beverages and Tobacco sect or; t he Chem icals and Chemical Product s sect or; and t he Elect ricit y, Gas and Wat er Supply sect or (see t able 1). Toget her t hese sect ors account for, on average, 99% of w at er used in
[image:6.595.70.352.245.373.2]product ion in t he EU.
Table 1: Sect ors by w at er int ensit y (1000m3 per m illion USD): EU, 2005*
Sector Deciles
All other sect ors 0.1 Basic M et als and Fabricat ed M et al 0.2 Food, Beverages and Tobacco 0.3 Ot her Non-M et allic M inerals 0.4
Pulp, Paper, Paper, Printing and Publishing 0.5
Text iles and Textile Product s 0.6 Chem icals and Chemical Product s 0.7 Elect ricit y, Gas and Wat er Supply 0.8 Agricult ure, Hunt ing, Forestry and Fishing 0.9 * M edian in bold.
3. Methods
Our analysis can be divided int o t w o part s: first w e use st at ist ical indicat ors t o quant ify t he
im port ance of t he sect oral w at er int ensit y for t he economies of t he EU-27 count ries; second, w e use an input -out put decom posit ion analysis t o find t he m ain drivers of w at er usage for t he sect ors w hich have been ident ified as t he m ost w at er int ensive.
3.1.
Water Intensity Indicator
Various m et hods can be used t o calculat e t he w at er int ensit y of an econom y. In w hat follow s, we dist inguish bet w een t hose sect ors t hat are above t he m edian level of EU w at er int ensit y (j = 1, … , 4) and t he ot her sect ors (r = 5, …, 35). We also distinguish bet w een t he 27 EU count ries (C = 1, … , 27). So, w e use t he follow ing calculat ion: 4
C C r C C j
j jC
C j C C
Y
W
Y
Y
Y
W
Y
W
4 , ,1 ,
,
(1)
The first t erm in Equat ion (1) show s t he w at er int ensit y in t he C-t h count ry considered: w at er
consum pt ion ( ) per GDP ( ) as a funct ion of w at er int ensit y per sect or
C j C j
Y
W
, ,, w here index j
corresponds t o t he econom ic sect ors ident ified previously; agricult ure, food and beverages,
chem icals and elect ricit y, gas and w at er supply.
4
M endiluce et al (2010) proposed a similar m ethod t o m easure energy int ensit y in t he Spanish econom y.
C
6 Also in Equat ion (1), t he t erm
C C j
Y
Y
,m easures how m uch t he j-t h sect or cont ribut es t o t he C-t h
count ry’s GDP. Thus t he indicat or allow s w at er int ensit y t o be decom posed int o sect oral w at er int ensit y and out put int ensit y.
3.2. Input-Output Subsystem Decomposition
Having exam ined t he w at er int ensit y of t he EU count ries, w e t hen use t he det ails of t he product ion st ruct ure of each econom y, as given in t he nat ional input-out put t ables, t o decom pose sect oral w at er use int o different channels w it hin t he product ion syst em . Specifically, w e use a subsyst em input -out put m odel t o analyse t he pat t erns of sect oral w at er consum pt ion.
The subsyst em s approach considers an individual sect or (or a group of sect ors) as a part icular unit
t hat does not m odify t he m ain charact erist ics of t he syst em of w hich it is a part . Taking int o account t hat a subsyst em responds t o t he not ion of an individual sect or or group of sect ors t hat produce a specific com m odit y, an input -out put t able enables sect ors of product ion t o be considered as subsyst em s. In t his paper we separat ely t ake int o account four sect ors of product ion and, for each one, w e apply a subsyst em division of it s w at er use.5 This analysis, w hich decom poses t he w at er use of each sect or int o different sources, ext ends our know ledge about t he w at er consum pt ion wit hin
t he product ion syst em .
The st art ing point of t he subsyst em represent at ion consist s of decom posing t he N account s of an input -out put syst em int o t w o cat egories (M and S), w it h 1, 2, …, m sect ors belonging t o M
subsyst em , and m + 1, …, n, belonging t o t he S subsyst em . If t hese account s are separat ed, t he input -out put represent at ion can be w rit t en as follow s:
, (2)
w here t he subscript s and superscript s denot e t he group of account s M and S, respect ively. In Equat ion (2), m at rices A cont ain t he t echnical input-out put coefficient s, t he colum n vect or
cont ains t he sect oral product ion and t he colum n vect or cont ains t he final
dem and. From Equat ion (2), w e can calculat e sect oral product ion as , w here B
is t he Leont ief inverse m at rix. Using t his definit ion, t he m odel can be w rit t en as:
(3)
Expression (3) cont ains t he follow ing t w o equat ions:6
5
Specifically, w e w ill consider t he four act ivit ies t hat show a level of w at er int ensit y above t he EU m edian (see Table 1).
6
The lit erat ure on input-out put subsyst em s usually assum es t hat t he final dem and in one subsyst em is zero and, accordingly, t his subsyst em is t hought t o only produce for t he int erm ediate dem and (see Alcánt ara and Padilla (2009)). Unlike ot her similar st udies, expression (4) capt ures all t he incom e relations w it hin t he production syst em.
M M M
MM MS
S S S
SM SS
A
A
x
y
x
A
A
x
y
x
M Sx
x
x
M Sy
y
y
1(
)
x
I
A
y
By
M M M
MM MS MM MS
S S S
SM SS SM SS
A
A
B
B
y
y
x
A
A
B
B
y
y
x
7
, (4)
The t w o equat ions in (4) show t he product ion of t he M and S subsyst em s, respect ively. Let us assum e t hat w e are int erest ed in analysing t he S subsyst em . Then, t he int erpret at ion of Equat ion (4) is as follow s: The first equat ion, w hich defines t he t ot al product ion of M, can be divided int o t w o part s. The first , , show s t he effect s of t he final dem and of t he S subsyst em
on t he product ion of M and w e can regard it as an ext ernal component. The rem aining elem ent s in t he first equat ion of (4), show t he product ion of M needed t o cover
it s final dem and.7
The left -hand side of t he second equat ion in expression (4) can be divided int o different com ponent s
t hat convey different econom ic m eaning. The t erm show s t he product ion
of S required t o cover t he final demand of M or t he induced component. The t erm is int erpret ed as an int ernal component t hat show s effect s t hat bot h end in S
and st art from S.Finally, t he last com ponent , , is t he final dem and for t he S subsyst em and can be
divided int o export s final dem and ( ) and dom est ic final dem and ( ):8 .
To t ransform Equat ion (4) int o a w at er-use m odel, w e use t he diagonal m at rices and t hat
cont ain in t he m ain diagonal t he w at er-use coefficient s, calculat ed as t he w at er used (in physical unit s) per unit of t ot al product ion in t he M and S subsyst em s, respect ively. The w at er-use associat ed w it h t he com ponent s of t he S subsyst em is equal t o:
These expressions show t he w at er use explained by t he ext ernal com ponent (ECS) – t he w at er used
in subsyst em M due t o dem and for S; t he induced component (INCS) – t he w at er used in subsyst em S
due t o dem and for M; t he int ernal com ponent (ITCS) – t he w at er used in subsyst em S due t o dem and
for S; t he export level com ponent (EXCS) – t he direct w at er use due t o foreign dem and for S; and t he
dom est ic final dem and com ponent (DCS). The t ot al (direct and indirect ) w at er use (TWS) of t he S
subsyst em can t hen be calculat ed as:
(5)
7
Note t hat if w e are interest ed in t he S subsyst em , t his part of t he M production can be avoided. 8
The dom estic final dem and includes sect oral privat e consum pt ion, public consum pt ion and investm ent .
M
S
M
S M M
MM MM MM MS MS SM MS SS
A
B
y
A
B
y
A
B
y
A
B
y
y
x
M
S
M
S S S
SS SM SS SS SM MM SM MS
A B
y
A B
y
A
B
y
A
B
y
y
x
S
S
MM MS MS SS
A
B
y
A
B
y
M M M
MM MM MS SM
A
B
y
A
B
y
y
M
M
SS SM SM MM
A B
y
A
B
y
S S
SS SS SM MS
A B y
A
B
y
S
y
S X
y
y
SDy
S
y
SX
y
DSM
W WS
(
)
M S
S MM MS MS SS
EC
W
A
B
A
B
y
(
)
S M
S SS SM SM MM
INC
W
A B
A
B
y
(
)
S S
S SS SS SM MS
ITC
W
A B
A
B
y
S X S
S
W
y
EXC
S D S
S
W
y
8
4. Results
The m ain aim of our st udy is t o investigat e w het her a com m on pat t ern em erges in t he w at er usage of t he EU 27 count ries. As t he WFD defines com m on crit eria t o evaluat e t he w at er consum pt ion in different count ries and suggest s t he im plem ent at ion of econom ic analysis t o quant ify t he prices and t he cost s associat ed w it h w at er usage, an analysis of w at er int ensit y in different sect ors and t he
[image:9.595.73.525.235.529.2]drivers of w at er usage in t he w at er-int ensive sect ors for all t he m em ber count ries w ould be an im port ant st ep in helping policy-m akers t o underst and w het her com m on incent ives w ill have parallel effect s in all EU count ries.
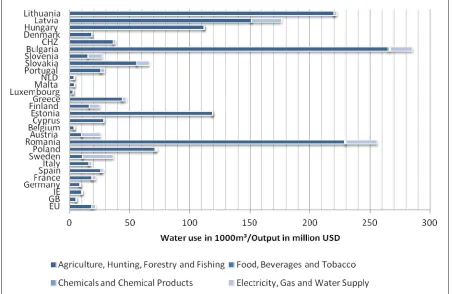
Figure 1: Wat er int ensit y by count ry and by sect or (2005)
Figure 1 show s t he t ot al w at er int ensit y calculat ed by Equat ion (1) in all t he EU 27 count ries. From t his figure w e can see t hat w at er int ensit y is quit e heterogeneous at a nat ional level. It can be seen,
how ever, t hat com m on pat t erns em erge across different groups of count ries. In part icular, t he w at er used in agricult ure is part icularly high for cent ral/ east ern European count ries, such as Rom ania, Lit huania, Bulgaria and Hungary. M oreover, t he w at er used in t he elect ricit y, gas and w at er supply sect or in count ries wit h nuclear pow er plant s (Sw eden, France, Rom ania) is higher t han in ot her countries.
To analyse m ore hom ogeneous t rends in w at er usage bet w een count ries and reduce t he asym m et ric behaviours observed in Figure 1, below w e divide our sam ple int o different sub-regions t o ident ify
9 Belgium , Finland, Luxem bourg, t he Net herlands and Denm ark; t he “ M edit erranean” region is com prised of Spain, It aly, Cyprus, Greece, M alt a and Port ugal; finally “ cent ral/ east ern Europe” refers t o Est onia, Slovakia, Slovenia, Poland, Rom ania, Bulgaria, t he Czech Republic, Hungary, Lat via and Lit huania. Wat er consum pt ion w it hin each group exhibit s broadly similar pat t erns; how ever, our result s show a general het erogeneit y of w at er consum pt ion w it hin t he EU.
4.1 Water Intensity
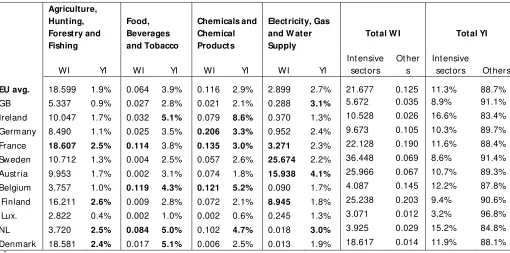
Our aggregat e w at er int ensit y indicat or is com prised of t w o separat e indicat ors; sect oral w at er int ensit y and sect oral out put int ensit y. We find t hat in t he nort hern European count ries, m ost sect ors are below t he EU average for wat er usage relat ive t o t he t ot al out put of t he econom y. How ever, t here are som e except ions: in France t he wat er usage relat ive t o out put is above average in all sect ors, and in Sw eden, Aust ria and Finland w at er int ensit y is above average in t he Elect ricit y, Gas and Wat er supply sect ors. In som e of t hese count ries (for exam ple, Sw eden, Finland and
[image:10.595.68.578.379.632.2]France), t he high levels of w at er int ensit y in t his sect or m ay be due t o t he use of nuclear pow er in elect ricit y generat ion (European Union, 2012), w hich requires t he use of significant am ount s of w at er t o cool t he nuclear react ors and produce st eam (EPA, 2012).
Table 2: Wat er Int ensit y (WI) (1000m3 per m illion USD) and Out put Int ensit y (YI) (sect oral out put as a percent age of t ot al out put ) in nort hern Europe*
Agriculture, Hunting, Forestry and Fishing
Food, Beverages and Tobacco
Chemicals and Chemical Products
Electricity, Gas and W ater Supply
Total W I Total YI
WI YI WI YI WI YI WI YI
Int ensive sect ors
Ot her s
Int ensive
sect ors Ot hers
EU avg. 18.599 1.9% 0.064 3.9% 0.116 2.9% 2.899 2.7% 21.677 0.125 11.3% 88.7% GB 5.337 0.9% 0.027 2.8% 0.021 2.1% 0.288 3.1% 5.672 0.035 8.9% 91.1%
Ireland 10.047 1.7% 0.032 5.1% 0.079 8.6% 0.370 1.3% 10.528 0.026 16.6% 83.4% Germ any 8.490 1.1% 0.025 3.5% 0.206 3.3% 0.952 2.4% 9.673 0.105 10.3% 89.7% France 18.607 2.5% 0.114 3.8% 0.135 3.0% 3.271 2.3% 22.128 0.190 11.6% 88.4% Sw eden 10.712 1.3% 0.004 2.5% 0.057 2.6% 25.674 2.2% 36.448 0.069 8.6% 91.4% Aust ria 9.953 1.7% 0.002 3.1% 0.074 1.8% 15.938 4.1% 25.966 0.067 10.7% 89.3%
Belgium 3.757 1.0% 0.119 4.3% 0.121 5.2% 0.090 1.7% 4.087 0.145 12.2% 87.8% Finland 16.211 2.6% 0.009 2.8% 0.072 2.1% 8.945 1.8% 25.238 0.203 9.4% 90.6% Lux. 2.822 0.4% 0.002 1.0% 0.002 0.6% 0.245 1.3% 3.071 0.012 3.2% 96.8% NL 3.720 2.5% 0.084 5.0% 0.102 4.7% 0.018 3.0% 3.925 0.029 15.2% 84.8%
Denmark 18.581 2.4% 0.017 5.1% 0.006 2.5% 0.013 1.9% 18.617 0.014 11.9% 88.1% *
Figures in bold are t hose w hich are above t he EU average.
A very different pat t ern of w at er int ensit y can be seen in t he M edit erranean and east ern/ cent ral European count ries. Count ries in t hese regions have m uch higher levels of w at er int ensit y in t he
10
Table 3: Wat er int ensit y (WI) and Out put Int ensit y (YI) in M edit erranean Europe*
Agriculture, Hunting, Forestry and Fishing Food, Beverages and Tobacco Chemicals and Chemical Products Electricity, Gas and W ater Supply
Total W I Total YI
WI YI WI YI WI YI WI YI
Int ensive sect ors
Ot her s
Int ensive
sect ors Ot hers
EU avg. 18.599 1.9% 0.064 3.9% 0.116 2.9% 2.899 2.7% 21.677 0.125 11.3% 88.7% Spain 26.088 2.5% 0.023 5.0% 0.077 2.3% 1.988 2.6% 28.176 0.066 12.3% 87.7% It aly 15.841 1.7% 0.052 3.8% 0.046 2.5% 2.542 2.6% 18.481 0.142 10.6% 89.4% Cyprus9 28.420 3.3% 0.004 5.9% 0.000 0.8% 0.000 2.7% 28.424 0.003 12.7% 87.3%
Greece 43.759 4.5% 0.012 5.2% 0.004 1.2% 3.277 2.5% 47.051 0.022 13.3% 86.7% M alt a 3.910 2.4% 0.001 3.5% 0.001 1.4% 0.000 4.8% 3.912 0.001 12.1% 87.9%
Port ugal 25.966 2.7% 0.032 4.6% 0.024 1.6% 3.365 3.8% 29.387 0.153 12.7% 87.3% *
Figures in bold are t hose w hich are above t he EU average.
Table 4: Wat er int ensit y (WI) and Out put Int ensit y (YI) in cent ral/ east ern Europe*
Agriculture, Hunting, Forestry and Fishing Food, Beverages and Tobacco Chemicals and Chemical Products Electricity, Gas and W ater
Supply Total W I Total YI
WI YI WI YI WI YI WI YI
Int ensive sect ors Ot her s Int ensi ve
sect ors Ot hers
EU avg. 18.599 1.9% 0.064 3.9% 0.116 2.9% 2.899 2.7% 21.677 0.125 11.3% 88.7% Est onia 119.083 3.7% 0.022 4.3% 0.001 1.4% 0.179 2.9% 119.285 0.119 12.3% 87.7% Slovakia 55.612 3.4% 0.167 3.3% 0.041 1.6% 10.545 6.8% 66.365 0.132 15.1% 84.9% Slovenia 15.135 2.5% 0.068 3.0% 0.113 3.8% 12.023 2.8% 27.339 0.439 12.0% 88.0% Poland 71.196 4.5% 0.247 6.7% 0.854 2.3% 0.892 3.9% 73.190 0.301 17.4% 82.6% Rom ania 228.571 9.1% 1.061 8.4% 0.073 1.7% 26.278 5.9% 255.983 0.745 25.1% 74.9% Bulgaria 265.078 8.8% 1.137 5.6% 0.994 2.0% 17.789 4.6% 284.997 2.966 21.0% 79.0% Cz. Rep. 36.269 2.5% 0.086 4.4% 0.033 2.1% 1.875 3.8% 38.263 0.147 12.8% 87.2% Hungary 111.93 4.2% 0.132 4.7% 0.085 2.6% 0.216 3.8% 112.363 0.824 15.2% 84.8% Lat via 151.137 4.7% 0.043 5.2% 0.065 0.6% 25.109 3.1% 176.354 0.082 13.7% 86.3%
Lit huania 220.042 5.4% 0.017 6.2% 0.005 1.8% 2.413 4.7% 222.477 0.026 18.1% 81.9% *
Figures in bold are t hose w hich are above t he EU average.
The w at er int ensit y of t he agricult ural sect or relat ive t o t ot al out put is except ionally high in m any of t he cent ral and east ern European count ries (part icularly in Rom ania, Bulgaria and Lit huania). The
food, beverages and t obacco sect or generally has a very low level of w at er int ensit y in all count ries; how ever, it is above average in som e cent ral/ east ern European count ries. In all t he count ries in t he cent ral/ east ern European block, t he cont ribut ion of t he agricult ural sect or t o t ot al out put is above t he EU average of 1.91% and in som e count ries it is w ell above t he EU average (e.g. Bulgaria: 8.8% and Rom ania: 9.1%). How ever, our result s show t hat t hese count ries use w at er at levels t hat are higher t han can be explained by t he relat ive econom ic im port ance of t hese sect ors. In bot h t he
9
[image:11.595.79.586.318.554.2]11 M edit erranean and cent ral/ east ern European count ries, w at er use in t he chemicals and chemical product s sect or is below t he EU average (wit h t he except ion of Bulgaria). On t he ot her hand, in a num ber of t he cent ral/ east ern European count ries, t he elect ricit y, gas and w at er supply sect or consum es w at er at a level w hich is above t he EU average. Again t his m ay be due t he elect ricit y generat ion m ix in t hese count ries, m any of w hich use nuclear and hydro pow er generat ion (European Union, 2012).
4.2 Subsystem Decomposition of Water Usage
Having exam ined t he general pat t erns of sect oral w at er int ensit y in t he EU count ries, w e now run an input -out put subsyst em decom posit ion analysis in order t o get a bet t er underst anding of w hat is driving w at er use in t he different sect ors and count ries.
As show n in Table 1, w e w ill focus on t he four sect ors above t he m edian level of w at er int ensit y in product ion: agricult ure, hunt ing, forest ry and fishing; food, beverages and t obacco; chem icals and chem ical product s; and elect ricit y, gas and w at er supply.
4.2.1 Agriculture, Hunting, Forestry and Fishing
In 2005, t he agricult ural sect or in nort hern Europe w as responsible for 37% of t ot al w at er use by t his sect or w it hin t he EU, and cont ribut ed t o 56% of EU out put from t his sect or. In cent ral and east ern
[image:12.595.74.438.415.672.2]Europe t he agricult ural sect or w as responsible for 34% of EU agricult ural w at er use, and t his region account ed for 16% of EU agricult ural out put . The figures for M edit erranean EU count ries w ere 29% of w at er use and 28% of out put .
Figure 2: Decom posit ion of w at er use in t he agricult ural sect or – nort hern Europe
Figure 3: Decom posit ion of w at er use in t he agricult ural sect or – cent ral/ east ern Europe
0% 20% 40% 60% 80% 100% G. Britain
Ireland Ger many France Sweden Austr ia Belgium Finland Luxembourg Nether lands Denmar k
12
Figure 4: Decom posit ion of w at er use in t he agricult ural sect or – M edit erranean Europe
Figures 2 t o 4 show t hat pat t erns of w at er use differ in the t hree European regions analysed. In all count ries in nort hern Europe, w it h t he except ion of t he Net herlands, t he induced com ponent is t he largest . This reflect s t he fact t hat m any of t he out put s of agricult ural product ion are used as input s in ot her sect ors. Therefore, in nort hern Europe, w hile t he agricult ural sect or uses larger quant it ies of
[image:13.595.74.443.369.545.2]13 Looking at w at er usage pat t erns of agricult ure in cent ral/ east ern Europe (Fig. 3) t he induced com ponent is generally m uch sm aller t han in nort hern European count ries, w hereas t he dem and-level com ponent is m uch higher. This is an indicat ion t hat t he out put of t he agricult ural sect or of count ries in t his region is not generally processed furt her by ot her sect ors before being sold t o final dom est ic consum ers or export ed. Thus, in count ries in t his region, m uch of t he w at er being used by t he agricult ural sect or is being driven by dem and for agricult ural produce. It is also w ort h not ing t hat
t he int ernal com ponent is generally larger for count ries in t his region t han in ot her regions.
The pat t ern of w at er usage in M edit erranean count ries (Fig. 4) is generally less clear. The induced com ponent is largest in Port ugal, Spain and It aly. This show s t hat , like m any count ries in nort hern Europe, w at er is being consum ed in t he agricult ural sect or in order t o produce goods w hich w ill be used t o sat isfy final dem and from ot her sect ors. On t he ot her hand, in Cyprus, Greece and M alt a
m ore w at er is being consum ed t o sat isfy final dem and – bot h for dom est ic consum pt ion and for export . One quit e surprising result is t hat in Spain and M alt a a large quant it y of t he w at er used in t he agricult ural sect or is used t o produce agricult ural goods, w hich are t hen export ed. It seems surprising t hat large quant it ies of em bodied w at er w ould be export ed from count ries in w hich w at er is relat ively scarce.
This result for Spain confirm s t he analysis made by Velázquez (2006). In her w ork, she finds t hat in one of t he m ost arid regions in Europe, Andalusia, a large quant it y of w at er is used by t he
agricult ural sect or t o export it s product s. Our input-out put analysis highlight s how export s and final dem and are t he m ain drivers of w at er int ensive product ion in som e arid count ries; as a result , incent ives t o encourage t he responsible usage of t he count ries’ nat ural resources should be considered.
4.2.2 Food, Beverages and Tobacco
Anot her sect or w it h w at er int ensit y above t he EU m edian is t he food, beverages and t obacco sect or. We have applied t he subsyst em decom posit ion for all t he EU 27 count ries for t his act ivit y. We do not present result s here for t he decom posit ion of w at er use in t his sect or as, in all count ries, direct w at er use is act ually very sm all in absolut e t erm s. Addit ionally, w hen w e decom pose t he result s from t his sect or t he “ ext ernal com ponent ” is by far t he largest .10
4.2.3 Chemicals and Chemical Products
In 2005, t he chem ical sect or in nort hern Europe was responsible for 67% of t ot al w at er use by t his sect or w it hin t he EU, and cont ribut ed t o 75% of EU out put from t his sect or. In cent ral and east ern Europe t his sect or w as responsible for 21% of EU sect oral w at er use, and account ed for 5% of EU sect oral out put . The figures for M edit erranean EU count ries w ere 11% of w at er use and 20% of out put .
The chem ical sect or m ainly uses w at er indirect ly, as t he ext ernal com ponent is quit e large for all the count ries analysed. Figures 5 t o 7 show t he decom posit ion of w at er use in t he chemical sect or in t he
t hree different sub regions ident ified in our analysis.
Figure 5: Decom posit ion of w at er use in t he chem ical sect or – nort hern Europe
10
14
[image:15.595.75.442.437.666.2]Figure 6: Decom posit ion of w at er use in t he chem ical sect or – cent ral/ east ern Europe
Figure 7: Decom posit ion of w at er use in t he chem ical sect or – M edit erranean Europe
0% 20% 40% 60% 80% 100% G. Britain
Ireland Ger many France Sweden Austr ia Belgium Finland Luxembourg Nether lands Denmar k
15 The decom posit ion analysis show s t hat w at er usage pat t erns in t his sect or are quit e het erogeneous
even bet w een count ries w it hin t he sam e region. One pat t ern t hat does clearly em erge from t he count ries in nort hern Europe is t hat t he majorit y of t he w at er used t o satisfy final dem and from t his sect or is in fact used t o sat isfy dem and from abroad. In Nort hern Europe, on average, m ore t han 90% of final product ion from t his sect or is export ed.
Sim ilar pat t erns can be seen from t he decom posit ion of w at er use for t he chem ical sect or in cent ral/ east ern Europe and in M edit erranean Europe; t he largest com ponent is t he ext ernal com ponent show ing t hat , in addit ion t o t he w at er being consum ed direct ly by t his sect or, it also
drives t he use of w at er in ot her sect ors. Addit ionally, for m ost count ries in t hese regions t he m ajorit y of t he final dem and for goods from t he chem ical sect or is from ot her count ries.
4.2.4 Electricity, Gas and Water Supply
The elect ricit y, gas and w at er supply sect or includes the w at er used t o produce elect ricit y and gas, as w ell as t he w at er used in t he w at er dist ribut ion syst em . In nort hern Europe t he elect ricit y, gas and w at er supply sect or w as responsible for 65% of t he t ot al w at er used by t his sect or w it hin t he EU,
and also cont ribut ed t o 65% of EU out put from t his sect or. In cent ral and east ern Europe t his sect or w as responsible for 14% of EU sect oral w at er use, and account ed for 10% of EU sect oral out put . The figures for M edit erranean EU count ries w ere 21% of w at er use and 25% of out put .
Wit h t he except ion of M alt a and Cyprus, for w hich data are not fully reliable, our analysis show s t hat
[image:16.595.73.438.67.258.2]for all t he ot her count ries in nort hern and M edit erranean Europe, t he induced com ponent is generally t he m ain driver of w at er usage, follow ed by t he final dem and com ponent (i.e. t he sum of dom est ic final dem and and export s). The pat t ern is som ew hat different in cent ral/ east ern Europe w here t he final dem and com ponent is t he largest , follow ed by t he induced com ponent .
16
Figure 9: Decom posit ion of w at er use in t he elect ricit y, gas and w at er sect or – cent ral/ east ern Europe
0% 20% 40% 60% 80% 100% G. Britain
Ireland Ger many France Sweden Austr ia Belgium Finland Luxembourg Nether lands Denmar k
[image:17.595.74.437.69.318.2]17
Figure 10: Decom posit ion of w at er use in t he elect ricit y, gas and w at er sect or – M edit erranean Europe*
* Cyprus and M alt a were excluded from t his graph because dat a on w at er used by t his sect or w as m issing in t hese count ries.
In all regions and in m ost count ries, t he ext ernal com ponent is close t o zero, w hich indicat es t hat t he elect ricit y, gas and w at er sect or does not drive t he consum pt ion of w at er in ot her sect ors. The m ajorit y of w at er used in t his sect or is generally account ed for by t he dom est ic final demand and induced com ponent s, w hich show s t hat w at er used in t his sect or is prim arily being driven by t he dem and for final goods/ services and by t he dem and for product ion input s from ot her sect ors. Figures 8 t o 10 illust rat e t hat t he share of t he induced com ponent varies significant ly bet w een
count ries, from a m axim um of 70% in Finland t o a m inim um of only 2% in Denm ark. On average, t he induced com ponent account s for 35% of t ot al w at er used in t his sect or in M edit erranean count ries; 37% in nort hern European count ries; and 21% in count ries in cent ral/ east ern Europe. The am ount of w at er w hich is used t o sat isfy t he final dem and for export ed goods from t his sect or is low est in M edit erranean count ries (6%, com pared t o 13% in cent ral/ east ern Europe and 21% in nort hern Europe), as w ould be expect ed in count ries w here w at er is scarce.
Conclusions
The Wat er Fram ew ork Direct ive defines com m on object ives for w at er preservat ion across t he European Union. Given t his general approach t o European w at er m anagem ent , a com m on w at er policy can only succeed in it s object ives if pat t erns of w at er use are parallel in all EU count ries. Our paper addresses t his point . Specifically, w e analyse t he pat t erns t hat explain w at er consum pt ion in t he product ion syst em of all EU m em bers.
[image:18.595.78.442.140.315.2]18 Our result s highlight t hat t he m ost w at er-int ensive sect ors in Europe are agricult ure, food and beverages, chem ical product s and elect ricit y, gas and w at er supply. How ever, t he am ount of w at er used in t hese sect ors varies quit e subst ant ially across EU count ries. The indicat or used also show s different w at er int ensit ies in t he t hree European regions considered.
The subsyst em m odel show s t hat for m ost count ries in nort hern and M edit erranean Europe, t he
m ajorit y of w at er used by t he elect ricit y, gas and w at er supply sect or is account ed for by t he induced com ponent . This show s t hat w hile t his sect or is a large consum er of w at er resources in t hese regions, t he consum pt ion is largely driven by dem and from ot her sect ors for w at er-int ensive input s. This raises t he quest ion of w het her w at er should be charged on t he basis of a producer-pays or a consum er-pays principle in t hese count ries.
Our result s show t hat agricult ure is t he m ost w at er-int ensive sect or in bot h cent ral/ east ern and M edit erranean European count ries. Addit ionally, the cont ribut ion of t he agricult ural sect or t o t ot al
out put differs quit e subst ant ially bet ween cent ral/ east ern and M edit erranean count ries. In cent ral/ east ern European count ries t he agricult ural sect or account s for an average out put of 5%. The m axim um is in Rom ania (9%). In t he M edit erranean count ries, agricult ure on average count s f or less t han 3% of t ot al out put . Our subsyst em decomposit ion show s t hat t he w at er em bedded in agricult ural product s is m ainly dest ined for dom est ic consum pt ion in t he cent ral/ east ern European count ries, and for export s in t he M edit erranean count ries.
The het erogeneit y observed in our result s suggest t hat different policies should be adopt ed in t he
various EU sub-groups in order t o ensure sust ainable consum pt ion of w at er and, m ore generally, t o achieve w at er savings. In cent ral/ east ern European count ries at t ent ion should be given t o t he dom est ic consum pt ion of agricult ural produce, in order t o prom ot e t he m ore responsible use of w at er in agricult ure. In t he M edit erranean count ries, w at er t ariffs should be adapt ed t o t ake int o account t he w at er scarcit y in t hese regions and t he export of w at er-int ensive product s from som e M edit erranean count ries.
19
Refer ences
Alcánt ara, V. 1995. Economía y cont aminación at mosférica: hacia un nuevo enfoque desde el análisis
input -out put. Doct oral Thesis Dissert at ion. Universit y of Barcelona.
Alcánt ara, V. and Padilla, E. 2009. Input -out put subsyst em s and pollut ion: an applicat ion t o t he
service sect or and CO2 em issions in Spain. Ecological Economics 68, 905-914.
But nar, I. and Llop, M . 2011. St ruct ural decom posit ion analysis and input-out put subsyst em s: an
applicat ion t o CO2 em issions of Spanish service sect ors (2000-2005). Ecological Economics 70,
2012-2019.
Cardenet e, M . A. and Fuent es, P. 2011. Energy consum pt ion and CO2 em issions in t he Spanish
econom y. In: M . Llop, ed. Air pollut ion: measurement s and cont rol policies, Bent ham E-Books, Pages
46-64.
Deprez, J. 1990. Vert ical int egration and t he problem of fixed capit al. Journal of Post Keynesian
Economics 13, 47-64.
Diet zenbacher, E. and Velázquez, E., 2007. Analysing Andalusian Virt ual Wat er Trade in and Input -Out put Fram ew ork. Regional St udies, 41(2), 185-196.
European Union, 2012. “ EU Energy in Figures – Pocket book 2012” . Luxem bourg: Publicat ions Office of t he European Union.
EPA, 2012. “ Nuclear Energy” . Available at : ht t p:/ / w w w .epa.gov/ cleanenergy/ energy-and-you/ affect / nuclear.ht m l. Accessed: 11t h Sept em ber 2012.
Gent y, A., Art o, I. and Neuw ahl, F., 2012. Final Dat abase of Environm ent al Sat ellit e Account s: Technical Report on Their Com pilat ion. WIOD Docum ent at ion.
Guan, D. B. and Hubacek, K., 2007. Assessm ent of regional t rade and virt ual w at er flow s in China,
Ecological Economics, 61, 159-170.
Hoekst ra, A.Y. and Hung, P.Q., 2002. Virt ual w at er trade: a quant ificat ion of virt ual w at er flow s bet w een nat ions in relat ion int ernat ional crop t rade. Value of Wat er Research Report Series No. 11. UNESCO-IHE, Delft , t he Net herlands.
20 Llop, M . and Tol, R., 2012. Decom posit ion of sect oral greenhouse gas emissions: a subsyst em input -out put m odel for t he Republic of Ireland. Journal of Environment al Planning and M anangement, fort hcom ing.
M endiluce, M ; Pérez-Arriaga, I. and Ocaña, C. 2010. Com parison of t he evolution of energy int ensit y in Spain and in t he EU15. Why is Spain different ? Energy Policy, 38 (1), 639-645.
M orilla, C., Llanes, G. and Cardenet e, M . A., 2007. Econom ics and environm ent al efficiency using a
social account ing m at rix. Ecological Economics, 60, 774-786.
Pasinet t i, L. 1973. The not ion of vert ical int egrat ion in econom ic analysis. M et roeconomica 25, 1-29.
Pasinet t i, L. 1988. Growing subsyst em s, vertically hiper-int egrat ed sect ors and t he labour t heory of
value. Cambridge Journal of Economics 12, 125-134.
Sánchez-Choliz, J. and Duart e, R. 2003. Analysing pollut ion by vert ically int egrat ed coefficient s, w it h
an applicat ion t o t he w at er sect or in Aragon. Cambridge Journal of Economics 27, 433-448.
Scazzieri, R. 1990. Vert ical int egrat ion in econom ic t heory. Journal of Post Keynesian Economics 13,
20-46.
Sraffa, P. 1960. Product ion of com m odit ies by m eans of com m odit ies. Cam bridge: Cam bridge
Universit y Press.
Tim m er, M . (Ed.), 2012. The World Input -Out put Dat abase (WIOD): Cont ent s, Sources and M et hods. April 2012, Version 0.9.
Velázquez, E. 2006. An input –out put m odel of w at er consum pt ion: Analysing int ersect oral w at er relat ionships in Andalusia, Ecological Economics, 56, 226 -240.
Zhao, X., Chen, B. and Z.F. Yang, 2009. Nat ional w at er foot print in an input -out put fram ew ork - A