Munich Personal RePEc Archive
Determinants of successful electricity
market reform
Erdogdu, Erkan
Judge Business School, University of Cambridge, UK
April 2011
PHD SECOND YEAR REPORT 2010-2011
Determinants of Successful Electricity Market Reform
April 2011
STUDENT
Erkan Erdogdu
1
STSUPERVISOR
Dr. Michael Pollitt
2
NDSUPERVISOR
Prof. David Newbery
I confirm that this report is my own unaided effort. All sources are fully acknowledged and referenced, and this submission does not contain material that has already been used to any
substantial extent for a comparable purpose.
Signature ………
PROJECT AVAILABILITY
(Please tick ONE box only)Available
(to Cambridge University staff and students only)
Confidential
(the Library will not release your report to anyone)
Consult me
(prospective readers will be directed to email you for permission to read your project)
2
Acknowledgements
I would like to take this opportunity to thank various people and institutions without whose
extremely generous support the present report would have hardly been prepared. First of all, I
would like to thank my supervisors (Dr. Michael Pollitt and Prof. David Newbery) for all their
helpful comments and suggestions. Special thanks are due to Dr. Paul Kattuman, who
provided me with the econometrics background that I have extensively exploited to prepare
the present report. I would like to extend my sincere thanks and appreciation to Mr. Anthony
Haynes, who helped me to improve the language of the report. I am also grateful to the
Cambridge Overseas Trust for awarding me a full scholarship that has financed my doctoral
(PhD) studies at University of Cambridge (UK). Besides, I really appreciate the contribution
of International Energy Agency (IEA), Latin-American Energy Organization (OLADE) and
World Bank into this study by providing data for free or at discounted rates. Last but not least,
3
Contents
Acknowledgements ... 2
Contents ... 3
List of Figures ... 4
List of Tables ... 4
1. Introduction ... 5
2. Second paper: “A cross-country analysis of electricity market reforms: potential contribution of New Institutional Economics” ... 6
2.1. Introduction ... 7
2.2. Overview of data ... 8
2.3. Methodology ... 15
2.4. Empirical analysis and discussion of the preliminary results ... 20
3. PhD research plan ... 29
4. Conclusion ... 31
4
List of Figures
Figure 1. Histogram of reform score variable ... 10
Figure 2. Educational background of chairmen and ministers in the sample countries ... 11
Figure 3. Education level of chairmen and ministers in the sample countries ... 11
Figure 4. Length of term of chairmen and ministers in the sample countries ... 12
Figure 5. Scatter plot of polity score and legal system & property rights index ... 13
Figure 6. The number of countries by investment freedom index ranges for 2008 ... 14
Figure 7. Civil liberties and political rights scores for the sample countries in 2008 ... 15
Figure 8. Poisson distribution for different values ... 19
List of Tables
Table 1. Descriptive statistics of the variables in the models ... 8Table 2. Poisson estimation results for Model 1 ... 23
Table 3. Poisson estimation results for Model 1 as Incident Rate Ratios ... 24
Table 4. Poisson estimation results for Model 2 ... 25
Table 5. Poisson estimation results for Model 2 as Incident Rate Ratios ... 25
Table 6. Poisson estimation results for Model 2 as Incident Rate Ratios (using „political rights score‟ variable) ... 26
5
1. Introduction
This report presents a summary of the doctoral research conducted during the first two years
of the PhD study and the plans concerning its progress in the future. The research is
concerned with the electricity market reforms that have been put into practice in more than
half of the countries in the world. The analysis is predominantly empirical with a special
focus on electricity industries. Originally, this research was inspired by the experiences of the
author, who was working for the energy market regulator in his home country before
commencing his PhD studies in Cambridge. The final PhD thesis will be in three-paper
format. The titles of each paper are given below.
1) The impact of power market reforms on electricity price-cost margins and
cross-subsidy levels: a cross country panel data analysis
2) A cross-country analysis of electricity market reforms: potential contribution
of New Institutional Economics
3) The political economy of electricity market liberalization: evidence from
OECD countries
The first paper was prepared and presented during the first three terms of the PhD program. It
was also an internal part of First Year Report (Erdogdu, 2010) and improved during the
summer of 2010 based on comments from the supervisors and the markers. Then, it was
presented at an EPRG E&E Seminar1 and submitted to Energy Policy (ISSN: 0301-4215, 2010 Impact Factor: 2.436) for consideration of possible publication. After modifying it in
line with the comments from three anonymous referees and attendees of EPRG E&E Seminar,
the final version of the first paper was published in Energy Policy by Elsevier in March 2011
(Erdogdu, 2011). Since the first paper has already been presented many times and published
in Energy Policy; in this report, we will not focus further on it. This report mainly
concentrates on the second paper and the preliminary results from it are presented here. At the
1 The paper was presented at EPRG (Electricity Policy Research Group, University of Cambridge) Energy and
6
time of writing this report, the second full draft of the second paper is available. It will
probably be submitted as a working paper to EPRG Working Paper Series. It will also be
presented at the EPRG E&E Seminar in October 2011. Besides, if necessary funding is
available, it will be presented in one of the respected international academic conferences.
After modifications based on feedbacks from various sources, its final version will be
prepared and submitted to one of the respected academic journals. As for the third paper, it is
still in progress and data collection for it has recently been completed. It is expected that its
first full draft will be ready until the end of sixth term of the PhD study (June 2011). Then, it
will go through the procedures similar to those of the second paper. The final PhD thesis will
be submitted at the beginning of the ninth term (April 2012) and it is expected that the second
and third papers will be submitted to the respected academic journals by that time.
To sum up, the proposed PhD thesis will consist of three independent but related papers
where the preliminary results from the second one are presented in this report. The report is
structured as follows. Following section presents a summary of the second paper. Section 3
outlines PhD research plan. Final section concludes.
2. Second paper:
“
A cross-country analysis of electricity market reforms:
potential contribution of New Institutional Economics
”
The paper explores whether the question of why some countries are able to implement more
extensive reforms is closely related to the question of why some countries have better
institutions than others. We analyse this question by using empirical econometric models with
cross-section data covering 51 countries. The results show that both the background of the
regulator and the energy minister and the institutional endowments of a country are important
determinants of how far reforms have gone in a country. Our results suggest that the best first
chairman of a regulatory agency, in terms of reform progress, seems to be one with a degree
in law or engineering and one with a long period in office. The best minister responsible for
energy policy when regulator is set up is, on the other hand, one with a degree in business or
economics and one who has as little experience in the electricity industry as possible and does
not have a degree in law. The results also put forward that any improvement in the structure
7
positively contributes to the reform progress in a country. However, there seems to be a
negative relationship between reform progress and both civil liberties and political rights.
2.1. Introduction
The interest and motivation for this topic arises from the relatively recent agreement that has
emerged among scholars in regarding institutions as a key factor shaping the outcome of an
economic transformation. This objective is pursued by discussing implications of the
conceptual framework proposed by the New Institutional Economics for power market
reform. Besides, evidence resulting from an econometric empirical analysis that investigates
the relationship between institutions and reforms is presented as well.
The reform experience so far (especially in developing countries) suggests two consistent
findings. First, institutional endowments of a country (such as judicial independence, integrity
of the legal system, protection of property rights, legal enforcement of contracts and degree of
polity) largely determine the extent of the reforms. Second, despite the different approaches in
the design of regulatory institutions, a separate agency from the government with reasonable
levels of autonomy and technical expertise has emerged as the preferred model for a
regulatory institution. Due to path dependency, the first chairman of electricity market
regulatory agency and the minister responsible for energy policy when the regulator is set up
play a critical role in the process. Therefore, in this study, we focus on these macro (general
institutional endowments) and micro (background of the chairman and the minister) variables
as key factors explaining differences in the extent of the reforms implemented in various
countries.
We try to answer following research questions: (i) do differences in institutional structures of
countries play an important role in explaining how far reforms have gone in these countries?
(ii) if they do, how do specific institutional endowments of a country affect its reform
performance? (iii) do the background of the first chairman of the regulatory agency or that of
the minister responsible for energy policy when the regulatory agency is set up have an
8
2.2. Overview of data
Our data set is cross-section and covers 51 countries. The sample countries in our analysis are
determined by data availability. We have some missing observations in our dataset. Table 1
[image:9.595.77.537.241.731.2]shows the variables used in the study and their descriptive statistics.
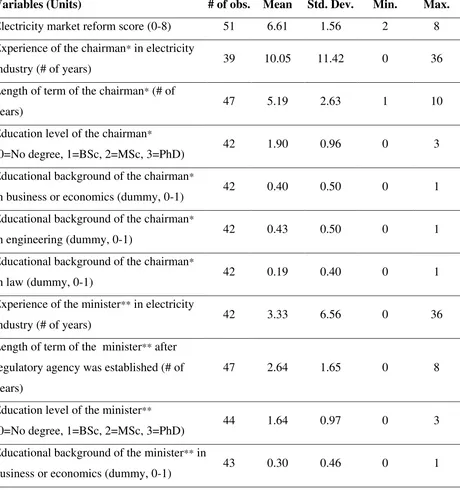
Table 1. Descriptive statistics of the variables in the models
Variables (Units) # of obs. Mean Std. Dev. Min. Max.
Electricity market reform score (0-8) 51 6.61 1.56 2 8
Experience of the chairman* in electricity
industry (# of years) 39 10.05 11.42 0 36
Length of term of the chairman* (# of
years) 47 5.19 2.63 1 10
Education level of the chairman*
(0=No degree, 1=BSc, 2=MSc, 3=PhD) 42 1.90 0.96 0 3
Educational background of the chairman*
in business or economics (dummy, 0-1) 42 0.40 0.50 0 1
Educational background of the chairman*
in engineering (dummy, 0-1) 42 0.43 0.50 0 1
Educational background of the chairman*
in law (dummy, 0-1) 42 0.19 0.40 0 1
Experience of the minister** in electricity
industry (# of years) 42 3.33 6.56 0 36
Length of term of the minister** after
regulatory agency was established (# of
years)
47 2.64 1.65 0 8
Education level of the minister**
(0=No degree, 1=BSc, 2=MSc, 3=PhD) 44 1.64 0.97 0 3
Educational background of the minister** in
9 Educational background of the minister** in
engineering (dummy, 0-1) 43 0.30 0.46 0 1
Educational background of the minister** in
law (dummy, 0-1) 43 0.19 0.39 0 1
Polity score in 2008 (-10 - +10) 51 7.04 4.63 -10 10
Legal system & property rights index in
2008 (0-10) 50 6.27 1.52 3.07 8.98
Investment Freedom Index in 2008 (0-100) 50 60.80 18.93 20 90
Civil Liberties Score in 2008 (1-7) 51 2.29 1.40 1 6
Political Rights Score in 2008 (1-7) 51 2.49 1.79 1 7
Population in 2008 (million people) 51 86.10 239.65 0.49 1,324.66
Log of population in 2008 51 2.91 1.73 -0.72 7.19
OECD Country (dummy, 0-1) 51 0.43 0.50 0 1
* The Chairman refers to the first chairman of electricity market regulatory agency.
** The Minister refers to the minister who was responsible for energy policy when the regulatory agency for electricity market was established.
Electricity market reform score variable takes the values from 0 to 8; depending on how many
of the following reform steps have been taken in each country as of 2008: (1) introduction of
independent power producers, (2) corporatization of state-owned enterprises, (3) law for
electricity sector liberalization, (4) introduction of unbundling, (5) establishment of electricity
market regulator, (6) introduction of privatization, (7) establishment of wholesale electricity
market, and (8) choice of supplier. To build this variable, we created 8 dummy variables for
each of the reform steps mentioned above and calculated the total number of reform steps
taken in each country. Dummy variables for reform steps are created based on the data
collected and cross-checked from various international and national energy regulators‟ web
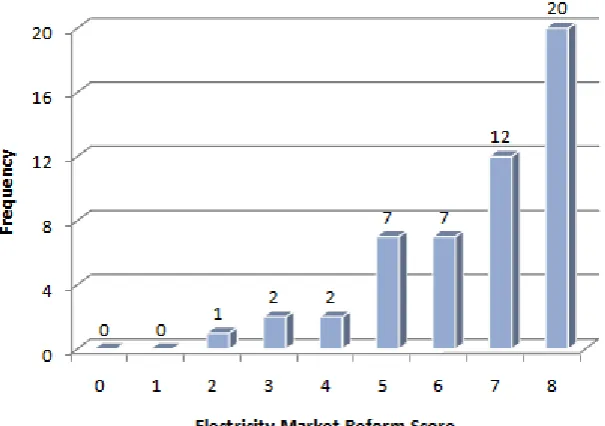
sites2. Figure 1 provides the histogram of the reform score variable showing the frequency of observations. When we evaluate Figure 1, we see that all countries in our dataset have taken
at least two reform steps and more than 2/3 of them have taken 5 or more reform steps.
10
Figure 1. Histogram of reform score variable
We collected data for each country on the background of the first chairman of electricity
market regulatory agency and the minister who was responsible for energy policy when
regulatory agency for electricity market was established. In many countries, a separate agency
was set up to regulate electricity industry. In some others, an already existing agency was
given the task of regulating electricity market. For the first group of countries, we collected
data on the first chairman of the agency; for the second group, we collected data on the
chairman when the agency was given the responsibility to regulate the power industry. The
data on chairman include his/her experience in electricity industry, his/her length of term,
his/her education level (BSc, MSc or PhD) and his/her educational background (business or
economics, engineering or law). We also gathered data about the minister who was
responsible for energy policy when regulatory agency for electricity market was established
or an already existing agency was given the task of regulating electricity market. Similarly,
these data include his/her experience in electricity industry, his/her length of term after
regulatory agency was established, his/her education level (BSc, MSc or PhD) and his/her
educational background (business or economics, engineering or law). The data on chairmen
and the ministers are obtained from various reports and documents published by regulatory
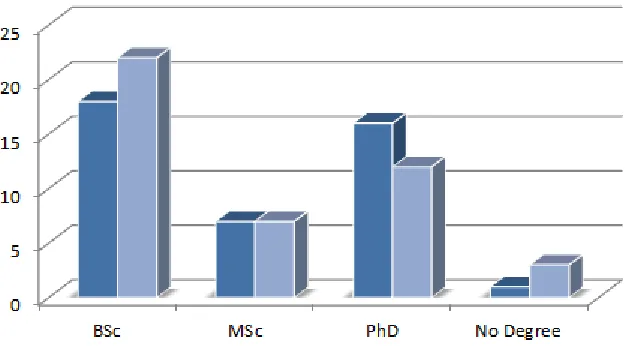
agencies and ministries of the countries. Figure 2 shows the number of chairmen and
ministers in the sample countries by their educational background while Figure 3 presents this
11
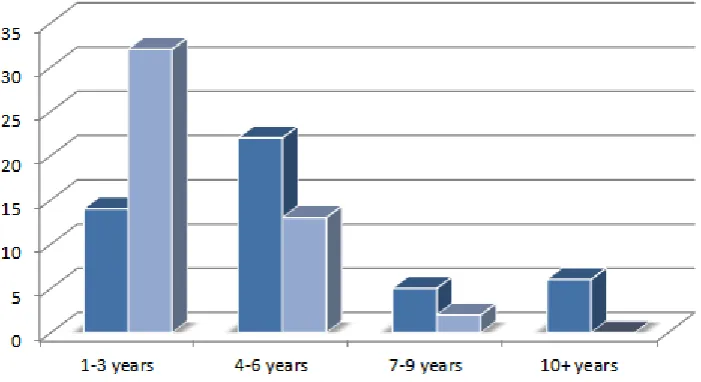
sample countries by their length of term. While evaluating Figure 4, it is important to keep in
mind that a minister‟s length of term refers to his/her length of term after regulator
[image:12.595.121.471.193.374.2]established.
Figure 2. Educational background of chairmen and ministers in the sample countries
[image:12.595.140.454.478.651.2]12
Figure 4. Length of term of chairmen and ministers in the sample countries
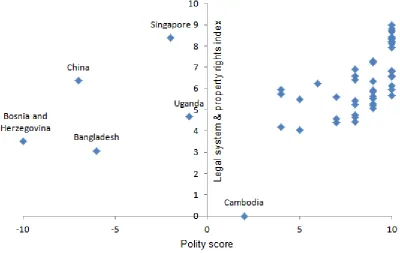
The data on polity score for each country in 2008 are obtained from Center for Systemic
Peace (2010). The polity score for each country ranges from +10 (strongly democratic) to -10
(strongly autocratic). The data on legal system & property rights index in 2008 are taken from
Gwartney et al. (2010). Protection of persons and their rightfully acquired property is a central
element of economic freedom and a civil society. The key ingredients of a legal system
consistent with economic freedom are rule of law, security of property rights, an independent
judiciary, and an impartial court system. Security of property rights, protected by the rule of
law, provides the foundation for both economic freedom and the efficient operation of
markets. Fraser Institute constructs legal system & property rights index (0-10 scale) based on
following criteria: judicial independence, impartial courts, protection of property rights,
military interference in rule of law and the political process, integrity of the legal system,
legal enforcement of contracts, regulatory restrictions on the sale of real property. Figure 5
provides a scatter plot of polity score and legal system & property rights index for the year
13
Figure 5. Scatter plot of polity score and legal system & property rights index
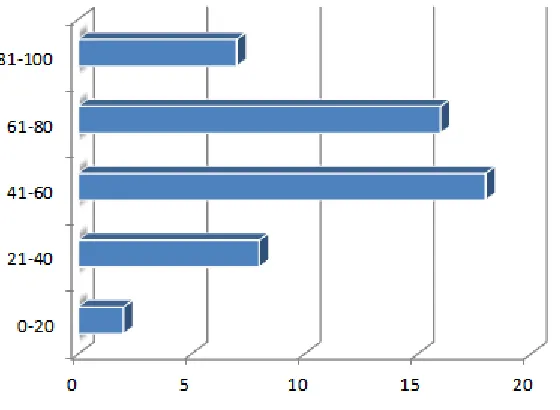
Heritage Foundation (2011) provides Investment Freedom Index for each country based on
0-100 scale. In an economically free country, there would be no constraints on the flow of
investment capital. Individuals and firms would be allowed to move their resources into and
out of specific activities both internally and across the country‟s borders without restriction.
Such an ideal country receives a score of 100 in Heritage Foundation‟s Investment Freedom
Index. In practice, however, most countries have a variety of restrictions on investment. Some
have different rules for foreign and domestic investment; some restrict access to foreign
exchange; some impose restrictions on payments, transfers, and capital transactions; in some,
certain industries are closed to foreign investment. Moreover, labour regulations, corruption,
red tape, weak infrastructure, and political and security conditions can also affect the freedom
that investors have in a market. The index evaluates a variety of restrictions typically imposed
on investment. Points are deducted from the ideal score of 100 for the restrictions found in a
14
Figure 6. The number of countries by investment freedom index ranges for 2008
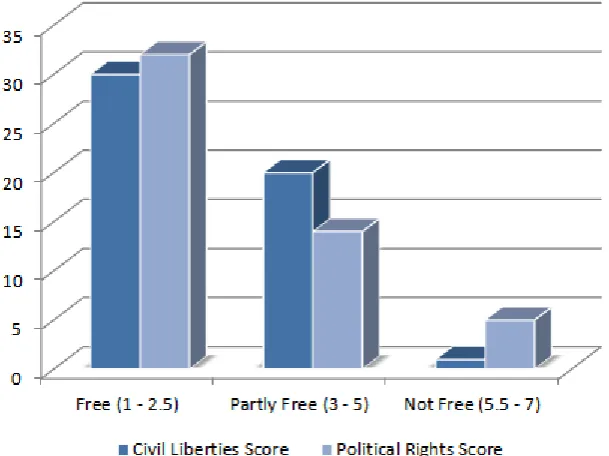
Civil liberties and political rights scores for 2008 are taken from Freedom House (2011). The
Freedom in the World survey by Freedom House provides an annual evaluation of the state of
global freedom as experienced by individuals. The survey measures freedom -the opportunity
to act spontaneously in a variety of fields outside the control of the government and other
centres of potential domination- according to two broad categories: political rights and civil
liberties. Political rights enable people to participate freely in the political process, including
the right to vote freely for distinct alternatives in legitimate elections, compete for public
office, join political parties and organizations, and elect representatives who have a decisive
impact on public policies and are accountable to the electorate. Civil liberties allow for the
freedoms of expression and belief, associational and organizational rights, rule of law, and
personal autonomy without interference from the state. Political rights and civil liberties
scores range from 1 to 7, with 1 representing the highest and 7 the lowest level of freedom.
Figure 7 shows the number of countries in the sample by their civil liberties and political
15
Figure 7. Civil liberties and political rights scores for the sample countries in 2008
Data on populations of the countries in 2008 are taken from World Bank (2010). Since using
the logarithm of a variable enables us to interpret coefficients easily and is an effective way of
shrinking the distance between values, we transform population variable into logarithmic
form and use this new transformed variable in our models when appropriate. Finally, we also
include a dummy variable into our dataset to represent OECD member countries.
2.3. Methodology
In our study, we focus on the background of the first chairman of electricity market regulatory
agency, that of the minister responsible for energy policy when the regulator was set up and
macro institutional indicators to explain the progress in reform process in each country.
In many countries, the ministry responsible for energy-related issues sets general policies for
electricity industry and the regulatory agency puts these policies into practice. Both policy
setting and policy implementation are crucial factors that explain the reform progress in any
country. Besides, path dependency implies that the first chairman of electricity market
regulatory agency and the minister responsible for energy policy when the regulatory agency
16
Argentina, Carlos Bastos, Secretary of Energy 1991-96, led the privatisation of the electricity
sector, within the general policy framework of the Minister of Economy. Bastos was formerly
an electrical engineer, researcher and a consultant on electricity issues for the Inter-American
Development Bank and the Harvard Institute for International Economic Development. He
brought the conceptual vision and insistence on a reformed, privately owned and competitive
sector. He gave general direction and control to the privatisation of the energy sector, and
took on the political battles, including with parties from the existing industry. The reform was
along similar lines to the UK, and even went further with respect to restructuring (Littlechild
and Skerk, 2004). Similarly, UK has been successful in market reform because it managed to
find a set of quite able, fair-minded regulators. Professor Stephen C. Littlechild was Director
General of Electricity Supply (DGES), in charge of the Office of Electricity Regulation
(OFFER), from its foundation in September 1989 to 1998. Littlechild, one of the architects of
the successful UK electricity reform, has been a true believer in competition in electricity
markets. Before the appointment, he was Professor of Commerce and Head of Department of
Industrial Economics and Business Studies at the University of Birmingham from 1975-89,
and a member of the Monopolies and Mergers Commission from 1983-89. In response to the
apparent problems of the cost-recovery methods, in 1983, Professor Stephen C. Littlechild
proposed a “high-powered” incentive scheme, popularly known as RPI-X or price cap, in which the regulator caps the allowable price or revenue for each firm for a pre-determined
period. Thus far, in terms of economic efficiency, RPI-X has been a clear success. In the
United Kingdom, the RPI-X regulatory approach has induced cost reductions well beyond
expectations. Electricity companies have been able to greatly reduce operating costs in large
part through substantial work force reductions. In short, the educational and professional
backgrounds of energy minister and regulator played an important role in the reform progress
in Argentina and the UK, respectively. Therefore our first hypothesis is as follows:
Hypothesis 1: Due to path-dependency, the background of the first regulator or
that of the minister responsible for energy policy when regulatory agency was set
up have a significant impact on overall reform progress.
As in the case of any competitive market, a competitive electricity market requires a liberal
17
Hypothesis 2: In countries with strong legal systems that secure property rights,
reforms go further.
Hypothesis 3: Democratic countries advance more rapidly in terms of power
market reform process than those with less democratic systems.
Hypothesis 4: Expansion of civil liberties and political rights contribute to power
market reform progress.
Hypothesis 5: The reform progresses more rapidly in countries where there are
few obstacles to investment than in those where investment is hindered by
bureaucratic, structural or political reasons.
In our study, scope of the reforms in each country is represented by electricity market reform
score variable. Therefore, in our analysis, we describe electricity market reform score as a
function of
(a) the background of the first chairman of electricity market regulatory agency (his/her
experience in electricity industry, his/her length of term, his/her education level,
his/her educational background in business or economics, in engineering or in law)
(b)the background of the minister who was responsible for energy policy when regulatory
agency for electricity market was established (his/her experience in electricity
industry, his/her length of term after regulatory agency was established, his/her
education level, his/her educational background in business or economics, in
engineering or in law)
(c) macro variables representing the institutional endowments of the countries (polity
score, legal system & property rights index, investment freedom index, civil liberties
score and political rights score)
(d)control variables (population and dummy variable for being an OECD country).
In our analysis, our dependent variable is limited, that is, it is a count variable, which can take
on nonnegative integer values, Yi{0,1, 2,3, 4,5, 6, 7,8}. We cannot take the logarithm of a
count variable because it takes on the value zero. A beneficial approach is to model the
18
1 2 0 1 1
( | , ,..., ) exp(y x x xk x ... kxk) (1)
Since exp( ) is always positive, predicted values for y will also be positive. Although this is
more complicated than a linear model, we know how to interpret the coefficients. Taking the
log of Equation (1) shows that
1 2 0 1 1
log[ ( | , ,..., )]y x x xk x ... kxk (2)
so that the log of the expected value is linear. Using the approximation properties of the log
function, we write
% ( | ) (100 )y x i xi (3)
In other words, 100i is roughly the percentage change in E(y|x), given a one-unit increase in
xi.
Because Equation (1) is nonlinear in its parameters, we cannot use linear regression methods.
We could use nonlinear least squares, which, just as with OLS, minimizes the sum of squared
residuals. It turns out, however, that all standard count data distributions exhibit
heteroskedasticity, and nonlinear least squares does not exploit this. Instead, we will rely on
maximum likelihood and the important related method of quasi-maximum likelihood
estimation. Besides, as we know, normality is the standard distributional assumption for linear
regression. The normality assumption is reasonable for continuous dependent variables that
can take on a large range of values. A count variable cannot have a normal distribution
(because the normal distribution is for continuous variables that can take on all values), and if
it takes on very few values, the distribution can be very different from normal. Instead, the
nominal distribution for count data is the Poisson distribution. A random variable Y, which
only takes on nonnegative integer values, follows the Poisson distribution if, for k = 0, 1, 2, ...
exp( ) Pr( )
!
k
Y k
k
(4)
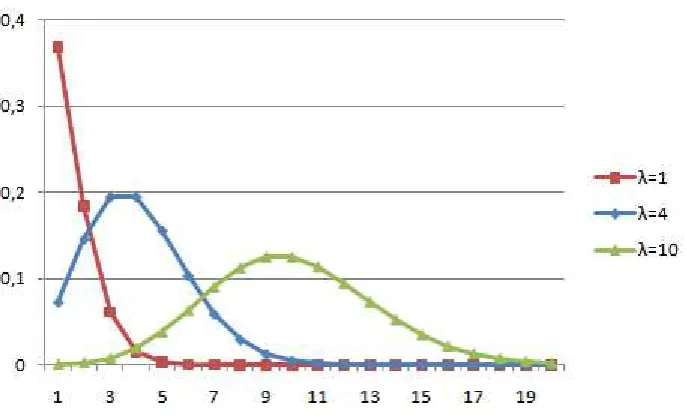
where 0. The mean and variance of Poisson random variable is and
( )Y var( )Y (5)
Figure 8 shows the Poisson distribution for different values. Because we are interested in
the effect of explanatory variables on y, we must look at the Poisson distribution conditional
on x. The Poisson distribution is entirely determined by its mean, so we only need to specify
19
exp( ) Pr( | )
!
k i i
i i
Y k X
k
(6)
0 1
( | ) exp( )
i Y Xi i Xi
(7)
0 1
ln( )i Xi (8)
Here, the interpretation of 1 is that when there is a one unit increase in Xi, the percentage
change of ( |Y X)is 100 x1. This distribution, which is the basis for the Poisson regression
[image:20.595.128.472.290.500.2]model, allows us to find conditional probabilities for any values of the explanatory variables.
Figure 8. Poisson distribution for different values
In principle, the Poisson model is simply a nonlinear regression. It is much easier to estimate
the parameter with maximum likelihood method. The log-likelihood function is
0 1
( , ;{ | }N1)
InL Yi Xi i (9)
1
Pr( | )
N
i i i i
Ln Y y X
(10)0 1 0 1
1
[ exp( ) ( ) ( !)]
N
i i i i
i
X Y X Ln Y
(11)where we can drop the term Ln Y( !)i because it does not depend on . So, we get
0 1 0 1
1
[ exp( ) ( )]
N
i i i
i
X Y X
20
While employing Poisson regression, we should keep in mind two important points. First, we
cannot directly compare the magnitudes of the Poisson estimates of an exponential function
with the OLS estimates of a linear function. Second, although Poisson analysis is a natural
first step for count data, it may be restrictive. All of the probabilities and higher moments of
the Poisson distribution are determined entirely by the mean. In particular, the variance is
expected to be equal to the mean. This is restrictive but, fortunately, the Poisson distribution
has a very nice robustness property: whether or not the Poisson distribution holds, we still get
consistent, asymptotically normal estimators of the i.
Because of the restrictions on the length of the report and because it is not one of its aims,
further details of Poisson regression is not presented here but available from Winkelmann
(2008), Cameron and Trivedi (1998) and Wooldridge (2009).
2.4. Empirical analysis and discussion of the preliminary results
Throughout our analysis, we estimate two models to explain the scope of electricity market
reforms in a country. The first model explains electricity market reform score as a function of
(i) the background of the first chairman of electricity market regulatory agency, (ii) the
background of the minister who was responsible for energy policy when regulatory agency for
electricity market was established and (iii) other control variables (population, dummy
variable for being an OECD country, polity score). The second model, on the other hand,
explains electricity market reform score as a function of macro institutional variables, namely
(i) polity score, (ii) legal system & property rights index, (iii) investment freedom index, (iv)
civil liberties and political rights scores.
The assumption of the Poisson model is that the conditional mean is equal to the conditional
variance. Poisson regression will have difficulty with over dispersed data, i.e. variance much
larger than the mean. Therefore, before starting our analysis, we need to look at the mean and
variance of our dependent variable, that is, electricity market reform score. In our case, the
mean of reform score variable is 6.61 and the variance is 2.44. Even though these numbers are
for the unconditional mean and variance it can be informative because it gives us some
indication of whether a Poisson regression should be used. In our analysis, reform score
21
predictor variables should help, so it may be reasonable to fit a Poisson regression model.
Moreover, to make sure that Poisson regression is an appropriate tool to analyse our dataset,
we report the result of the Poisson goodness-of-fit test in each regression output table. The
large value for chi-square in this test may be an indicator that the Poisson distribution is not a
good choice. A significant (p<0.05) test statistic from the test indicates that the Poisson model
is inappropriate. In our models, values for chi-square in these tests are quite small and all test
statistics are insignificant at 5% level. So, it is obvious that Poisson regression is an
appropriate method for our analysis.
We start the empirical analysis by estimating a Poisson regression for our first model3. Cameron and Trivedi (2009) recommend the use of robust standard errors when estimating a
Poisson model, so we use robust standard errors for the parameter estimates. Table 2 presents
Poisson estimation results for Model 1. In the output table, we also report “Log pseudolikelihood”, which is the log likelihood of the fitted model. It is used in the calculation
of the Likelihood Ratio (LR) chi-square test of whether all predictor variables‟ regression
coefficients are simultaneously zero. Moreover, we provide number of observations. This is
the number of observations used in the Poisson regression. It may be less than the number of
cases in the dataset if there are missing values for some variables in the model. By default,
Stata and Eviews do a listwise deletion of incomplete cases. Besides, we also report Wald
chi2 value, which is the LR test statistic for the omnibus test that at least one predictor
variable regression coefficient is not equal to zero in the model. The degrees of freedom (the
number in parenthesis) of the LR test statistic are defined by the number of predictor
variables. Finally, “Prob > chi2” value indicates the probability of getting a LR test statistic as
extreme as, or more so, than the one observed under the null hypothesis (the null hypothesis is
that all of the regression coefficients are simultaneously equal to zero). In other words, this is
the probability of obtaining this chi-square test statistic if there is in fact no effect of the
predictor variables. This p-value is compared to a specified alpha level, our willingness to
accept a Type I error, which is typically set at 0.05 or 0.01. The small p-value from the LR
test, p < 0.0001, would lead us to conclude that at least one of the regression coefficients in
the model is not equal to zero.
22
While analysing the estimated Poisson regression coefficients, we should keep in mind that
the dependent variable is a count variable, and Poisson regression models the log of the
expected count as a function of the predictor variables. We can interpret the Poisson
regression coefficient as follows: for a one unit change in the predictor variable, the difference
in the logs of expected counts is expected to change by the respective regression coefficient,
given the other predictor variables in the model are held constant. For instance, the coefficient
of the variable “Chairman‟s length of term” can be interpreted as follows: If Chairman‟s
length of term increases by one year, the difference in the logs of expected counts would be
expected to increase by 0.050 unit, while holding the other variables in the model constant.
The output table also presents the standard errors of the individual regression coefficients.
They are used both in the calculation of the z test statistic and the confidence interval of the
regression coefficient. P-value gives the probability that a particular z test statistic is as
extreme as, or more so, than what has been observed under the null hypothesis that an
individual predictor‟s regression coefficient is zero given that the rest of the predictors are in
the model.
Since interpretation of coefficients from a Poisson regression is not straightforward, the
incidence rate ratios (IRR) are obtained by exponentiating the Poisson regression coefficients.
When we use IRR option, estimated coefficients are transformed to incidence-rate ratios, that
is
e
i rather thani
. Standard errors and confidence intervals are similarly transformed. This
option affects how results are displayed, not how they are estimated. As we discussed before,
Poisson regression coefficients are interpreted as the difference between the log of expected
counts. We also know that the difference of two logs is equal to the log of their quotient,
log(a) – log(b) = log(a/b), and therefore, we could have also interpreted the parameter
estimate as the log of the ratio of expected counts: this explains the “ratio” in incidence rate
ratios. In addition, what we referred to as a count can also be called a rate. By definition a rate
is the number of events per time (or space), which our response variable qualifies as. Hence,
we could also interpret the Poisson regression coefficients as the log of the rate ratio: this
explains the “rate” in incidence rate ratio. Finally, the rate at which events occur is called the
incidence rate; thus we arrive at being able to interpret the coefficients in terms of incidence
rate ratios. Table 3 shows Poisson estimation results for Model 1 as incident rate ratios.
23
shows them as incident rate ratios. In Table 6, we replace “civil liberties score” with “political
[image:24.595.113.483.171.673.2]rights score” and estimate Model 2 again with incident rate ratios.
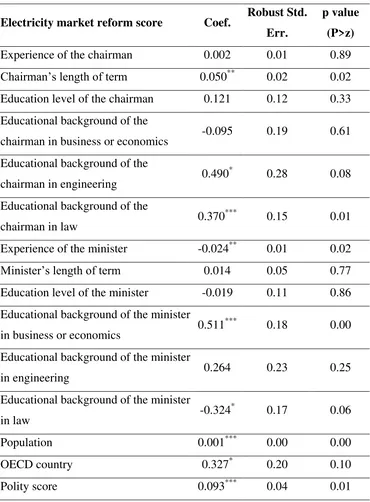
Table 2. Poisson estimation results for Model 1
Electricity market reform score Coef. Robust Std. Err.
p value
(P>z)
Experience of the chairman 0.002 0.01 0.89
Chairman‟s length of term 0.050** 0.02 0.02
Education level of the chairman 0.121 0.12 0.33
Educational background of the
chairman in business or economics -0.095 0.19 0.61
Educational background of the
chairman in engineering 0.490
*
0.28 0.08
Educational background of the
chairman in law 0.370
***
0.15 0.01
Experience of the minister -0.024** 0.01 0.02
Minister‟s length of term 0.014 0.05 0.77
Education level of the minister -0.019 0.11 0.86
Educational background of the minister
in business or economics 0.511
*** 0.18 0.00
Educational background of the minister
in engineering 0.264 0.23 0.25
Educational background of the minister
in law -0.324
* 0.17 0.06
Population 0.001*** 0.00 0.00
OECD country 0.327* 0.20 0.10
Polity score 0.093*** 0.04 0.01
Note: Log pseudolikelihood: -74.15, Number of obs: 33 Wald chi2(15): 2693.64, Prob > chi2: 0.000
Poisson goodness-of-fit test: Chi2=25.81 Prob > Chi2(17)=0.0780
***
Significant at 1% level
**
Significant at 5% level
*
24
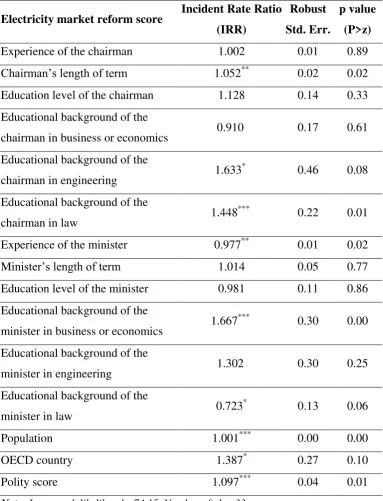
Table 3. Poisson estimation results for Model 1 as Incident Rate Ratios
Electricity market reform score Incident Rate Ratio (IRR)
Robust
Std. Err.
p value
(P>z)
Experience of the chairman 1.002 0.01 0.89
Chairman‟s length of term 1.052** 0.02 0.02
Education level of the chairman 1.128 0.14 0.33
Educational background of the
chairman in business or economics 0.910 0.17 0.61
Educational background of the
chairman in engineering 1.633
*
0.46 0.08
Educational background of the
chairman in law 1.448
***
0.22 0.01
Experience of the minister 0.977** 0.01 0.02
Minister‟s length of term 1.014 0.05 0.77
Education level of the minister 0.981 0.11 0.86
Educational background of the
minister in business or economics 1.667
*** 0.30 0.00
Educational background of the
minister in engineering 1.302 0.30 0.25
Educational background of the
minister in law 0.723
* 0.13 0.06
Population 1.001*** 0.00 0.00
OECD country 1.387* 0.27 0.10
Polity score 1.097*** 0.04 0.01
Note: Log pseudolikelihood: -74.15, Number of obs: 33 Wald chi2(15): 2693.64, Prob > chi2: 0.000
Poisson goodness-of-fit test: Chi2=25.81 Prob > Chi2(17)=0.0780
***
Significant at 1% level
**
Significant at 5% level
*
25
Table 4. Poisson estimation results for Model 2
Electricity market reform score Coef. Robust Std. Err.
p value
(P>z)
Legal system & property rights index 0.097*** 0.02 0.00
Polity score 0.038*** 0.01 0.00
Investment freedom index 0.008*** 0.00 0.00
Civil liberties score 0.130*** 0.02 0.00
Log of population 0.073*** 0.02 0.00
Note: Log pseudolikelihood: -100.75, Number of obs: 49 Wald chi2(15): 4277.70, Prob > chi2: 0.000
Poisson goodness-of-fit test: Chi2=17.84 Prob > Chi2(43)=0.9998
***
[image:26.595.114.482.405.554.2]Significant at 1% level
Table 5. Poisson estimation results for Model 2 as Incident Rate Ratios
Electricity market reform score Incident Rate Ratio (IRR)
Robust
Std. Err.
p value
(P>z)
Legal system & property rights index 1.102*** 0.02 0.00
Polity score 1.038*** 0.01 0.00
Investment freedom index 1.008*** 0.00 0.00
Civil liberties score 1.139*** 0.03 0.00
Log of population 1.076*** 0.02 0.00
Note: Log pseudolikelihood: -100.75, Number of obs: 49 Wald chi2(15): 4277.70, Prob > chi2: 0.000
Poisson goodness-of-fit test: Chi2=17.84 Prob > Chi2(43)=0.9998
***
26
Table 6. Poisson estimation results for Model 2 as Incident Rate Ratios
(using „political rights score‟ variable)
Electricity market reform score Incident Rate Ratio (IRR)
Robust
Std. Err.
p value
(P>z)
Legal system & property rights index 1.090*** 0.02 0.00
Polity score 1.046*** 0.01 0.00
Investment freedom index 1.008*** 0.00 0.00
Political rights score 1.120*** 0.02 0.00
Log of population 1.082*** 0.02 0.00
Note: Log pseudolikelihood: -100.47, Number of obs: 49 Wald chi2(15): 4334.00, Prob > chi2: 0.000
Poisson goodness-of-fit test: Chi2=17.27 Prob > Chi2(43)=0.9998
***
Significant at 1% level
Having presented the study results let me interpret them in detail is as follows:
(1) In the first model, our empirical findings suggest that the length of term and
educational background of the first chairman of the electricity market regulatory
agency are two determinants of the scope of power industry reform in a country. We
could not detect any statistically significant relationship between experience in
electricity industry or education level of the chairman and scope of reforms in a
country.
(2) We find that if the first chairman‟s length of term in a country were to increase by
one year, its rate ratio for reform score would be expected to increase by a factor
1.052, while holding all other variables in the model constant (see Table 3).
(3) We detect a positive relationship between educational background of the chairman
in engineering and law and scope of reforms in a country. Our results imply that if
the chairman holds a degree in engineering or law, the reform score is expected to be
1.633 or 1.448 times greater, respectively; while holding all other variables in the
model constant (see Table 3).
(4) Experience of the minister responsible for energy policy when regulator was set up
and his/her educational background seem to be other important determinants of the
27
significant relationship between length of term or education level of the minister and
scope of reforms (see Table 3).
(5) Our findings show that if the minister‟s experience in electricity industry were to
increase by one year, its rate ratio for reform score would be expected to decrease by
a factor 0.977, while holding all other variables in the model constant (see Table 3).
This result implies that a minister‟s experience in electricity industry adversely
affects the reform process.
(6) The results also show that if the minister holds a degree in economics or business,
reform score in this country is expected to be 1.667 times greater. However, if s/he
holds a degree in law, then the reform score in this country is expected to be 0.723
times smaller (see Table 3).
(7) Population of a country seems to be an important factor in the reform progress but
its impact is quite limited. According to our results, if the population of a country
were to increase by one million, its rate ratio for reform score would be expected to
increase by a factor 1.001, while holding all other variables in the model constant
(see Table 3).
(8) Being an OECD country has also a significant positive impact on reform progress. If
a country is a member of OECD, then the reform score in this country is expected to
be 1.387 times greater (see Table 3). This result may be regarded as an indication
that in countries with well-established institutions the backgrounds of the chairmen
and the ministers are much less important than in those with weaker institutions in
terms of reform progress.
(9) The results from Model 2 confirm that all institutional variables have a strong
impact on the reform progress. All coefficients in Model 2 are significant even at 1%
level (see Table 5 and Table 6).
(10)We find a positive relationship between legal system and property rights index and
reform progress in a country. If legal system and property rights index of a country
were to increase by one unit, its rate ratio for reform score would be expected to
increase by a factor 1.102, while holding all other variables in the model constant
(see Table 5).
(11)Similarly, we see a positive relationship between reform progress and polity score
and investment freedom index. If polity score or investment freedom index of a
28
expected to increase by a factor 1.038 or 1.008 respectively, while holding all other
variables in the model constant (see Table 5). While evaluating these results, it is
better to keep in mind that polity score is an indicator based on a scale from -10 to
+10, while investment freedom index ranges from 0 to 100. So, a one unit increase
in these variables does not mean the same.
(12)The most unexpected result from our study is that any improvement in civil liberties
score and political rights score of a country results in a decline in reform score of
that country. Civil liberties score and political rights score range from 1 to 7, 1
representing the highest and 7 the lowest level of freedom. If civil liberties score of a
country were to increase by one unit (that is when civil liberties become more
limited), its rate ratio for reform score would be expected to increase by a factor
1.139 (see Table 5). In the same way, if the political rights score of a country were
to increase by one unit (that is when political rights become more limited), its rate
ratio for reform score would be expected to increase by a factor 1.120 (see Table 6).
To sum up, based on our results, we reject Hypothesis 4 but fail to reject other four
hypotheses. Our results clearly show that both the background of the chairman and the
minister and institutional endowments are important determinants of how far reforms have
gone in a country. The best first chairman of a regulatory agency seems to be one with a
degree in law or engineering and one with a long period in office. The best minister
responsible for energy policy when regulator is set up is one with a degree in business or
economics and one who has as least experience in electricity industry as possible and does not
have a degree in law. This result suggests that previous involvement of a minister in
electricity industry (or his/her relations with energy bureaucracy) may limit his/her capacity to
implement reforms in power industry. It should also be noted that any improvement in the
structure of the legal system, security of property rights, democracy or investment
environment positively contributes to the scope of reforms in a country. On the other hand,
there seems to be a negative relationship between reform progress and both civil liberties and
political rights, which may prove that reforms may be limited in countries with strong civil
society institutions such as trade unions or other organized structures in the society that may
29
3. PhD research plan
As we mentioned before, the first paper has already been published in Energy Policy
(Erdogdu, 2011). At the time of writing this report, the second full draft of the second paper is
available. It will probably be submitted as a working paper to EPRG Working Paper Series. It
will also be presented at the EPRG E&E Seminar in October 2011. Besides, it will be
presented in one of the respected international academic conferences. After modifications
based on feedbacks from various sources, its final version will be prepared and submitted to
one of the respected academic journals. As for the third paper, it is still in progress and data
collection for it has recently been completed. It is expected that its first full draft will be ready
until the end of sixth term of the PhD study (June 2011). Then, it will go through the
procedures similar to those of the second paper.
Submission of the final PhD thesis is planned to take place around the beginning of the 9th term in April 2012. By the time we submit final PhD thesis, it is expected that the second and
third papers will be submitted to respected academic journals. Our target journals include
Journal of Political Economy (ISSN: 0022-3808) and World Bank Economic Review (ISSN:
0258-6770). Last few months of the PhD process (May-August 2012) is allocated to oral
Table 7. PhD research calendar
Y ears
Mont hs 10 11 12 01 02 03 04 05 06 07 08 09 10 11 12 01 02 03 04 05 06 07 08 09 10 11 12 01 02 03 04 05 06 07 08 09
First Year Modules (MP01, MP02, MP03, MP01A) 1st Paper: Literature review, data gathering and analysis 1st Paper: Write-up
First Year Report: Write-up and revisions
1st Paper: Submission to Energy Policy & review process 2nd Paper: Literature review
2nd Paper: Data gathering and analysis 2nd Paper: Write-up
2nd Paper: Submission to WP series, conferences, journal(s) 3rd Paper: Data gathering
3rd Paper: Analysis & literature review 3rd Paper: Write-up
3rd Paper: Submission to WP series, conferences, journal(s) PhD Thesis Write-up & Revisions
Oral Examination (Viva)
PhD Thesis Submission
End of funding and study leav e
4. Conclusion
As we mentioned elsewhere (Erdogdu, 2011), true value of electricity reform is a matter of
empirical testing rather than theoretical debate. Opponents of the reform may point to
spectacular reform failures (e.g. California disaster), or its advocates may try to get general
conclusions from some success stories of a few reforming countries (e.g. NordPool).
However, what is really needed is a complete study of determinants of reform within the
context of a well-defined model construction. Besides, today, there are data on electricity
market reforms going back about three decades and available data start to let us meaningfully
construct econometric models to explain reform progress in various countries. The second
paper offers both a macro and micro level econometric analysis on the possible institutional
determinants of the reform progress.
Throughout the second paper, we try to explain whether differences in institutional structures
of countries play an important role in explaining how far reforms have gone in these
countries; how specific institutional endowments of a country affect its reform performance
and, finally, whether the background of the first chairman of the regulatory agency or that of
the minister responsible for energy policy when the regulatory agency was set up have an
impact on reform progress. We focused on these issues by using empirical econometric
models to observe the impact of institutional variables on the reform progress. Cross-section
data from 51 countries was employed. As a result of the study, we found that both the
background of the chairman and the minister and institutional endowments of a country are
important determinants of how far reforms have gone in a country. Our results imply that the
best first chairman of a regulatory agency seems to be one with a degree in law or engineering
and one with a long period in office. The best minister responsible for energy policy when
regulator is set up is, on the other hand, one with a degree in business or economics and one
who has as least experience in electricity industry as possible and does not have a degree in
law. The results also suggest that any improvement in the structure of the legal system,
security of property rights, democracy or investment environment positively contributes to the
scope of reforms in a country. However, there seems to be a negative relationship between
32
To sum up, this study provides three important insights into reform process. First, it is crucial
to the reform progress that the energy minister, as one of the key policy makers, has an
educational background in business or economics. Second, the reform process advances more
rapidly if the chairman of the regulatory agency, as the principal policy implementer, has a
background in law or engineering. Finally, previous experience in electricity industry of
reformers adversely affects the reform process. So, if the reformers are selected from outside
the industry (that is, if they are not the bureaucrats from previous incumbent public
enterprise), the extent of reform grows much faster, a point that is also underlined by World
Bank (1995).
References
CAMERON, A. C. & TRIVEDI, P. K. 1998. Regression analysis of count data, Cambridge, UK ;
New York, NY, USA, Cambridge University Press.
CAMERON, A. C. & TRIVEDI, P. K. 2009. Microeconometrics using Stata, College Station, Tex.,
Stata Press.
CENTER FOR SYSTEMIC PEACE 2010. Polity IV Project: Political Regime Characteristics and
Transitions, 1800-2009. URL: http://www.systemicpeace.org/polity/polity4.htm.
ERDOGDU, E. 2010. Electricity market reform: lessons for developing counties. Cambridge, UK: Judge Business School: Library Office.
ERDOGDU, E. 2011. The impact of power market reforms on electricity price-cost margins and cross-subsidy levels: A cross country panel data analysis. Energy Policy, 39, 1080-1092.
FREEDOM HOUSE 2011. Map of Freedom in the World, 2008 Edition. Freedom House.
GWARTNEY, J. D., HALL, J. C. & LAWSON, R. 2010. Economic Freedom of the World: 2010
Annual Report. Fraser Institute.
HERITAGE FOUNDATION 2011. Index of Economic Freedom, Investment Freedom Index.
Heritage Foundation.
LITTLECHILD, S. C. & SKERK, C. J. 2004. Regulation of transmission expansion in Argentina Part I: State ownership, reform and the Fourth Line. Cambridge Working Papers in Economics,
CWPE 0464. Faculty of Economics, University of Cambridge.
WINKELMANN, R. 2008. Econometric analysis of count data, Berlin, Springer.
WOOLDRIDGE, J. M. 2009. Introductory econometrics : a modern approach, Mason, OH, South Western, Cengage Learning.
WORLD BANK 1995. Bureaucrats in business : the economics and politics of government
ownership, Oxford ; New York, Oxford University Press.