ISSN Online: 2329-3292 ISSN Print: 2329-3284
The Study in Supply Chain of Auto Parts Based on
Milk-Run
Xufeng Zhang, Lina Zou, Zhuang Hu
Beijing Wuzi University, Beijing, China
Abstract
With the rapid development of the domestic economy, the output of the automobile industry is growing dramatically. The increasing number of the suppliers, auto parts and their categories has brought more challenges to the third party automobile logis-tics provider with requirements of better service mode and quality. The poor optimal state of the original delivery route and low vehicle loading rate have a huge impact on the production effectiveness. Thus, according to this problem, a virtual automo-bile factory has been set with specific auto parts orderings with the purpose of opti-mizing the delivery route and rising the vehicle loading rate. Combining with the lo-cation of the picking points, transport frequency and the loading capacity of each ve-hicle, taboo search algorithm has been applied to the milk-run mode to help develop a better delivery route for the logistic company.
Keywords
Third Party Logistics Companies, Milk-Run, Vehicle Routing Optimization
1. Introduction of Milk-Run
The idea of the milk-run comes from the transport of milk, which is that carriers deliv-er the milk to each household unddeliv-er the predesigned route [1]. Similarly, in order to lower the vehicle transportation efficacy when taking the order from low-demand manufacturers, the shipping vehicles will leave the distribution center at the same time every day and return after all the auto parts have been loaded [2]. In this way, the JIT supplies a shipping method that according to the demand of varieties and specifica-tions, quality, quantity, time and location requirements have been realized to the high-est degree [3]. With the increasing business volume, the number of the suppliers and auto parts, the original point-to-point delivery route has become less and less effective which has risen the overall operating costs [4]. Therefore, the automobile companies How to cite this paper: Zhang, X.F., Zou,
L.N. and Hu, Z. (2016) The Study in Supply Chain of Auto Parts Based on Milk-Run. Open Journal of Business and Management, 4, 778-783.
http://dx.doi.org/10.4236/ojbm.2016.44075
Received: August 26, 2016 Accepted: October 28, 2016 Published: October 31, 2016
Copyright © 2016 by authors and Scientific Research Publishing Inc. This work is licensed under the Creative Commons Attribution International License (CC BY 4.0).
should apply and reinforce the milk-run to reach the goals of in-time delivery while avoiding material shortage and production halts. The saved shipping and storage costs will help with the supply hours and agility of the production.
2. Milk-Run Route Optimization Design for a Company
2.1. Problem Description
Taking the distribution center as demand points, vehicles leave from distribution cen-ters, respectively, to pick up cargos from different suppliers. Meanwhile arrange the picking time and routes of vehicles, which satisfying the optimal loading rate while mi-nimize the total cost of the freight.
2.2. Problem Analysis
The transportation route has a huge influence on the freight cost. Route planning usually requires a strong emphasis on the operations research and logistics transporta-tion layout. In this paper, a mathematical modeling is set to plan the milk-run route with a reasonably controlled loading rate, so as to minimize the transportation.
2.3. Methodology Selection
The precise calculation cannot be solved in general computer since the number of the suppliers is increasing. [5] However, modern heuristic algorithm, like Tabu Search, Ant Colony Algorithm, can find the optimal near-optimum solution with limited time. Be-cause of the strong local search ability of the tabu search algorithm, it can avoid the lo-cal optimal solution by using the tabu list, possessing the characteristic of global search, efficient and effective optimize at the same time. Therefore, we select some points from a real company to explain the basic principle of Tabu Search.
2.4. Tabu Search Algorithm
2.4.1. The Basic Principle of Tabu Search
Tabu search algorithm is originated from the local search algorithm and its highlight is using the Tabu search. Taboo is to ban repeat the previous work, in order to avoid the local neighborhood search being trapped in a local optimum problem, Tabu search with a Tabu table records have reached the local optimum and achieve some of the local optimal, in a search using Tabu list information not in or have a choice to search these points or process, in order to jump out of the local optimal point [6].
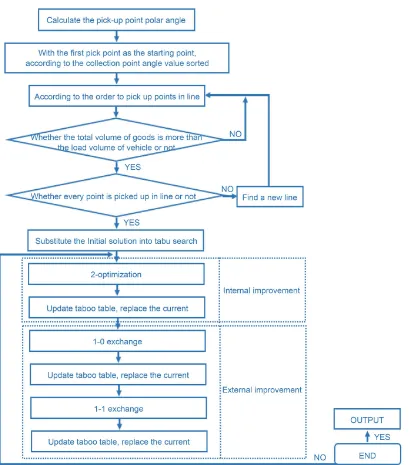
2.4.2. Tabu Search Implementation Steps
1) Random generation or using heuristic algorithm to generate initial solution, NOW X.
2) Among the neighborhoods of NOW X, N (NOW X), set a certain number of can-didate solutions. Then choose an optimal solution from those cancan-didate solutions, NEXT X, to replace the current solution, NEXT X = NOW X. Repeat the second steps.
process as shown in Figure 1).
2.4.3. Representation and Evaluation of Tabu Search Solution
1) Representation of solution: Using common arrangement method to represent the solution both suppliers and distribution center, it can show routing more intuitively and operate easily, compared with directed edge arrangement method. Ordering “0” express distribution center, “1, 2, … n” express each suppliers (E.g., There are 6 component suppliers, 2 vehicles to pick up goods. “012650340” is the routing initial so-lution which consists of two sub-lines: “0-1-2-6-5-0” and “0-3-4-0”).
[image:3.595.149.559.222.687.2]2) Evaluation of solution: The objective function is regarded as evaluation function,
thus, the smaller objective function value is, and the better solution is. When search among the neighborhood must ensure the feasibility of the solutions, which means the loading quantity of each arc in routing have to less than load limit. However, in prac-tical situation, loading rate is provided above 85% by businessman, in case of this un-written rule, the journey would be so long. Consequently, this paper assumed 3 loading rate to find out the optimal scheme.
Ordering “0” express distribution center, “1, 2, … n” express each suppliers. “i” and “j” are indicated distribution center and suppliers, dij is the distance from “i” to “j”,
ijk
x is the cost rate from “i” to “j” among cyclic path, K. The target is to minimize the running distance.
The objective function of the path optimization model is as follows:
1 1 1
min .
n n k
ij ijk
i j k
Z d X
= = =
=
∑∑∑
3. An Illustrative Example of Tabu Research Based on Milk-Run
3.1. Assumptions
Due to the traits of auto parts, the total weight of the parts is usually unable to reach the rated load. So this article assume rated load is 60 m3, the quantity of shipments of each car is supposed to be a whole company’s. After planning a route, re-planning the second route with appeared company removed. This process can be repeated until the volume schedule completed.
Ordering n v pk
= (n refers to the number of cyclic path, v refers to the quantity of
shipments, p refers to loading rate, k refers to rated load). Considering loading rate of the whole cyclic path rather than per vehicle, set tabu length L = 5, total number of ite-rations should less than 400 times. Stop iteration if iteration steps reach 200 but the re-sults have not improved. 100 neighborhoods of the current solution of each iteration are searched.
3.2. Data
1) The distance between suppliers and distribution center; the distance between suppli-ers and supplisuppli-ers; the volume of goods are shown as Table 1 (Notes: 0 refers to distri-bution center, 1 ~ 8 refer to suppliers).
2) The location of distribution center and suppliers are shown as Figure 2.
3.3. Process
1) Concrete steps• Step 1: Assuming the loading rate is 75%, from the supplier 1 start to clockwise scanning each point with scanning method, when reach the maximum volume, 70% k, stop scan-ning. There will be 4 (n = 4) initial routing: 0-1-6-8-0, 0-7-5-4-0, 0-2-0, 0-3-0.
Table 1. Distance matrix.
Point 0 1 2 3 4 5 6 7 8
0 0 18 4 16 6 17 19 9 7
1 18 0 14 15 18 13 5 14 16
2 4 14 0 12 5 11 14 13 4
3 16 15 12 0 15 14 3 15 17
4 6 18 5 15 0 5 17 7 8
5 17 13 11 14 5 0 12 9 13
6 19 5 14 3 17 12 0 13 14
7 9 14 13 15 7 9 13 0 13
8 7 16 4 17 8 13 14 13 0
volume of goods 0 24 12 15 18 21 9 18 24
Figure 2. The location of distribution center and suppliers.
“0361045208070”, so the corresponding routes are: 0-3-6-1-0, 0-4-5-2-0, 0-8-0, 0-7-0, total distance is 84.
• Assuming the loading rate is 80%, similarly, there will be 3 (n = 3) initial routing: 0-1-6-8-0, 0-7-5-4-0, 0-2-3-0, the encode result is “016807540230”. And the optim-ize result is “036104520870”, so the corresponding route are: 0-3-6-1-0, 0-4-5-2-0, 0-8-7-0, total distance is 97. And so on for 85% loading rate.
Therefore, there are 2 schemes available. Companies can accord actual situation of traffic condition, parking and toll to select the best scheme.
• Provide 4 vehicles total distance is 84. • Provide 3 vehicles total distance is 97.
2) Comparing the planning before and after
The comparison of the planning before and after is shown as Table 2. 3) Summary
Table 2. Comparing the planning before and after.
Transport mode Planned line Total transport distance Number of vehicles
Direct transportation 1-0, 2-0, 3-0, 4-0, 5-0, 6-0, 7-0, 8-0 106 8
Initial solution transportation
(Loading rate 75%) 0-1-6-8-0, 0-7-5-4-0, 0-2-0, 0-3-0 113 4 Initial solution transportation
(Loading rate 80% or 85%) 0-1-6-8-0, 0-7-5-4-0, 0-2-3-0, 0-1-6-8-0, 0-7-5-4-0, 0-2-3-0 105 3 After planning transportation
(Loading rate 75%) 0-3-6-1-0, 0-4-5-2-0, 0-8-0, 0-7-0 84 4 After planning transportation
(Loading rate 80% or 85%) 0-3-6-1-0, 0-4-5-2-0, 0-8-7-0 97 3
to reduce 5 vehicles, which occupied 62% of the original vehicles (namely the limited amount of the vehicles).
4. Conclusion
Milk-run belongs to lean supply chain management. Appling and reinforcing the milk- run is conductive to automobile industry to cut down lead time and increase autonomy and flexibility. This article, which is based on the Tabu Search algorithm, has acquired the model innovation in the matter of milk-run for auto parts, which makes the solu-tion of this kind of problems get more easier and achieve the larger degree of “Just in Time”, also avoid the material shortage occurrence, at the same time, it can realize the transportation and inventory cost savings.
References
[1] Xu, Y. (2015) Study on Milk Run Project and Route Optimization of Company S. Suzhou University, Suzhou.
[2] Lin, C.K. (2015) Research on Pathing Design and Application Based on 3PL Mixed- Milkrun. Zhejiang Sci-Tech University, Hangzhou.
[3] Zuo, X.L., Liu, Z.X. and Zheng, C.Z. (2011) Analysis and Optimization of Milk-Run Model for Auto Parts Logistics. Automotive Engineering, No. 33, 79-84.
[4] Pan, Z. (2011) Research on Vendor Managed Inventory System of Third Party Logistics Based on Milkrun Mode. Silicon Valley, No. 7, 102.
[5] Wang, A.J. and Gong, B.G. (2010) C-W Algorithm of Auto Parts Optimization of Vehicle Routing Based on Milkrun. Journal of Anhui University of Technology and Science ( Natu-ral Science), No. 2, 92-93.
Submit or recommend next manuscript to SCIRP and we will provide best service for you:
Accepting pre-submission inquiries through Email, Facebook, LinkedIn, Twitter, etc. A wide selection of journals (inclusive of 9 subjects, more than 200 journals)
Providing 24-hour high-quality service User-friendly online submission system Fair and swift peer-review system
Efficient typesetting and proofreading procedure
Display of the result of downloads and visits, as well as the number of cited articles Maximum dissemination of your research work