Munich Personal RePEc Archive
The impact of the minimum wage on
Spanish youth: Evidence from a natural
experiment
Antón, José-Ignacio and Muñoz de Bustillo, Rafael
University of Salamanca
September 2011
Online at
https://mpra.ub.uni-muenchen.de/33488/
1
T
HE IMPACT OF THE MINIMUM WAGE ONS
PANISHYOUTH
:
E
VIDENCE FROM A NATURAL EXPERIMENTJOSÉ-IGNACIO ANTÓN (janton@usal.es)
RAFAEL MUÑOZ DE BUSTILLO (bustillo@usal.es)
UNIVERSITY OF SALAMANCA (SPAIN)
ABSTRACT
This work assesses the impact of the minimum wage on youth employment,
unemployment and education enrolment in Spain. Using a
difference-in-differences approach, we take advantage of the fact that the minimum wage
for people aged 16 and 17 years old, which was approximately two thirds
the level of the standard minimum wage, was raised to reach full
convergence with the latter in a period of three years (from 1995 to 1998).
The empirical analysis suggests that this policy intervention depressed the
employment levels of the affected group, raised unemployment among them
and decreased the probability of remaining in formal education.
KEYWORDS: minimum wage, Spain, difference-in-differences, employment.
2
1.
I
NTRODUCTIONThe research on the impact of a minimum wage (MW) on labour
market performance has a long tradition in labour economics and to this day
continues to be at the core of the debate on labour market interventions,
with a myriad of works dealing with the effects of MW on different
outcomes, from employment and unemployment to human capital
formation. In spite of the vast amount of empirical evidence gathered on this
issue, there is still no consensus as to the impact of MW on the labour
market and especially on the magnitude of such effects.1 The main aim of
this article is to contribute to this body of literature by providing empirical
evidence on the impact of the increase in youth MW on the behaviour of
employment, unemployment and education enrolment among youth in Spain
during the 90s. We benefit from a natural experiment consisting of the fact
that the minimum wage for people aged 16 and 17, far below the standard
minimum wage, was raised to reach full convergence with the latter over a
period of three years (from 1995 to 1998). Using a difference-in-differences
methodology, we find that this policy reduced employment by around 3
percentage points, raised unemployment by roughly 2 percentage points and
depressed the probability of being at school by around 1.5 points.
The article unfolds in five parts that follow this introduction. In the
3
submit a detailed account of the rise in the MW and present a brief literature
review on this issue in Spain and other relevant countries where similar
changes were adopted. The third section describes the main features of the
database used in the empirical work, while the fourth explains the
methodology followed for evaluating the impact of the rise in MW. The
main results of the analysis are presented in the sixth section. The last
section, as usual, summarises and discusses the main conclusions of the
article.
2.
B
ACKGROUND AND LITERATURE REVIEW2.1. Rationale for a different and lower minimum wage for youth.
The existence of a differentiated lower minimum wage for young
workers can be defended from two different perspectives (Marinakis 2007).
From the demand side, it can be argued that young workers will most likely
have lower productivity than older workers with longer work experience
and on the job training. If that is the case, having a single MW for workers
notwithstanding their age would penalize the group of young workers as, for
the same wage, instead of younger workers firms would demand older
workers with higher productivity2. From a different perspective, the higher
the minimum wage for young workers the higher the incentive for young
4
in the EU, for example, finishing higher secondary education is a goal worth
pursuing3, a low youth minimum wage in comparison to the adult MW
would penalize leaving school early.
As we can see in Table 1, most high income countries with
Minimum Wage Legislation have a separate lower MW for young workers,
although the different cases vary. In some countries -Australia, Belgium,
Luxemburg, the UK and, notably, the Netherlands - the MW rises with age
until it converges with the adult MW from a given age: 18 in Luxemburg,
21 in the UK, Belgium and Australia and 23 in the Netherlands. In another
set of countries - Korea, the USA, France, Ireland and the Czech Republic -
the MW rate is related to both tenure in the job and age. A third group of
countries have a single lower MW for workers under a given age. Finally,
Canada, Spain, New Zealand and Portugal, after a period of enforcing
different MW for different age groups, opted for a single MW regardless of
age. There are also wide differences in terms of the age-related minimum
wage differentials, ranging from 10% in the cases of Korea and the USA (as
well as in Australia for those 20 years old) to as much as 70% for 15 year
olds in the Netherlands.
5
2.2. The Spanish case
Minimum Wage legislation in Spain dates to 1963. In the beginning,
MW legislation envisaged lower wages for young workers, although the
number of sub-minimum wages changed with the modernization of Spanish
labour law (including rising the minimum employment age to 16 in 1978).
By 1980 there were two sub-wages for young workers, one for workers aged
16 (38% of the standard MW) and another for workers aged 17 (61% of the
standard MW). In 1990, the specific wage for workers aged 16 was
eliminated, leaving a single sub-wage of 65% of the standard MW for all
workers under 18. This change implied an increase of 83% in the MW for
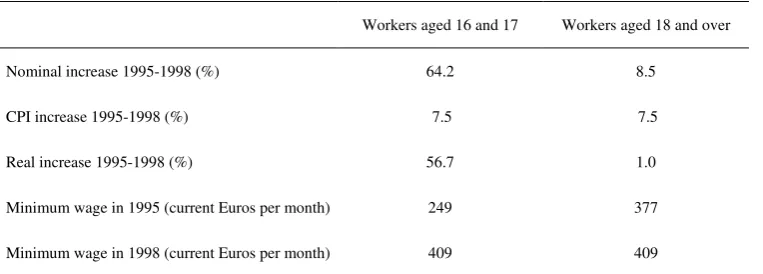
workers under 17. Finally, in 1995, one year before the general elections,
the Socialist Government decided to merge the youth MW with the standard
MW in a three year process. This decision (honoured by the subsequent
conservative government) produced a major rise of 64 % in the MW for
young workers over a three year period (Table 2). We have tracked Spanish
newspapers of the time in order to determine whether this policy measure
was announced in advance by the executive (in which case the effect of the
rise in the MW could have been anticipated in some way by employers), but
we could not find any reference to it in the main national media previous to
its approval. Therefore, to our knowledge, this intervention could
6
This change took place in a context of high employment growth, but
also of a high unemployment rate as a result of the 1993 economic crisis,
with a total unemployment rate of 23% and a youth unemployment rate
(16-19) of 50%. At that time, as well as now, Spain had a relatively low
minimum wage (35% of average wage) compared to other EU countries
(Czech 2009).
<TABLE 2 ABOUT HERE>
Several economic studies have explored the impact of the MW on
employment in Spain with, as often happens in the international literature on
the topic, conflicting results. For example, Dolado et al. (1996), using a
panel of six sectors over the period prior to the elimination of the youth rate
1967-94, conclude that a MW tended to reduce youth employment but to
raise the employment of older workers. A similar result is obtained from the
analysis performed by these authors regarding the impact of the
above-mentioned merger of MW for workers under 16 and 17 in 1990. The papers
by Pérez et al. (2002) and González et al. (2003), focused on youth
employment, conclude using different approaches that there is a negative, if
weak, impact of MW on employment. More recently, Blazquez et al. (2009)
find no strong evidence of the existence of a negative effect of MW on
youth employment rates for the period 200-2008. Finally, Cebrián et al.
(2010), report on a little used data base (Encuesta de Coyuntura Laboral) to
7
The authors conclude that the intense increase in MW that took place in the
period 2000-2008 (a 41.2% increase in MW and a 6.4 % increase in the
Katz Index) had a negative impact on employment of nearly 5%, mostly
explained by the transmission of such increases to the overall wage
architecture.
2.3. Similar experiences in other countries: Portugal and New Zealand.
Two international experiences of changes in youth MW, similar to
the ones described for Spain, are relevant to the analysis presented in this
paper. In 2001, the New Zealand MW for youth underwent a dual reform.
Firstly, the threshold marking the standard MW was reduced by two years,
from 20 to 18 years old. Secondly, the youth MW for workers 16 and 17
years old was raised in two steps to 80% of the standard MW (instead of the
previous 60%). These changes meant a wage increase of 69% for the former
group of workers (aged 18 and 19), and an increase of 41% for workers
aged 16-17. Hyslop and Stillman (2007), using a methodology of
difference-in-differences, do not find evidence of an adverse impact of the
MW rise on youth employment in the two years immediately following the
reform, although they find weak evidence of employment loss by the third
year. Their combined analysis of change in employment and working hours
allows them to conclude that the rise the youth MW produced a reduction in
the total youth-adult labour earning gap. In contrast, the authors present
8
youth unemployment, suggesting that the increase in labour supply
associated with the increase in youth MW was not matched by a
corresponding increase in youth labour demand.
The second case study refers to a country much closer to Spain,
Portugal. The Portuguese MW was not created until the overthrow of the
Salazar Dictatorship in 1974. In 1986, in order to adapt the existing youth
sub-minimum wage to the complete recognition of age 18 as the age of full
rights and duties of Portuguese citizens, there was a major change in the
structure of the sub-minimum wage consisting of the following: (1) workers
were entitled to the standard MW as from age 18 (instead of the previous
20), leading to an increase of 49.3% in MW; (2) workers under 18 were
entitled to 75% of the standard rate (instead of the previous 50%). Pereira
(2003) focuses on the former group, using a 5 year panel of firm data to
study the impact of the rise in MW on the employment of workers aged
18-19, and on slightly older workers (20-25), who can be considered as
substitutes to the group targeted by the reform. According to this author, the
increase in MW significantly reduced employment of workers 18 and 19
years old, with estimated employment-MW elasticity in the range of -0.2 to
-0.4. The author also observes the existence of a substitution effect towards
9
3.
D
ATAThe analysis presented below is based on the Economically Active
Population Survey (EAPS), the Spanish labour force survey carried out in
Spain by the National Statistics Institute starting in the 60s. This database
comprises a large sample of households and includes the main
socio-demographic characteristics of their members. Unfortunately, there is no
information available on workers’ earnings. At the time of the period of
analysis (1995-1998) the survey was carried out on a quarterly basis and had
a two-stage stratified sampling. However, only probabilistic weights for
correcting for the different probability of selection of households are
provided to researchers and, hence, fully taken into account in the analysis. 4
The sample used in the analysis comprises the cross-sectional data
corresponding to the four quarters of the year 1995 (before the policy
change) and the year 1998 (the first year with an equal MW for teenagers
and the rest of population). As the National Statistics Institute freely offers a
standard extraction of the EAPS only since 1999, we asked for a customized
sample for the period of analysis that would allow us to disaggregate the age
of individuals year by year (the standard extraction only codes age in
five-year groups). Overall, our sample comprises more than 48,000 observations
of individuals aged 16 or 17 (of whom more than 3,500 are employed and
10
and 20 years old (although, as explained below, we use two different control
groups in order to check the robustness of the results). This second group
shows employment rates and unemployment rates higher and lower than the
treated group, respectively.
All the data analysis was performed using the Stata 11.1 software.
All data and programs are available from the authors upon request.
4.
M
ETHODOLOGYThe estimation of the impact of the increase in youth MW on
employment, unemployment and school enrolment is carried out following a
difference-in-differences approach, where the treated group is the
population aged 16 and 17 and young individuals aged between 18 and 20
years old are considered as the control group. The identifying assumption is
that both groups is that both groups would have followed the same trend in
absence of the policy change (the parallel trend assumption). As mentioned
above, we examine the effects of the rise in youth MW on employment,
unemployment, training and school enrolment.
As is well-known, consistency of estimated parameters in linear
probability models (LPM) requires considerably less strong assumptions
11
assumptions are satisfied. On this basis, some authors, such as Angrist and
Pischke (2009), suggest relying on LPM estimates over the other options.
Nevertheless, when possible, we perform the estimations using both types of
procedures in order to test the robustness of the analysis.
Aiming to estimate the impact of the MW on employment, we
initially estimate the following linear model:
[1]
Where Eit is a dummy capturing whether individual i at time t is employed
or not; D98it is a fictitious variable that takes the value 0 before 1998 and 1
in 1998; D16_17it is a dummy indicating whether the individual belongs to
the population aged 16-17; is captured by another dummy, treatment, taking
the value 1 for individuals aged 16 or 17 in 1998, Xit is a vector containing
socio-economic variables (an intercept, individual characteristics and
regional and quarter dummies) and, lastly, εit is disturbance with mean zero.
The estimation of β yields the effect of treatment on the treated (ETT).
Analogously, we also carry out the estimation using the following probit
model:
[2]
where pit is the probability of employment conditional on explanatory
variables and Φ(.) is the normal cumulative distribution function. As pointed
98 16 _17
it it it it it it
E =αD +λD +βtreatment +θX +ε
(
98 16 _17)
it it it it it
12
out by Puhani (2008), the ETT in a model such as this is identified by the
expression5
[3]
As suggested by this same author, we estimate the standard errors of this
term using the Delta method. That is, the variance in the ETT can be written
as
[4]
where G denotes the gradient of equation [3] with respect to the parameters
and V is the covariance matrix of the parameters of model [2].
The effect of the policy on unemployment is studied using an
analogous model. We estimate the impact of the increase in youth MW on
unemployment probability conditional to being active (that is, in the labour
force, either employed or unemployed). We cannot correct for the possible
bias associated with selection into activity, as we could not find a suitable
exclusion restriction for the selection equation (a variable affecting the
probability of being in the labour force but independent of the probability of
unemployment conditioned on activity). Therefore, our results can only be
considered representative of the active population.
(
it)
(
it)
ETT = Φ α λ β θ+ + + X − Φ α λ θ+ + X
( ) '
13
Finally, in a specification very similar to the previous ones we also
try to assess the effect of the increase in youth MW on the probability of
staying in school.
The standard definitions of employment and unemployment
correspond to those stated by the International Labour Organization. In
order to test for the robustness of the results, firstly, we consider two
definitions of employment (including and excluding employers, the
self-employed and family workers from the sample) and unemployment
(including and excluding discouraged workers in the group of unemployed
individuals). In addition, we use alternative control groups comprising
young people aged between 18-20 and 18-24 years old.
5.
R
ESULTSThe main descriptive statistics of the analysis are presented in Table 3. As
can be inferred from the Table, the number of observations involved in the
analysis is large. In the case of the analysis of employment, people who are
in conscription are excluded, while they are considered in the case of
education (as being enrolled in formal education was one of the possible
causes for postponement of military service). Note that the number of
groups considered is two (a treated and an untreated one), so it is not
14
two-group case, as suggested by Wooldridge (2006; 18), this issue (the
impossibility of clustering in order to take into account within-group
correlation) is indistinguishable from the parallel trend assumption present
in any difference-in-differences analysis (that is, we cannot be sure that any
observed difference in means is entirely caused by the policy change).
<TABLE 3 ABOUT HERE>
The results of the difference-in-differences analysis are displayed in
Table 4. Firstly, the raw difference-in-differences (given by the LPMs)
indicates a negative effect of the rise in MW on employment (-1.9
percentage points) and enrolment in formal education (-1.6 percentage
points) and a positive impact on unemployment (2.5 percentage points).
Secondly, the adjusted difference-in-differences estimates reveal that the
direction of such impacts holds once we control for a set of observable
characteristics. The effect on employment is significant and negative at the
1% level, at -3 percentage points in the LPM and -2.6 percentage points in
the probit model, while the positive effect on unemployment, significant at
the 5% level, is roughly 3 percentage points in both models. Finally, the rise
in the MW seems to have negatively affected the probability of being in
formal education. The LPM estimate, significant at the 1% level, suggests a
negative impact of 1.6 points on enrolment, whereas the probit estimate,
15
The estimate parameters suggest an employment-MW elasticity of
roughly -0.5 (using the probit results), a figure that is slightly above the
findings for the Portuguese case reviewed in the second section of the paper.
As employment rates among the affected group were extremely low (below
10%) at the time of the intervention, it is also informative to compute the
semi-elasticity (that is, the change in employment in percentage points
divided by the percentage change in the MW). The corresponding figure is
remarkably lower: -0.05 (from the probit estimate).
<TABLE 4 ABOUT HERE>
In order to test the robustness of our results, we repeat the analysis
considering a wider control group, people aged between 18 and 24 years
old, and we conduct the analysis for an alternative definition of the
employed population that excludes employers, the self-employed and family
workers and an alternative concept of unemployment that includes
discouraged workers among the unemployed instead of among the inactive
population. The results of these calculations are presented in Table 5 and
they corroborate the significance level, sign and magnitude of the estimates
in Table 4.
16
5.
C
ONCLUSIONSThis article has analysed the effect of MW on employment,
unemployment and education enrolment among people aged 16 and 17 in
Spain. We have exploited a natural experiment provided by the existence of
a lower MW for this group up to 1995, when, over three years, it was raised
to reach full convergence with the standard MW. The empirical analyses,
based on the difference-in-differences methodology and taking the
population between 18 and 20 years old as the control group, show that this
policy intervention had a detrimental effect of around three percentage
points on employment among the affected group, raised unemployment by
roughly 2 percentage points and diminished school enrolment barely 1.5
percentage points. In order to test the robustness of the results of the main
analysis we repeated the analyses using an alternative control group (18-24
year olds) and alternative definitions of employment and unemployment. In
all cases, the results obtained have held for both LPM and probit
specifications.
The evidence presented in the paper is quite consistent with the
findings of Pereira (2003) for Portugal but is at odds with the results of
Hyslop and Stillman (2007) for New Zealand. The main corollary of the
17
have contributed to perpetuate the high rates of school failure and early
school leaving and to depress the labour market opportunities of this group.
1 As mentioned, the literature is very extensive. See, among many others, the evidence
collected and reviewed by Card and Krueger (1995), Boeri and van Ours (2008), Neumark and Wascher (2008) and Vaughan-Whitehead (2010).
2 It has to be acknowledge, though, that in low productivity sectors ( eg. retail) a youth MW
set too low may risk displacement of adults paid a higher adult MW.
3 Reducing school drop-out rates to below 10% is one of the targets for the Europe 2020
Strategy of the European Union, for example.
4 For more details on the questionnaire and methodology of the EAPS see National
Statistics Institute (2005) and other documents available on the website of the National
Statistics Institute (http://www.ine.es/jaxi/menu.do?type=pcaxis&path=%2Ft22/e308_mnu&file=inebase&L=
0).
5 Note that the caution in the estimation of the parameter for interaction terms in nonlinear
18
R
EFERENCESAi, C. and Norton, E.C. (2003). Interaction terms in logit and probit models.
Economic Letters, 80; 123-9.
Angrist, J.D. and Pischke, J.S. (2009). Mostly harmless econometrics: an
empiricist’s companion. Princeton, New Jersey: Princeton University Press.
Australian Fair Pay Commission (2007). Review of junior and training
wages in the Australian labour market. Issues Paper, September, Australian
Fair Pay Commission. Available at http://www.fairpay.gov.au.
Blázquez, M., Llorente, R. and Moral, J. Forthcoming. Minimum Wage and
Youth Employment Rates in Spain: New Evidence for the Period
2000-2008. Revista de Economía Aplicada.
Boeri, T. and van Ours, J. (2008). The economics of imperfect labor
markets. Princeton, New Jersey: Princeton University Press.
Card, D. and Krueger, A.B. (1995). Myth and measurement: the new
economics of the minimum wage. Princeton, New Jersey: Princeton
University Press.
Cebrián, I., Pitarch, J., Rodríguez, C. and Toharia, L. (2007). Análisis de los
Efectos del Aumento del Salario Mínimo sobre el Empleo de la Economía
19
Czech, B. (2009). Minimum Wage in January 2009. Statistics in Focus.
Population and Social Conditions, 29/2009. Available at
http://epp.eurostat.ec.europa.eu/cache/ITY_OFFPUB/KS-QA-09-29/EN/KS-QA-09-029-EN.PDF.
Dolado, J., Kramarz, F., Machin, S., Manning, A., Margolis, D., Teulings,
C., Saint-Paul, G. and Keen, M. (1996). The Economic Impact of Minimum
Wages in Europe. Economic Policy, 11; 317-72.
González, I., Jiménez-Martín, S. and Pérez, C. (2003). Los efectos del
salario mínimo sobre el empleo juvenil en España: nueva evidencia con
datos de panel. Revista Asturiana de Economía, 27; 147-68.
Hyslop, D. and Stillman, S. (2007). Youth minimum wage and the labour
market in New Zealand. Labour Economics, 14; 201-30.
Low Pay Commission (2010). National Minimum Wage. Low Pay
Commission Report 2010. London: The Stationery Office Limited.
Available at
http://www.lowpay.gov.uk/lowpay/report/pdf/LPC_Report_2010.PDF.
Marinakis, A. (2007). ¿Un salario mínimo específico para los jóvenes?
International Labour Organization Working Paper, Regional Office for
Latin America and the Caribbean. Available at
20
National Statistics Institute (2005). Economically Active Population Survey.
Design of the survey and assessment of the quality of the information.
Technical Report, National Statistics Institute. Available at
http://www.ine.es/en/docutrab/epa05_disenc/epa05_disenc_en.pdf.
Neumark, D. and Wascher, W.L. (2008). Minimum wages. Massachusetts:
The MIT Press.
Pereira, S.C. (2003). The impact of minimum wages on youth employment
in Portugal. European Economic Review, 47: 229-44.
Pérez, C., González, I. and De Prada, M.D. (2002). Los efectos simultáneos
del salario mínimo sobre el empleo, la participación y la tasa de paro de los
adolescentes españoles. Moneda y Crédito, 215; 225-246.
Puhani, P.A. (2008). The treatment effect, the cross difference and the
interaction term in nonlinear ‘difference-in-differences’ models. IZA
Discussion Paper No. 3478.
Quintini, G. and Martin, S., 2006. Starting Well or Losing their Way? The
Position of Youth in the Labour Market in OECD Countries.OECD Social,
Employment and Migration Working Paper No. 39.
Vaughan-Whitehead, D. (Ed.) (2010). The Minimum Wage Revisited in the
21
Wooldridge, J.M. (2006). Cluster-sample methods on applied econometrics:
an extended analysis, mimeo. Available at
https://www.msu.edu/~ec/faculty/wooldridge/current%20research/clus1aea.
22
Table 1. OECD countries with different minimum wages for youth
Countries Age and % of standard MW wage
Australia
16 years old: 50% 17 years old: 60% 18 years old: 70% 19 years old: 80% 20 years old: 90%
Belgium
< 17 years old: 70 % 17 years old: 76% 18 years old: 82% 19 years old: 88% 20 years old: 94%
Czech Republic With less than 6 month in the job and <21 years old: 90 %
France
With less than 6 month in the job: < 17 years old: 80 %
17 years old: 90 %
Ireland
< 18 years old: 70%
18 years old and over and first job or continuation in employment: first year, 80 %; second year, 90 %.
Korea < 18 years old: 90% reduced rate the first 6 months
Luxembourg < 17 years old : 75% 17 years old: 80%
Netherlands
15 years old: 30 % 16 years old: 34.5% 17 years old: 39.5% 18 years old: 45.5% 19 years old: 52.5% 20 years old: 61.5% 21 years old: 72.5% 22 years old: 85%
New Zealand < 18 years old: 80%
Poland < 18 years old: 85 %
Slovak Republic < 18 years old: 75%
Turkey < 16 years old: 85%
United Kingdom 16-17 years old: 61 % 18-20 years old: 82 %
United States < 20 years old, 41 % during the first 90 days*
* The 1996 Amendments to the Fair Labor Standard Act allow employers to pay a youth minimum wage of not less than US$4.25 an hour, compared with the standard Federal MW of US$7.25 an hour in 2010.
23
Table 2. Increase in standard and youth MW 1995-1998
Workers aged 16 and 17 Workers aged 18 and over
Nominal increase 1995-1998 (%) 64.2 8.5
CPI increase 1995-1998 (%) 7.5 7.5
Real increase 1995-1998 (%) 56.7 1.0
Minimum wage in 1995 (current Euros per month) 249 377
Minimum wage in 1998 (current Euros per month) 409 409
24 Table 3. Main descriptive statistics of the database
Total population between 16 and 20 years old
People aged 16 and 17 years old
People aged between 18 and 20 years old
Mean deviation Standard Mean deviation Standard Mean Standard deviation
Employed (over people not
conscripted) 0.163 0.369 0.090 0.286 0.209 0.407
Employed (alternative definition) 0.139 0.346 0.073 0.261 0.180 0.384
Unemployed 0.462 0.499 0.508 0.500 0.448 0.497
Unemployed (alternative definition) 0.461 0.498 0.505 0.500 0.447 0.497
In formal education (over total
population) 0.582 0.493 0.694 0.461 0.515 0.500
Aged 16 or 17 years old 0.377 0.485 --- --- --- ---
Year 1998 0.477 0.499 0.470 0.499 0.482 0.500
Treated 0.177 0.382 0.470 0.499 0.000 0.000
Age 18.1 1.4 16.5 0.5 19.0 0.8
Squared age 328.8 50.9 273.1 16.5 362.6 31.2
Female 0.489 0.500 0.489 0.500 0.488 0.500
No education 0.022 0.146 0.020 0.140 0.023 0.149
Primary education 0.083 0.276 0.102 0.302 0.072 0.259
Upper Secondary education 0.331 0.471 0.134 0.340 0.450 0.498
University education 0.002 0.043 0.000 0.008 0.003 0.054
Married 0.014 0.119 0.006 0.080 0.019 0.137
Household size 4.7 1.3 4.7 1.3 4.7 1.4
Squared household size 23.7 15.4 23.7 15.2 23.7 15.5
Number of children aged 5 years old
or less 0.075 0.302 0.087 0.320 0.068 0.291 Number of children aged between 6
and 15 years old 0.537 0.726 0.647 0.772 0.470 0.689
Observations 127,380 40,317 79,063
25 Table 4. Results of the econometric analysis
Raw difference-in-differences Adjusted difference-in-differences
Effect on employment
LPM -0.019 *** -0.030 ***
(0.005) (0.004)
R2 0.025 0.344
Probit -0.011 *** -0.026 ***
(0.004) (0.005)
Pseudo-R2 0.030 0.154
Observations 123,955 123,955
Effect on unemployment
LPM 0.025 * 0.030 **
(0.015) (0.014)
R2 0.008 0.040
Probit 0.026 * 0.031 **
(0.015) (0.015)
Pseudo-R2 0.006 0.029
Observations 36,497 36,497
Effect on being enroled in formal education
LPM -0.016 *** -0.016 ***
(0.006) (0.006)
R2 0.033 0.141
Probit -0.010 * -0.013 *
(0.006) (0.007)
Pseudo-R2 0.024 0.110
Observations 127,380 127,380
Note:
*** Significant at the 1% level; ** significant at the 5% level; * significant at the 10% level.
Robust standard errors between parentheses. In the probit models, standard errors of the difference-in-differences estimates are computed using the Delta method.
In probit models, we report the marginal effect evaluated at regressors’ averages.
26
Table 5. Results of the econometric analysis for alternative definitions of employment and unemployment and a different control group
Raw difference-in-differences Adjusted difference-in-differences
Effects on employment (alternative definition)
LPM -0.017 *** -0.027 ***
(0.004) (0.004)
Probit -0.007 ** -0.020 ***
(0.004) (0.005)
Effects on unemployment (alternative
definition)
LPM 0.025 * 0.030 **
(0.015) (0.014)
Probit 0.026 * 0.031 **
(0.015) (0.015)
Control group: people aged 18-24 years old
Effect on employment
LPM -0.029 *** -0.042 ***
(0.004) (0.004)
Probit -0.013 *** -0.042 ***
(0.004) (0.007)
Effect on unemployment
LPM 0.020 0.024 *
(0.013) (0.013)
Probit 0.023 * 0.028 **
(0.013) (0.013)
Effect on being enroled in formal education
LPM -0.013 ** -0.014 **
(0.006) (0.005)
Probit -0.009 * -0.015 **
(0.005) (0.006) Note:
*** significant at the 1% level; ** significant at the 5% level; * significant at the 10% level.
Robust standard errors between parentheses. In the probit models, standard errors of the difference-in-differences estimates are computed using the Delta method.
In probit models, we report the marginal effect evaluated at regressors’ averages.