Munich Personal RePEc Archive
The King Reports, Independent
Non-Executive Directors and Firm
Valuation on the Johannesburg Stock
Exchange
Ntim, Collins G.
29 August 2011
Online at
https://mpra.ub.uni-muenchen.de/45812/
Electronic copy available at: http://ssrn.com/abstract=1974116 Electronic copy available at: http://ssrn.com/abstract=1974116
The King Reports, Independent Non-executive Directors and Firm Valuation on the Johannesburg Stock Exchange
Collins G. Ntim*
Accounting and Finance, Business School University of Glasgow
Glasgow, UK
Corporate Ownership and Control, Vol. 9, No. 1, 2011, Forthcoming.
*
Address for correspondence: Accounting and Finance, Business School, University of Glasgow, West Quadrangle, Gilbert Scott Building, Glasgow, G12 8QQ, UK. Tel: +44 (0) 141 330 7677. Fax: +44 (0) 141
Electronic copy available at: http://ssrn.com/abstract=1974116 Electronic copy available at: http://ssrn.com/abstract=1974116
The King Reports, Independent Non-executive Directors and Firm Valuation on the Johannesburg Stock Exchange
Abstract
South Africa (SA) has pursued corporate governance reforms in the form of the 1994 and 2002 King Reports. This paper examines the association between the presence of independent non-executive directors (INEDs) and market valuation of a sample of 169 firms listed on the Johannesburg Stock Exchange (JSE) in SA from 2002 to 2007. Our results suggest a statistically significant and positive relationship between the presence of INEDs and firm valuation. By contrast, we find no statistically significant association between the presence of non-executive directors (NEDs) and firm valuation. Our findings are robust across a number of econometric models that control for different types of endogeneity problems, non-linear associations and firm valuation proxies. Our findings have important policy and regulatory implications. Whereas our evidence that more independent corporate boards’ impacts positively on firm valuation provides support for the recommendations of the King Reports, it shows that to be meaningful, director independence has to be more carefully and strictly defined.
Keywords King reports, Corporate governance, Firm valuation, Independent non-executive
1
1.Introduction
In this paper, we investigate the effect of the presence of independent non-executive
directors (INEDs) on market valuation of firms listed on the Johannesburg Stock Exchange
(JSE) in South Africa (SA). Close to two decades of corporate governance (CG) reforms
have been embarked on in SA, primarily in the form of the 1994 and 2002 King Reports. A
broader objective of the King Reports has been to raise CG standards in SA firms
(Armstrong et al., 2006; Ntim et al., 2011a). A more specific aim of the reforms, however,
has been to improve firm valuation by enhancing the independence and monitoring capacity
of SA boards of directors (Kakabadse and Korac-Kakabadse, 2002; Ntim et al., 2011b). A
major proxy for corporate boards’ independence and monitoring capacity is the proportion
of outside directors (INEDs) (Fama, 1980; Fama and Jensen, 1983a, b; Lipton and Lorsch,
1992; Jensen, 1993). In fact, the ongoing extensive public policy (Pfeffer, 1973; Fama,
1980; Lipton and Lorsch, 1992; Jensen, 1993) and academic (Baysinger and Butler, 1985;
Baysinger and Hoskisson, 1990; Dalton et al., 1998; Nicholson and Kiel, 2003; Al-Najjar
and Hussainey, 2009) debate on the role and effectiveness of INEDs suggests that the
presence of INEDs on corporate boards may influence firm value.
However, and whereas there is a theoretical agreement that INEDs perform crucial
roles in improving corporate monitoring and valuation (Fama, 1980; Jensen, 1993;
McDonald et al., 2008), the empirical evidence on the effect of the presence of INEDs on
firm valuation is mixed. A number of reasons, however, have been suggested that may
account for the conflicting results of prior studies. Firstly, there is the issue of clearly
defining who constitutes an INED, with most past studies simply classifying all outside
directors as non-executive directors (NEDs) (Hermalin and Weisbach, 1991; Weir and
2
connections with corporate executives (Zahra and Stanton, 1988; Bozec, 2005; Gupta and
Fields, 2009), which can impair their independence, and thereby their ability to effectively
advise, monitor and discipline management (Vafeas and Theodorou, 1998; Jiraporn et al.,
2009). This suggests that a much subtle and stricter definition of who is an INED has to be
introduced if her/his independence and monitoring capacity is not to be compromised.
Secondly, past studies have been criticised for potential methodological deficiencies,
with most of them mainly using ordinary least square regressions (OLS), in addition to not
sufficiently accounting for endogeneity problems (El Mehdi, 2007; Kyereboah et al., 2006;
Sunday, 2008; Sanda et al., 2010), and thereby leading to spurious results. Thirdly, it has
been argued that the association between INEDs and firm valuation may not just differ by
company-level features, but also by differences in country-level CG and institutional
characteristics (Ho and Williams, 2003; Haniffa and Hudaib, 2006; Mangena and
Tauringana, 2008; Sanda et al., 2010). Despite this development, existing studies
examining the effect of the presence of INEDs on firm valuation are mainly concentrated in
a few developed countries that exhibit relatively similar institutional settings (Baysinger
and Butler, 1985; Baysinger & Hoskisson, 1990; Rosenstein and Wyatt, 1990; Bhagat and
Black, 2002; Kiel and Nicholson, 2003; Ben-Amar and Zeghal, 2011).
With respect to the African setting, a number of studies have analysed the impact of
CG structures on a number of issues, such as financing decisions of firms
(Kyereboah-Coleman and Biekpe, 2006a; Abor, 2007; Abor and Biekpe, 2007), incidences of listing
suspensions (Mangena and Chamisa, 2008) and dividend performance (Bokpin, 2011). A
limited number of studies have also investigated the effects of different CG mechanisms,
such as the frequency of board meetings (El Mehdi, 2007; Ntim and Osei, 2011), ownership
3
2003; Kyereboah-Coleman et al., 2006) and board composition (Kyereboah-Coleman and
Biekpe, 2006b; Sunday, 2008) on corporate performance with equally inconclusive results.
Apart from apparent conflicting findings and methodological weaknesses that have been
highlighted, an additional problem with these studies is the excessive use of limited
samples of firms[1], and thereby making generalisation of findings difficult.
However, it is reasonable to argue that in developing economies with different CG
practices and institutional settings (as will be further elaborated), the effectiveness of
INEDs may vary, and therefore the relationship between INEDs and firm valuation can be
expected to be different from what has been found in the more advanced economies. Thus,
an investigation of the effect of the presence of INEDs on firm value in emerging African
markets, where there is a severe absence of reliable empirical evidence will be crucial in
offering a more complete insights on the impact of INEDs on firm valuation (Ho and
Williams, 2003; Haniffa and Hudaib, 2006; Mangena and Tauringana, 2008).
Therefore, and in this paper, we examine the association between the presence of
INEDs and firm valuation for a sample of SA listed firms. The country offers an interesting
setting to investigate the effect of INEDs on firm valuation. In line with other Anglo-Saxon
economies, SA has carried out CG reforms, mainly in the shape of the King Reports with
the key aim of improving the independence and monitoring capacity of corporate boards
(Kakabadse and Korac-Kakabadse, 2002; Ntim, 2009; West, 2009; Ntim et al., 2011a). As
will be further elaborated, and with particular respect to the composition of SA corporate
boards, the 2002 King Report sets a much clearer and stricter test for classifying directors
into executives, NEDs and INEDs for listed firms to comply with.
The SA corporate setting, however, has unique features, including high institutional
4
with corporate regulations and shareholder activism (Bar et al., 1995; Ntim and Osei, 2011).
High block ownership, for example, can impair the efficacy of the market for corporate
control (Arstmtrong et al., 2006; Ntim et al., 2011a, b). This can arguably have adverse
implications on whether companies will voluntarily comply with and disclose CG rules,
including those relating to the appointment of INEDs, and thereby potentially limiting the
ability of a voluntary code to enhance CG standards by improving the independence and
monitoring capacity of SA corporate boards. Our contention, therefore, is that the rich
research setting in terms of variations with matured economies, the recent CG reforms
pursued and the acute lack of prior evidence provides a strong justification to investigate
the association between the presence of INEDs and market valuation of SA listed firms.
We contribute to the existing literature in many ways. Firstly, using a sample of 169 SA
listed firms from 2002 to 2007, we offer evidence on the association between the presence
of INEDs and firm valuation. As far as we are aware, it represents one of the first attempts
at quantifying the effect of the presence of INEDs on corporate boards on firm valuation
within an African setting, with specific regard to SA, and therefore critically extends the
literature to that continent. It also contributes to the largely matured economies-based
literature on the relationship between the presence of NEDs and firm valuation. Secondly,
and innovatively, we show that INEDs who meet a much stricter independence test
positively influence firm valuation. Thirdly, we distinctively investigate the existence of
potential non-linear relationship between INEDs and firm valuation. Fourthly, and different
from most past studies, we rely on econometric techniques that adequately account for
different types of endogeneity problems, including fixed-effects, as well as use different
5
Our findings suggest a statistically significant and positive association between the
presence of INEDs and firm valuation. In contrast, we find no statistically significant
relationship between the presence of NEDs and firm valuation. Our results are robust across
a raft of econometric models that address different kinds of endogeneity problems and firm
valuation proxies. Our results provide empirical support for agency theory, which indicates
that greater independence reduces agency problems by improving the ability of corporate
boards to effectively advise, monitor and discipline corporate executives, and thereby
enhancing market valuation.
The remainder of the paper is organised as follows. Section 2 offers a brief
overview of the CG reforms contained in the King Reports, INEDs and the SA corporate
setting. Section 3 reviews the prior theoretical and empirical literature on the effect of the
presence of INEDs on firm valuation. Section 4 presents the research design. Section 5
reports empirical analyses, whereas section 6 contains concluding remarks.
2. The King reports, INEDs and the SA corporate setting
There is a consensus that the introduction of the King Reports explicitly
institutionalised CG practices in SA (West, 2009; Ntim et al., 2011a). This began with the
publication of the first King Report (King I) in 1994 (King Report, 2002; Ntim et al.,
2011b). The recommendations of King I were mainly influenced by those of the UK’s
Cadbury Report of 1992 (Mangena and Chamisa, 2008; Ntim and Osei, 2011). For instance,
and in line with the Cadbury Report, King I recommended an Anglo-Saxon style single-tier
board of directors, consisting of executive directors and NEDs, operating within a voluntary
CG compliance framework (King Report, 2002; Armstrong et al., 2006). With particular
respect to NEDs, and similar to the Cadbury Report, it emphasised the special importance
6
Unlike Cadbury, however, it recommended that SA corporate boards should have at least
two rather than three NEDs of adequate calibre and independence.
Also, and unlike the Cadbury Report, which specified that at least two of the NEDs
should be independent, King I did not clearly define who constitutes independent director
or the number of independent NEDs (INEDs) that SA corporate boards should have (West,
2009; Ntim, 2009). King I also failed to insist on a truly INED to chair SA corporate boards
(King Report, 2002; Kakabadse and Korac-Kakabadse, 2002). Arguably, these deviations
from the Cadbury Report also increased potential conflicts of interests and impaired board
independence and monitoring (King Report, 2002; Ntim et al., 2011a, b). As a result, King
I was revised and replaced with a second King Report (King II) in 2002 with the aim of
overcoming some of the weaknesses that have been outlined with King I.
King II proposed several changes with regard to board composition. Firstly, and
unlike King I, King II provided a clear classification of directors into executives, NEDs and
INEDs with a stricter definition[2] of director independence (King Report, 2002;
Kakabadse and Korac-Kakabase, 2002; Ntim, 2009). Second, and instead of two NEDs,
King II recommended that the board should preferably consist of a majority of NEDs
(Armstrong et al., 2006; West, 2009). Thirdly, a majority of the NEDs should also be
independent (i.e., INEDs) of management so that shareholders interests (including minority
interests) can be better protected (King Report, 2002; Ntim et al., 2011b). Fourthly, and to
ensure balance of power and authority in company decision-making, the chairman of the
board should be an INED (King Report, 2002; Mangena and Chamisa, 2008). The SA
corporate context is, however, uniquely characterised by high block and institutional
ownerships, largely in the form of complicated cross-shareholdings and tall pyramidical
7
1995;Ntim et al., 2011a). Consequently, critical concerns have been raised as to whether,
given the SA corporate setting, a voluntary CG regime like King II will be effective in
improving CG standards in the form of greater director independence and capacity to
monitor corporate executives. Therefore, our objective is to examine whether King II
recommendations relating to INEDs do influence firm valuation in SA.
3. INEDs and firm valuation: theory, evidence and hypothesis development
A CG mechanism that the theoretical literature suggests can be used in reducing
agency and information asymmetry problems in modern corporations is the appointment of
INEDs (Fama 1980; Fama and Jensen, 1983a, b; Lipton and Lorsch, 1992; Jensen, 1993).
However, there are two main contrasting views with respect to INEDs: those who are in
favour of more INEDs on corporate boards and those who prefer more executive directors
(Yermack, 1996; Nicholson and Kiel, 2003). Those who support more INEDs on corporate
boards usually base their arguments on a number of theories, including agency, resource
independence, information asymmetry and reputation signaling (Pfeffer, 1973; Baysinger
and Hoskisson, 1990; Al-Najjar and Hussainey, 2009). Agency theory suggests that boards
dominated by executive directors (insiders) are less accountable (Fama, 1980; Fama and
Jensen, 1983a, b; Sonnenfeld, 2002). In contrast, INEDs possess a number of features. First,
they bring independent judgment to board decisions (Baysinger and Hoskisson, 1990; Ntim,
2009), which can impact positively on firm valuation. In particular, greater independence
associated with INEDs grants them increased capacity to advise, monitor and discipline
management to improve firm value by reducing managerial opportunism without fear or
favour (Vafeas and Theodorou, 1998; Bhagat and Black, 2002; Jiraporn et al., 2009).
Second, they provide their firms’ with resources in the form of experience, expertise,
8
which can enhance firm valuation. Third, the existence of competitive and efficient
managerial labour markets both within and outside the firm ensures that INEDs inherently
perform their monitoring function more effectively (Fama, 1980; Fama and Jensen, 1983a),
and thereby improve firm value. Fama (1980) and Fama and Jensen (1983a, b) argue that
once top internal management gains control of a corporate board, they are more likely to
connive and collude among themselves to engage in opportunistic activities, including
expropriating shareholders’ wealth. On the other hand, it has been suggested that the
possibility of such internal managerial connivance might be reduced, and the viability of
the board as a market-induced mechanism for low-cost transfer of control might be
enhanced, by the addition of INEDs (Fama, 1980, Fama, 1983a; Gupta and Fields, 2009).
Finally, it has been argued that the appointment of INEDs helps in reducing
information asymmetry by credibly signalling insiders’ intent to treat outside or potential
shareholders fairly, and by implication, guaranteeing the safety of their investment
(Hermalin and Weisbach, 1991; Al-Najjar and Hussainey, 2009). It also signals to investors
insiders’ intent to rely on expert advice, as well as their appreciation of the importance of
separating the decision-making and control functions (Fama, 1980; Fama and Jensen,
1983a, b; Jensen, 1993; Dalton et al., 1998), which can impact positively on firm valuation.
However, relying on stewardship theory, opponents argue that corporate boards
dominated by INEDs may impact negatively on firm value (Baysinger and Hoskisson, 1990;
Weir and Laing, 2000; Bozec, 2005). Weir and Laing (2000) contend that INEDs often
command less knowledge about the business and find it too difficult to understand the
complexities of the company. This problem is exacerbated by the fact that INEDs are
usually part-timers who normally also sit on boards of other companies (Bozec, 2005;
9
monitoring and disciplining duties (Lipton and Lorsch, 1992; Weir et al., 2002). By
contrast, high levels of executive directorships are associated with high access to
information that leads to high quality decision-making (Zahra and Stanton, 1988; Weir et
al., 2002; Nicholson and Kiel, 2003), with positive consequences firm valuation. Further, it
has been argued that corporate boards dominated by INEDs tend to stifle managerial
initiative and strategic actions (Pfeffer, 1973; Baysinger and Butler, 1985; McDonald et al.,
2008), which arise from excessive managerial supervision (Baysinger and Hoskisson, 1990;
Haniffa and Hudaib, 2006), and thereby leading to lower market valuation.
Consistent with the conflicting nature of the theoretical literature on INEDs, prior
empirical evidence regarding the relationship between the presence of INEDs and firm
valuation is mixed (Baysinger & Hoskisson, 1990; Rosenstein and Wyatt, 1990; Yermack,
1996; Kiel and Nicholson, 2003; Sunday, 2008). A strand of the empirical literature reports
that boards dominated by INEDs are associated with higher market valuation (Kiel and
Nicholson, 2003; Gupta and Fields, 2009). Using a sample of 311 UK listed firms from
1994 to 1996, Weir et al. (2002) report a positive relationship between the percentage of
INEDs and firm value. Gupta and Fields (2009) examine a US sample of 744 INED
resignations from 1990 to 2003 to ascertain the value that the market places on board
independence. They report that, on average, the announcement of INED resignations result
in 1.22% loss in a firm’s market value. This suggests that investors value board
independence as independent boards are associated with greater monitoring of managerial
behaviour (Fama, 1980; Fama and Jensen, 1983a, b; Jensen, 1993).
Of close importance to this study, Ho and Williams (2003) find a statistically
significant and positive link between the presence of INEDs and a firm’s physical and
10
of Ho and Williams (2003), Mangena and Chamisa (2008) report a negative association
between the presence of INEDs and the incidences of firm suspensions from the JSE in a
sample of 81 firms from 1999 to 2005. This suggests that SA listed firms with a higher
presence of INEDs are less likely to be suspended from the stock exchange. Abor (2007)
and Abor and Biekpe (2007) report a positive link between INEDs and financing decisions
for a sample of Ghanaian listed firms. Similarly, Kyereboah-Coleman (2006b) and
Kyereboah-Coleman et al.(2006) find a positive association between INEDs and firm value
for a sample of Ghanaian listed firms. Further, El Mhendi (2007) and Mangena and
Tauringana (2008) report evidence, which is entirely consistent with prior research that
boards dominated by INEDs are highly valued for a sample of Tunisian and Zimbabwean
listed firms, respectively.
By contrast, a group of researchers reports that the presence of INEDs is negatively
correlated with firm valuation (e.g., Yermack, 1996; Agrawal and Knoeber, 1996; Laing
and Weir, 1999; Bozec, 2005; Kyereboah-Coleman, 2007). In a sample of 25 Canadian
firms from 1976 to 2005, Bozec (2005) finds that the relationship between the presence of
INEDs and firm valuation is negative. Using a sample of 47 Kenyan listed firms over the
1999-2003 period, Kyereboah-Coleman and Biekpe (2006a) find that the presence of
INEDs is negatively related to a firms’ financing decisions. Similarly, Sanda et al. (2010)
report that Nigerian firms with a low percentage of INEDs were valued higher than those
with more INEDs. This suggests that whilst INEDs can bring independence, objectivity and
experience to bear upon board decisions (Gupta and Fields, 2009; Ben-Amar and Zeghal,
2011), they may also stifle managerial initiative through excessive monitoring (Haniffa and
11
A third stream of empirical studies (Vefeas and Theodorou, 1998; Weir and Laing,
2000; Haniffa and Hudaib, 2006; Bokpin, 2011), indicates that the presence of INEDs has
no impact on firm value. For example, Hermalin and Weisbach (1991) report no link
between INEDs and firm valuation for a sample of 142 US listed firms. UK studies by
Vafeas and Theodorou (1998) and Weir and Laing (2000) find that the wealth effects of
INEDs are statistically insignificant. Similarly, Haniffa and Hudaib (2006) report a
statistically insignificant relationship between the presence of INEDs and firm valuation for
a sample of 347 Malaysian listed firms. Further, Bokpin (2011) finds no significant link
between the presence of INEDs and dividend performance for a sample of 23 Ghanaian
listed firms from 2002 to 2007.
With specific reference to SA, the 1973 Companies Act requires every public
company to appoint at least two INEDs. King II and the JSE Listings Rules also require SA
corporate boards of directors to consist of a majority of NEDs. King II further requires that
the majority of the NEDs be independent (INEDs) of management to ensure that minority
interests are adequately protected. This suggests that King II expects that firms with more
INEDs on their boards to be valued higher than those with less INEDs. As has been
previously discussed, the past SA evidence (albeit it indirect) also indicates that a greater
percentage of INEDs on corporate boards may be associated with higher firm valuation (Ho
and Williams, 2003; Mangena and Chamisa, 2008). However, given the mixed international
evidence, we predict a statistically significant association between the presence of INEDs
and firm valuation without being specific about the direction of the sign. Therefore, the
main hypothesis tested in this study is that:
H1: There is either a statistically significant negative or positive relationship
12
4.Research design
4.1Sample and data
A total of 402 firms from ten industries (i.e., basic materials, consumer goods,
consumer services, financials, health care, industrials, oil & gas, technology, telecoms, and
utilities) were listed on the JSE as at 31/12/2007. For regulatory and capital structure
reasons, we excluded 111 financials and utilities, leaving us with 291 firms from eight
non-financial industries to be sampled. We required data on CG and non-financial variables to
examine the link between INEDs and firm value. The CG variables were collected from the
sampled companies’ annual reports. The annual reports were downloaded from the Perfect
Information Database. We collected the financial data from DataStream. The companies in
our final sample had to meet two criteria: the availability of a firm’s full five-year annual
reports from 2002 to 2006; and the accessibility to a firm’s corresponding financial data
from 2003 to 2007[3].
The criteria were set for a number of reasons. First, and similar to previous studies
(Haniffa and Hudaib, 2006; Henry, 2008; Beiner et al., 2006), the criteria enabled use to
meet the requirements for a balanced panel data analysis. Some of the advantages that can
be obtained for the use of panel data include having both time-series and cross-sectional
observations, more degrees of freedom and less multi-collinearity among the variables
(Wooldridge, 2002; Gujarati, 2003). Second, an examination of five-year data with both
cross-sectional and time-series characteristics may help in discovering whether the
observed cross-sectional association between the presence of INEDs and firm valuation is
robust over-time (Agrawal and Knoeber, 1996; Ntim et al., 2011b). This can facilitate
direct comparisons to be drawn with the results of past studies (Laing and Weir, 1999;
13
full data required for a total of 169 firms over five-firm years and 8 industries for our
empirical analysis.
4.2Dependent, independent and control variables
This subsection discusses all the three main types of variables that we employ in our
investigation, and Table 1 presents their full definitions. Firstly, we utilise two main
independent variables for our regression analysis: the presence of NEDs and INEDs.
Secondly, our main dependent variable or proxy for firm valuation is the widely used
Tobin’s Q (Q). However, we use return on assets (ROA) and total share return (TSR) to
check the sensitivity of our findings to alternative accounting and market-based firm value
proxies, respectively. Finally, and similar to previous studies (Bozec, 2005;
Kyereboah-Coleman, 2007), we add below a number of control variables. First, firms with higher
investment opportunities tend to grow faster (Henry 2008; Ntim and Osei, 2011), and are
more likely to be highly valued by the stock market. Thus, our expectation is that sales
growth (GROWTH) will be positively associated with market valuation. Second, firms with
greater investment in research and development can gain competitive advantages
(Baysinger and Hoskisson, 1990; Gupta and Fields, 2009), and therefore may be highly
valued by the stock market. In contrast, research and development is capital intensive
activity (Vafeas and Theodorou, 1998; Weir and Laing, 2000), and thus, may have a
negative influence on market valuation.
Insert Table 1 about here
Similarly, higher debt usage can enhance firm value by effectively reducing
managerial capacity to expropriate ‘free cash flows’ (Jensen 1986; Jiraporn et al., 2009).
By contrast, higher use of debt can increase the risk of financial distress, and impact
14
(Jensen, 1986; Ntim et al., 2011a). Also, and due to greater agency problems, bigger firms
can be expected to have good CG structures (Agrawal and Knoeber, 1996; Beiner et al.,
2006), and as such may be more highly valued by the stock market. On the other hand,
smaller firms tend to have higher investment and growth opportunities (Weir et al., 2002;
Guest, 2009), and thus, may receive higher market valuation. Due to the mixed theoretical
predictions, we hypothesise that gearing (GEAR), capital expenditure (CAPEX) and firm
size (LNTA) will correlate either negatively or positively to firm value. Third, firms that are
cross-listed on international stock markets are more likely to have greater access to funds
and investment opportunities (Ntim, 2009; Ntim et al., 2011b), and therefore may be valued
more highly by the stock market. Thus, our prediction is that cross-listing (CROSLIST)will
correlate positively to firm value. Fourth, it has been suggested that audit firm size is
positively associated with auditor independence and audit quality (DeAngelo (1981; Ntim
and Osei, 2011), and as such firms audited by large audit firms may have a positive
association with firm value. Hence, our prediction is that audit firm size (BIG4) will
correlate positively to firm value.
Fifth, as government ownership provides access to critical resources, such as
finance and profitable government contracts (Armstrong et al., 2006; Ntim et al., 2011a),
we predict that government ownership (GOVOWN) will be positively associated with
market valuation. Sixth, firms that voluntarily establish CG committee to specifically
monitor CG standards may have greater ability to minimise managerial capacity to extract
corporate assets (Ntim et al., 2011b; Ntim and Osei, 2011), and therefore may receive
higher market valuation. Therefore, our expectation is that the presence of a CG committee
(CGCOM) will correlate positively to firm value. Finally, following prior studies (Haniffa
15
different industries and financial years. As such, we add industry (INDUST) dummies for
the 5 remaining industries[4]: basic materials and oil & gas; consumer goods; consumer
services and health care; industrials; and technology & telecoms; and year (YD) dummies
for the financial years 2003 to 2007.
5.Empirical analyses
5.1Descriptive statistics
Table 2 contains descriptive statistics of all variables that we use in conducting our
fixed-effects regressions. All values generally suggest a wide spread. For instance, and
consistent with the findings of Beiner et al. (2006), Henry (2008) and Guest (2009), Q
ranges from a minimum of 0.58 and a maximum of 3.58 with mean of 1.52, depicting wide
variation. In terms of the CG variables in Panel B of Table 2, it is observable that
irrespective of the statistics used, more SA firms have higher percentage of their board
members as NEDs than INEDs. For example, whilst the average SA firm has 57% of its
board members as NEDs, the corresponding figure for INEDs is only 28%. Although our
evidence is consistent with the reported results of previous studies for the percentage of
NEDs (Yermack, 1996; Ho and Williams, 2003; Kyereboah-Coleman, 2007) and INEDs
(Agrawal and Knoeber, 1996; Gupta and Fields, 2009; Mangena and Chamisa, 2008), it
appears to suggests that more firms find it difficult to meet the new strict director
independence test introduced by King II. The alternative firm value measures (i.e., ROA
and TSR), as well as the control variables (i.e., BIG4, CAPEX, CGCOM, CROSLIST, GEAR,
GOVOWN, and GROWTH) suggest wide variations, an indication that our sample has been
adequately selected to achieve sufficient variation, and therefore avoids any possibilities of
sample selection bias.
16
We also tested linear regression assumptions of multicollinearity, autocorrelation,
normality, homoscedasticity, and linearity. We tested the multicollinearity assumption by
implementing the Spearman non-parametric and Pearson parametric bivariate correlation
tests among the variables. The findings, which to save space are not reported, but available
on request, indicated that no serious non-normalities and multicollinearities existed among
the variables. Additionally, we investigated scatter, P-P and Q-Q plots, studentised
residuals, Cook’s distances and Durbin-Watson statistics of the variables, and the tests also
suggested no significant breach of the linear regression assumptions of homoscedasticity,
linearity, normality and autocorrelation, indicating that it is appropriate to conduct
multivariable regression analyses.
5.2 Multivariate regression analyses
Firms tend to vary in the threats and opportunities that they face over time (Henry,
2008; Ntim et al., 2011b). This can result in scenario whereby NEDs or INEDs and Q are
jointly and dynamically influenced by firm-specific variations, such as corporate culture,
complexity and executive talent (Guest, 2009; Ntim, 2009), which simple OLS regressions
may be unable to detect (Wooldridge, 2002; Gujarati, 2003), and thereby leading to
spurious findings (Agrawal and Knoeber, 1996; Beiner et al., 2006). Therefore, given the
panel nature of our data, as well as following previous studies (Henry, 2008; Guest, 2009;
Ntim et al., 2011b), we conduct fixed-effects regressions[5] in order to account for possible
unobserved firm-specific heterogeneities. We begin our analysis with basic fixed-effects
regression specified as follows:
n
i
it it it i
it
it INEDs CONTROLS
Q
1
1 1 1 1
1
0
(1)
17
CONTROLS refers to the control variables, including BIG4, CAPEX, CGCOM, CROSLIST,
GEAR, GOVOWN, GROWTH, INDUST and YD, and
δ
refers to the firm-level fixed-effects,made up of a vector of 168 year dummies to represent the 169 sampled firms.
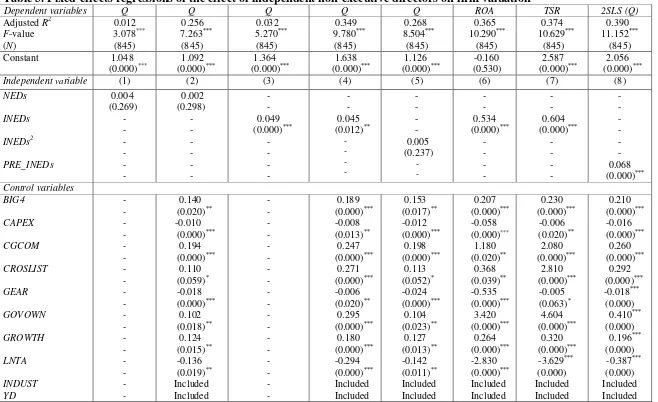
Table 3 presents fixed-effects regressions results of the effect of the presence of
NEDs or INEDs on Q. First, to ascertain whether the presence of NEDs influences Q, we
run Q on the NEDs alone excluding the control variables using equation (1). Statistically
insignificant and positive impact of NEDs on Q is noticeable in Model 1 of Table 3.
However, the coefficient on the constant term in Model 1 of Table 3 is statistically
significant and appears to indicate that the model may be suffering from omitted variables
bias. Therefore, to check whether our finding is not spuriously caused by omitted variables
bias, we include the control variables in Model 2 to account for potential omitted variables
bias. Again, positive, but statistically insignificant effect of NEDs on Q is clearly
observable in Model 2 of Table 3, and thereby failing to provide support for H1, but
consistent with the findings of prior studies that report insignificant association between
NEDs and firm valuation (Hermalin and Weisbach, 1991; Vefeas and Theodorou, 1998;
Weir and Laing, 2000). A possible explanation is that some NEDs tend to have significant
interests or close connections with corporate management (Zahra and Stanton, 1988; Gupta
and Fields, 2009). This can impede their independence, and consequently their capacity to
effectively monitor and discipline executives (Jensen, 1993; Jiraporn et al., 2009).
Insert Table 3 about here
Second, and given our evidence of statistically insignificant effect of the presence of
NEDs on Q, we re-run equation (1) by replacing NEDs with INEDs with and without the
control variables, which provides a more subtle and strict definition of director
18
INEDs on Q is noticeable in Model 3 of Table 3. However, the coefficient on the constant
term is statistically significant, indicating that there may be omitted variables bias.
Therefore, to ascertain whether our evidence is not falsely driven by omitted variables bias,
we re-estimate Model 3 by adding the control variables. The coefficient of INEDs on Q in
Model 4 of Table 3 is statistically significant and positive, and thereby providing support
for H1, as well as the recommendations of King II[6]. Our evidence also provides support
for the results of past studies (Kiel and Nicholson, 2003; Kyereboah-Coleman et al., 2006;
Gupta and Fields, 2009) that report a positive association between INEDs and firm
valuation, but inconsistent with those that report a negative (Yermack, 1996; Laing and
Weir, 1999; Bozec, 2005; Kyereboah-Coleman, 2007). Theoretically, our results are in line
with agency theoretical predictions, which suggest that more independent corporate boards
have greater capacity to effectively advise, monitor and discipline corporate executives
(Fama, 1980; Lipton and Lorsch, 1992; Jensen, 1993), and thereby enhancing firm value.
Finally, and the coefficients on the control variables in Models 2 and 4 of Table 3
are generally consistent with our predictions. For example and as expected, the coefficients
on CAPEX, GEAR and LNTA are statistically significant and negatively associated with Q,
whilst BIG4, CGCOM, CROSLIST, GOVOWN and GROWTH are statistically significant
and positively related to Q, in Models 2 and 4. Finally, the F-values in Models 2 to 4 of
Table 3 consistently reject the null hypothesis that the coefficients on the main independent
and the control variables are equal to zero. In line with the findings of past studies
(Yermack, 1996; Bozec, 2005; Gupta and Fields, 2009),the adjusted R2 is between 3% and
35%, suggesting that our fixed-effects estimations can explain significant variations in our
19
5.3 Sensitivity analyses
Our fixed-effects estimations so far do not take into consideration the existence of
possible non-linear relationships and alternative firm valuation proxies, as well as other
potential endogeneity problems. This suggests that the evidence of a significant positive
association between the presence of INEDs and firm valuation, for example, may be
spurious. In this subsection, we examine how sensitive our results are to the presence of
non-monotonic associations, alternative firm value measures and other endogeneities.
First, to investigate whether there is a non-linear association between INEDs and
firm value, such that either the presence of a small or large number of INEDs has a positive
effect on Q, as predicted by Jensen (1993), we re-estimate equation (1) using squared
(INEDs2) form of INEDs[7]. Positive, but statistically insignificant effect of INEDs2on Q is
observable in Model 5 of Table 3, and thereby suggesting that our evidence of a positive
impact of the presence of INEDs on Q is robust to this specification. Second and as
previously explained, we examine the sensitivity of our results to two alternative firm
valuation proxies: return on assets (ROA – an accounting based proxy) and total share
returns (TSR – a market based measure). Models 6 and 7 of Table 3 present findings
obtained by using ROA and TSR, respectively, instead of Q. Statistically significant and
positive effect of INEDs on ROA and TSR in models 6 and 7 of Table 3, respectively, is
noticeable, and thereby suggesting that our findings are insensitive to the use of either an
accounting (ROA) or a market (TSR) based firm valuation proxy, instead of Q.
Third, to address potential extra endogeneity problems that may be caused by
omitted variable bias, we implement the extensively used two-stage least squares (2SLS)
technique (Beiner et al., 2006; Henry, 2008). However, to ensure that the 2SLS
20
(2006), we first conduct Durbin-Wu-Hausman exogeneity test (see Beiner et al., 2006, p.
267) to ascertain whether an endogenous relationship exists between Q and INEDs. Applied
to equation (1), the test rejects the null hypothesis of exogeneity, and as such we conclude
that the 2SLS technique may be appropriate and that our earlier findings based on the
fixed-effects estimations may be spurious. In the first stage, we assume that INEDs will be
influenced by the ten control variables (i.e., as exogenous variables) specified in equation
(1). In the second stage, we utilise the predicted portion of the INEDs (PRE_INEDs) as an
instrument for the INEDs and re-run equation (1) as specified below:
n
i
it it it i
it
it INEDs CONTROLS
Q
1 1
0 ˆ
(2)
whereby everything remains the same as specified in equation (1)[8] except that we employ
the predicted INEDs (PRE_INEDs) from the first-stage regression as an instrument for the
INEDs. Statistically significant and positive effect of the PRE_INEDs on Q is clearly
noticeably in Model 8 of Table 3, and thereby indicating that our evidence of a positive
effect of INEDs on Q is not sensitive to endogeneity problems that may be caused by
potential omitted variables. Overall, the sensitivity analyses suggest that our findings are
fairly insensitive to different types of potential endogeneity problems, non-monotonic
relationships and alternative firm valuation measures.
6. Summary and conclusion
This paper has attempted to examine the association between the presence of
independent non-executive directors (INEDs) and firm valuation using a sample of 169
firms listed on the Johannesburg Stock Exchange (JSE) from 2002 to 2007 in South Africa
(SA). This coincides with a period during which the SA authorities embarked upon
21
firms by enhancing the independence and monitoring capacity of corporate boards,
primarily in the shape of the 1994 and 2002 King Reports.
Our findings suggest a positive, but statistically insignificant relationship between
the presence of NEDs and firm valuation. In contrast, we find statistically significant and
positive association between the presence of INEDs and firm valuation. Additionally, we
examine the existence of potential non-linear relationship between NEDs or INEDs and
firm valuation, whereby either a relatively small or large number of NEDs or INEDs
positively influences firm valuation as suggested by Jensen (1993), but we do not find any
such statistically significant non-monotonic links. Our findings are consistent across a raft
of econometric models that take into consideration different types of endogeneity problems
and firm valuation proxies. Overall, our results provide empirical support for agency theory,
which suggests that more independent corporate boards tend to have increased capacity to
effectively advise, monitor and discipline corporate executives, and thereby enhancing firm
valuation.
Our evidence also has important implications for policy-makers and regulatory
authorities. Whilst our evidence that more independent corporate boards’ impacts positively
on firm valuation provides support for the recommendations of the King Reports, it
suggests that to be useful, director independence has to be more subtly and strictly defined.
Further, and given that SA firms are far from having a majority of their board members
being INEDs as recommended by the 2002 King Report, there is the need to strengthen
compliance and enforcement. In this respect, establishing a “compliance and enforcement
committee” to regularly check the levels of compliance among listed firms may help in
22
Notes
1. For example, Sunday’s (2008) study was based only on 20 Nigerian listed firms from 200 to 2006, whilst Kyereboah-Coleman and and Biekpe (2006a) used 47 Kenyan listed firms from 1999 to 2003. Samples used by other studies, such as Kyereboah-Coleman et al. (2006), Kyereboah and Biekpe (2006a), Abor (2007) and Bokpin (2011), amongst others, are well below 30 firms.
2. King II requires firms to clearly define and classify directors into three main types: executive, NED and INED. First, an executive director refers to an individual who is involved in the day-to-day management and/or is a full-time salaried employee of the company or its subsidiaries. Second, a NED is defined as an individual who is not involved in the day-to-day management and is not a full-time salaried employee of the company or its subsidiaries. Third, an INED is strictly defined as a NED who: (1) is not a representative of a shareholder; (2) has not been employed in any executive capacity for the preceding three financial years; (3) is not a member of the immediate family of an individual who is, or has not been employed by the company in an executive position in the past three financial years; (4) is not a professional advisor to the company; (5) is not a significant supplier to or customer of the company; (6) has no significant contractual relationship with the company; and (7) is free from any business or other relationship which could be seen to materially interfere with the individual’s capacity to act in an independent manner (King Report, 2002, para. 2.4).
3. Corporate board decisions take time in order to be reflected in firm value (Haniffa and Hudaib, 2006; Ntim et al., 2011b; Ntim and Osei, 2011). Therefore, to avoid endogenous association between the presence of INEDs and firm valuation, we introduce a one year lag between INEDsand firm valuation such that this year’s firm value
depends on last year’s governance structure (INEDs) similar to Weir et al. (2002) and Haniffa and Hudaib (2006), as specified in equation (1). The sample also starts from 2002 for two reasons. First, King II came into operation in 2002, and secondly, data coverage in Perfect Information/DataStream on SA listed firms is very limited until 2002. The sample ends in 2007 because it is the year for which data is available.
4. Due to insufficient number of observations in 3 industries, namely health care, oil and gas, and telecoms industries with three, one and three listed companies, respectively, were merged with the closest remaining five major industries. Consequently, the three health care companies were included in the consumer services
industry, the one oil and gas firm was added to the basic materials industry, whilst the three telecoms firms were also shared out to the technology industry.
5. However, we note that our choice is between random and fixed-effects estimation techniques. Therefore, to ensure that fixed-effects model is appropriate, we first conduct Hausman (1978) specification test by estimating both fixed and random-effects models for the NEDs or INEDs separately using equation (1) and comparing their respective coefficients. Under the null hypothesis of consistent random unobserved firm-level heterogeneity (i.e., unobserved firm-specific effects or the regressions errors are uncorrelated with the independent variables), random-effects estimates will be both consistent and efficient, whilst fixed-effects coefficients will be consistent, but inefficient (Hausman, 1978; Woodridge, 2002). In contrast, if the null hypothesis is rejected, then the fixed-effects approach will provide both consistent and efficient estimates, whereas random-fixed-effects estimates will be both inconsistent and biased (Hausman, 1978; Gujarati, 2003). The test consistently rejects the null hypothesis of consistent random effects for both models at the 1% level, providing further empirical support for our decision to rely primarily on fixed-effects models.
6. As NEDs are statistically insignificant in our models, all our subsequent estimations and discussions will be based on INEDs,instead NEDs.
7. We conducted similar non-linear investigation for the NEDs proxy and found statistically insignificant non-monotonic link between the presence of NEDs and firm valuation. We also explored other forms of non-monotonic transformations, such as cubing the variables (i.e., NEDs or INEDs), but we found statistically insignificant association between the presence of NEDs or INEDs and firm valuation.
23
References
Abor, J. (2007), “Corporate governance and financing decisions of Ghanaian listed firms”,
Corporate Governance, Vol. 7 No. 1, pp.83-92.
Abor, J. and Biekpe, N. (2007), “Corporate governance, ownership structure and performance of
SMEs in Ghana: Implications for financing opportunities”,Corporate Governance, Vol. 7 No. 3,
pp.288-300.
Agrawal, A. and Knoeber, C.R. (1996), “Firm performance and mechanisms to control agency
problems between managers and shareholders”, Journal of Financial and Quantitative Analysis,
Vol. 31 No. 3, pp.377-389.
Armstrong, P., Segal, N. and Davis, B. (2006), “Corporate governance in South Africa”,
in Mallin, C.A. (Ed.), Handbook on international corporate governance, Edward
Elgar Publishing, Cheltenham, pp.210-231.
Barr, G., Gerson, J. and Kanto, B. (1995), “Shareholders as agents and principals: The case for
South Africa’s corporate governance system”,Journal of Applied Corporate Finance,Vol. 8 No.
1, pp.18-31.
Bhagat, S. and Black, B. (2002), “The non-correlation between board independence and
long-term firm performance”, Journal of Corporation Law, Vol. 27, pp.231–274.
Al-Najjar, B. and Hussainey, K. (2009), “The association between dividend payout and outside
directorships”, Journal of Applied Accounting Research, Vol. 10 No. 1, pp.4-19.
Baysinger, B.D. and Butler, H.N. (1985), “Corporate governance and board of directors:
performance effects of changes in board composition”,Journal of Law, Economics and
Organisation, Vol. 1 No. 1, pp.101-124.
Baysinger, B. D. and Hoskisson, R.E. (1990), “The composition of boards of directors and strategic
control: Effects on corporate strategy”,Academy of Management Review, Vol. 15 No. 1, pp.72-87.
Beiner, S., Drobetz, W., Schmid, M.M. and Zimmermann, H. (2006), “An integrated framework of
corporate governance and firm valuation”,European Financial Management, Vol. 12 No. 2,
pp.249-283.
Ben-Amar, W. and Zeghal, D. (2011), “Board of directors’ independence and executive
compensation disclosure transparency: Canadian evidence”, Journal of Applied Accounting
Research, Vol. 12 No. 1, pp.43-60.
Bokpin, G.A. (2011), “Ownership structure, corporate governance and dividend performance on the
Ghana Stock Exchange”, Journal of Applied Accounting Research, Vol. 12 No: 1, pp.61-73.
Bozec, R. (2005), “Boards of directors, market discipline and firm performance”,Journal of
Business Finance & Accounting, Vol. 32 No. 9-10, pp.1921-1960.
Dalton D. R., Daily, C. M., Ellstrand, A. E. and Johnson, J. L. (1998), “Meta-analytic reviews of board composition, leadership structure, and financial performance”, Strategic Management Journal, Vol. 19 No. 3, pp.269–290.
DeAngelo, L.E., (1981), “Auditor size and auditor quality”,Journal of Accounting and Economics,
Vol. 3 No. 3, pp.183-199.
El Mehdi, I.K. (2007), “Empirical evidence on corporate governance and corporate performance in
Tunisia”, Corporate Governance: An International Review, Vol. 15, No. 6, pp.1429-1441.
Fama, E.F. (1980), “Agency problems and the theory of the firm”,Journal of Political Economy,
Vol. 88 No. 2, pp.288-307.
Fama E.F. and Jensen, M.C. (1983a), “Separation of ownership and control”,Journal of Law and
Economics, Vol. 26 No. 2, pp.301-325.
Fama, E.F. and Jensen, M.C. (1983b), “Agency problems and residual claims”,Journal of Law and
Economics, Vol. 26 No. 2, pp.327-349.
Guest, P.M. (2009), “The impact of board size on firm performance: evidence from the UK”,
European Journal of Finance, Vol. 15 No. 4, pp.385-404.
24
Gupta, M. and Fields, L.P. (2009), “Board independence and corporate governance: Evidence from director resignations”, Journal of Business Finance and Accounting, Vol. 36 No. 1-2, pp.161-184.
Haniffa, R. and Hudaib, M. (2006), “Corporate governance structure and performance of Malaysian
listed companies”,Journal of Business, Finance & Accounting, Vol. 33 No. 7-8, pp.1034-1062.
Henry, D. (2008), “Corporate governance structure and the valuation of Australian firms: Is there
value in ticking the boxes”,Journal of Business Finance & Accounting, Vol. 35, No. 7-8,
pp.912-942.
Hermalin, B.E. and Weisbach, M.S. (1991), “The effect of board composition and direct incentives on firm performance”, Financial Management, Vol. 21 No. 4, pp.101-112.
Ho, C-A. and Williams, S.M. (2003), “International comparative analysis of the association
between board structure and the efficiency of value added by a firm from its physical capital and intellectual capital resources”, International Journal of Accounting, Vol. 38 No. 4, pp.465-491.
Jensen, M.C. (1986), “Agency costs of free cash flow, corporate finance, and takeovers”,American
Economic Review, Vol. 76 No. 2, pp.323-329.
Jensen, M. C., (1993). The modern industrial revolution, exit, and the failure of internal control
systems. Journal of Finance, Vol. 48, pp.831-880.
Jiraporn, P., Singh, C. and Lee, C.I. (2009), “Ineffective corporate governance: Director busyness
and board committee memberships”,Journal of Banking and Finance, Vol. 33 No. 5, pp.819-828.
Kakabadse, A. and Korac-Kakabadse, N. (2002), “Corporate governance in South Africa:
evaluating the King II report”, Journal of Change Management, Vol. 2, pp.305-317.
Kiel, G.C. and Nicholson, G.J. (2003), “Board composition and corporate performance: How the
Austrian experience informs contrasting theories of corporate governance”,Corporate
Governance: An International Review, Vol. 11 No. 3, pp.189-205.
King Committee (1994 & 2002). King reports on corporate governance for South Africa. Institute
of Directors, Johannesburg.
Kyereboah-Coleman, A. (2007), “Corporate governance and shareholder value maximization: An
African perspective”, African Development Review, Vol. 19 No. 2, pp.350-367.
Kyereboah-Coleman, A., Adjasi, C. and Abor, J. (2006), “Corporate governance and performance
of Ghanaian listed firms”, Corporate Ownership and Control, Vol. 4 No. 2, pp.123-132.
Kyereboah-Coleman, A. and Biekpe, N. (2006a), “Corporate governance and financing choices of
firms: A panel data analysis”, South African Journal of Economics, Vol. 74 No. 4, pp.670-681.
Kyereboah-Coleman, A. and Biekpe, N. (2006b), “The relationship between board size, board
composition, CEO duality and firm performance: Experience from Ghana”, Corporate Ownership and Control, Vol. 4. No. 2, pp.114-122.
Lipton, M. and Lorsch, J. (1992), “A modest proposal for improved corporate governance”,
Business Lawyer,Vol. 48 No. 1, pp.59-77.
Mangena, M. and Chamisa, E. (2008), “Corporate governance and incidences of listings
suspension by the JSE Securities Exchange of South Africa: an empirical analysis”,
International Journal of Accounting, Vol. 43 No. 1, pp.28-44.
Mangena, M. andTauringana, V. (2008), “Corporate boards, ownership structure and firm
performance in an environment of severe political and economic uncertainty”,British Accounting
Association Conference Paper, Blackpool.
McDonald, M. L, Westphal, J. D. and Graebner, M. E. (2008), “What do they know? The effects of outside director acquisition experience on firm acquisition performance”,Strategic Management Journal, Vol. 29 No. 11, pp. 1155–1177.
Nicholson, G. J. and Geoffrey, K.C. (2003), “Can directors impact performance? A case-based test
of three theories of corporate governance”,Corporate Governance: An International Review, Vol.
15 No. 4, pp.585-608.
Ntim, C.G. (2009), “Internal corporate governance and firm financial performance: evidence from
25
Ntim, C.G., Opong K.K., Danbolt, J. and Thomas, D.A. (2011a), “Voluntary corporate governance
disclosures by post-apartheid South African corporations”, Journal of Applied Accounting
Research, Forthcoming.
Ntim, C.G., Opong K.K. and Danbolt, J. (2011b), “The value relevance of shareholder versus
stakeholder corporate governance disclosure policy reforms in South Africa”,Corporate
Governance: An International Review, Forthcoming.
Ntim, C.G. and Osei, K.A. (2011), “The impact of corporate board meetings on corporate
performance in South Africa”,African Review of Economics & Finance, Forthcoming.
Petersen, M.A. (2009), “Estimating standard errors in finance panel data sets: Comparing
approaches”,Review of Financial Studies, Vol. 22 No. 1, pp.435-480.
Pfeffer, J. (1973), “Size, composition, and function of hospital boards of directors: A study of
organization-environmental linkage”, Administrative Science Quarterly, 18 No. 6, pp.349-364.
Rosenstein, S. and Wyatt, J.G. (1990), “Outside directors, board independence, and shareholder
wealth”,Journal of Financial Economics, Vol. 26 No. 2, pp.175-191.
Sanda, A., Mikailu, A.S. and Garba, T. (2010), “Corporate governance mechanisms and firm financial performance in Nigeria”, Afro-Asian Journal of Finance and Accounting Vol. 2 No. 1, pp.22-39.
Sonnenfeld, J.A. (2002), “What makes great boards”,Harvard Business Review,Vol. 80 No. 9,
pp.106-113.
Sunday, K.O. (2008), “Corporate governance and firm performance: The case of Nigerian listed firms”, European Journal of Economics, Finance and Administrative Sciences, Vol. 14, pp.16-28.
Vafeas, N. and Theodorou, E. (1998), “The relationship between board structure and firm
performance in the UK”,British Accounting Review, Vol. 30 No. 4, pp.383-407.
Weir C., Laing, D. and McKnight, P.J. (2002), “Internal and external governance mechanisms:
Their impact on the performance of large UK public companies”,Journal of Business Finance &
Accounting, Vol. 29 No. 5, pp.579-611.
Weir, C., & Laing, D. (2000), “The performance-governance relationship: The effects of Cadbury
compliance on UK quoted companies”,Journal of Management & Governance, Vol. 4 No. 4,
pp.265-281.
West, A. (2009), “The ethics of corporate governance: a South African perspective”, International Journal of Law and Management, Vol. 51 No. 1, pp.10-16.
Wooldridge, J.M. (2002), Econometric Analysis of Cross Section and Panel Data, MIT Press,
Massachusetts.
Yermack, D. (1996), “Higher market valuation of companies with a small board of directors”,
Journal of Financial Economics,Vol. 40 No. 2, pp.185-211.
Zahra, S.A. and Stanton, W.W. (1988), “The implication of board of directors’ composition for
26
Table 1. Summary of variables Firm valuation/dependent variables
Q The ratio of total assets minus book value of equity plus market value of equity to
total assets.
ROA The percentage of operating profit to total assets.
TSR The percentage of annualised total share returns made up of share price and
dividends.
Corporate governance/independent variables
NEDs The percentage of all non-executive directors (all outside directors) to total number of directors on a corporate board.
INEDs The percentage of NEDs who: are not representatives of a shareholder; have not been employed in any executive capacity for the preceding three financial years; are not members of the immediate family of an individual who is, or has not been employed by the company in an executive position in the past three financial years; are not professional advisors to the company; are not significant suppliers to or customers of the company; have no significant contractual relationship with the company; and are free from any business or other relationship which could be seen to materially interfere with the individual’s capacity to act in an independent manner.
Control variables
BIG4 A dummy variable that takes the value of 1, if a firm is audited by a big four audit firm (PricewaterhouseCoopers, Deloitte & Touché, Ernst & Young, and KPMG), 0 otherwise.
CAPEX The percentage of total capital expenditure to total assets.
CROSLIST A dummy variable that takes the value of 1, if a firm is cross-listed on a foreign stock market, 0 otherwise.
CGCOM A dummy variable that takes the value of 1, if a firm has set up a corporate governance committee, 0 otherwise.
GEAR The percentage of total debts to market value of equity.
GOVOWN A dummy variable that takes the value of 1, if government ownership is at least 5%, 0 otherwise.
GROWTH The percentage of the current year’s sales minus last year’s sales to last year’s sales.
LNTA The natural log of total assets.
INDUST Industry dummies for the five main remaining industries.
27
Table 2. Descriptive statistics of all variables for all (845) firm years
Variable Mean Median Std. dev. Maximum Minimum
Panel A: Firm valuation (Dependent) variables
Q 1.52 1.33 0.69 3.58 0.58 ROA (%) 10.26 10.97 12.21 36.55 -23.19 TSR (%) 33.57 29.60 48.68 173.41 -55.20
Panel B: Corporate governance (Independent) variables
NEDs (%) 57.39 60.00 17.20 00.00 100.00
INEDs (%) 28.43 28.57 23.24 00.00 83.33
Panel C: Control variables
BIG4 (%) 73.25 100.00 44.29 100.00 0.00
CAPEX (%) 11.08 6.28 13.86 64.46 0.00
CGCOM (%) 35.80 0.00 48.00 100.00 0.00
CROSLIST (%) 21.66 0.00 41.21 100.00 0.00
GEAR (%) 34.78 14.63 55.02 270.65 0.00
GOVOWN (%) 38.00 0.00 49.00 100.00 0.00
GROWTH (%) 14.40 12.60 24.94 88.26 -41.88
LNTA 5.95 5.97 0.89 7.60 4.08
Notes: Variables are defined as follows: Tobin’s Q (Q), measured as the ratio of total assets minus book value of equity plus market value of equity to total assets. Return on assets (ROA), defined as the ratio of operating profit to total assets. Total shareholder returns (TSR), calculated as annualised total share returns made up of
share price and dividends. Non-executive directors (NEDs), measured as the percentage of all non-executive
directors (all outside directors) to total number of directors on a board. Independent NEDs (INEDs), is strictly defined as a NED who: are not representatives of a shareholder; have not been employed in any executive capacity for the preceding three financial years; are not members of the immediate family of an individual who is, or has not been employed by the company in an executive position in the past three financial years; are not professional advisors to the company; are not significant suppliers to or customers of the company; have no significant contractual relationship with the company; and are free from any business or other
relationship which could be seen to materially interfere with the individual’s capacity to act in an independent
manner. Audit firm size (BIG4), measured as a dummy variable that takes the value of 1, if a firm is audited by a big four audit firm (PricewaterhouseCoopers, Deloitte & Touché, Ernst & Young, and KPMG), 0 otherwise. Capital expenditure (CAPEX), calculated as the ratio of total capital expenditure to total assets. Cross-listing (CROSLIST), measured as a dummy variable that takes the value of 1, if a firm is cross-listed to
a foreign stock market, 0 otherwise. The presence of a corporate governance committee (CGCOM), defined as
a dummy variable that takes the value of 1, if a firm has set up a corporate governance committee, 0 otherwise. Gearing (GEAR), calculated as the ratio of total debts to market value of equity. Government ownership (GOVOWN), measured as a dummy variable that takes the value of 1, if government ownership is at least 5%, 0 otherwise. Sales growth (GROWTH), calculated as the current year’s sales minus last year’s sales to last