Hydrol. Earth Syst. Sci., 17, 761–781, 2013 www.hydrol-earth-syst-sci.net/17/761/2013/ doi:10.5194/hess-17-761-2013
© Author(s) 2013. CC Attribution 3.0 License.
EGU Journal Logos (RGB)
Advances in
Geosciences
Open Access
Natural Hazards
and Earth System
Sciences
Open AccessAnnales
Geophysicae
Open AccessNonlinear Processes
in Geophysics
Open AccessAtmospheric
Chemistry
and Physics
Open AccessAtmospheric
Chemistry
and Physics
Open Access DiscussionsAtmospheric
Measurement
Techniques
Open AccessAtmospheric
Measurement
Techniques
Open Access DiscussionsBiogeosciences
Open Access Open Access
Biogeosciences
DiscussionsClimate
of the Past
Open Access Open Access
Climate
of the Past
Discussions
Earth System
Dynamics
Open Access Open Access
Earth System
Dynamics
DiscussionsGeoscientific
Instrumentation
Methods and
Data Systems
Open Access
Geoscientific
Instrumentation
Methods and
Data Systems
Open Access DiscussionsGeoscientific
Model Development
Open Access Open Access
Geoscientific
Model Development
DiscussionsHydrology and
Earth System
Sciences
Open AccessHydrology and
Earth System
Sciences
Open Access DiscussionsOcean Science
Open Access Open Access
Ocean Science
Discussions
Solid Earth
Open Access Open Access
Solid Earth
DiscussionsThe Cryosphere
Open Access Open Access
The Cryosphere
DiscussionsNatural Hazards
and Earth System
Sciences
Open Access
Discussions
Influence of basin connectivity on sediment source, transport,
and storage within the Mkabela Basin, South Africa
J. R. Miller1, G. Mackin2, P. Lechler1, M. Lord1, and S. Lorentz3
1Department of Geosciences and Natural Resources, Western Carolina University, Cullowhee, NC 28723, USA 2Department of Mathematics and Statistics, Northern Kentucky University, Highland Heights, KY 41099, USA 3School of Bioresources Engineering and Environmental Hydrology, University of KwaZulu–Natal,
Pietermaritzburg, South Africa
Correspondence to: J. R. Miller (jmiller@wcu.edu)
Received: 8 August 2012 – Published in Hydrol. Earth Syst. Sci. Discuss.: 6 September 2012 Revised: 16 January 2013 – Accepted: 24 January 2013 – Published: 21 February 2013
Abstract. The management of sediment and other non-point
source (NPS) pollution has proven difficult, and requires a sound understanding of particle movement through the drainage system. The primary objective of this investigation was to obtain an understanding of NPS sediment source(s), transport, and storage within the Mkabela Basin, a repre-sentative agricultural catchment within the KwaZulu–Natal Midlands of eastern South Africa, by combining geomor-phic, hydrologic and geochemical fingerprinting analyses.
The Mkabela Basin can be subdivided into three distinct subcatchments that differ in their ability to transport and store sediment along the axial valley. Headwater (upper catch-ment) areas are characterized by extensive wetlands that act as significant sediment sinks. Mid-catchment areas, charac-terized by higher relief and valley gradients, exhibit few wet-lands, but rather are dominated by a combination of allu-vial and bedrock channels that are conducive to sediment transport. The lower catchment exhibits a low-gradient al-luvial channel that is boarded by extensive riparian wet-lands that accumulate large quantities of sediment (and NPS pollutants).
Fingerprinting studies suggest that silt- and crich lay-ers found within wetland and reservoir deposits of the up-per and upup-per-mid subcatchments are derived from the ero-sion of fine-grained, valley bottom soils frequently utilized as vegetable fields. Coarser-grained deposits within these wet-lands and reservoirs result from the erosion of sandier hill-slope soils extensively utilized for sugar cane, during rela-tively high magnitude runoff events that are capable of trans-porting sand-sized sediment off the slopes. Thus, the source
of sediment to the axial valley varies as a function of sedi-ment size and runoff magnitude. Sedisedi-ment export from upper to lower catchment areas was limited until the early 1990s, in part because the upper catchment wetlands were hydrologi-cally disconnected from lower parts of the watershed during low to moderate flood events. The construction of a drainage ditch through a previously unchanneled wetland altered the hydrologic connectivity of the catchment, allowing sediment to be transported from the headwaters to the lower basin where much of it was deposited within riparian wetlands. The axial drainage system is now geomorphically and hydrolog-ically connected during events capable of overflowing dams located throughout the study basin. The study indicates that increased valley connectivity partly negated the positive ben-efits of controlling sediment/nutrient exports from the catch-ment by means of upland based, best managecatch-ment practices.
1 Introduction
methods to reduce the production and influx of NPS pol-lutants to water resources. To be cost-effective, such man-agement strategies require a sound understanding of the pri-mary NPS pollutant sources, how pollutants are delivered to and transported through aquatic systems, and how various management scenarios will influence NPS pollutant load-ings. While conceptually simple, development of quantitative tools upon which to base management decisions and strate-gies is complicated by multiple and diffuse sources of pol-lutants, their movement as both solutes and particulates, and differences in pathway transport dynamics over varying tem-poral and spatial scales. Fine-grained sediments serve as a particularly important component of the NPS pollutant prob-lem because of their direct impact on biota, and the sorp-tion of nutrients and other contaminants onto particle sur-faces such that many hydrophobic contaminants are predomi-nantly dispersed through river systems in the particulate form (Miller and Orbock Miller, 2007). It follows, then, that any attempt to effectively address NPS pollution requires a highly sophisticated understanding of the spatial and causal linkages among human activities, fine-grained sediment production, and sediment transport and storage processes over a range of time scales.
Historically, sediments (and associated pollutants) eroded from upland areas of a catchment were assumed to move semi-systematically through the drainage system to the basin mouth. This classical continuum view has begun to be re-placed in recent years by a segmented, hierarchical perspec-tive of a drainage network in which channel and valley floor environments can be subdivided into progressively smaller units (Frissell et al., 1986; Kishi et al., 1987; Grant et al., 1990, 1995; Montgomery and Buffington, 1993; Brierley and Fryirs, 2001, 2005; Miller et al., 2012). Each unit, of a given scale, is morphologically homogeneous with respect to land-forms, processes, and other controlling factors such as geol-ogy, vegetation, and substrate (Gant et al., 1995). Common scales of study range from localized channel units (defined on the basis of various river bed features such as pools, rif-fles, bars, etc.), reach-scale units (defined according to the nature of both the channel and valley floor), and larger units ranging up to and beyond the entire drainage basin. Appli-cation of the hierarchal approach for management purposes has focused on reach-scale units, often referred to as pro-cess zones (Montgomery and Buffington, 1993; Miller et al., 2012).
Inherent within the hierarchal systems approach is the per-ception that process zones (as well as units defined at other scales) differ in their ability to produce, transport, and store sediment. A process zone therefore represents a fundamental unit of watershed management that allows distinct strategies to be developed for specific parts of the drainage network.
A closely related concept to the hierarchal view of a river system is connectivity. Connectivity, as used here, refers to the degree to which water and sediment can be transferred from one process zone to the next downstream zone (Hooke,
2003). The geomorphic and hydrologic connectivity of the system is highly dependent on the time scale under consider-ation. For example, drainage systems located in areas char-acterized by seasonal rainfall may be hydrologically con-nected during the wet period, but disconcon-nected during the dry months when the channel possesses both perennial and ephemeral reaches (Miller et al., 2012). Over longer time scales (years to decades), sections of the drainage network may become incised, thereby increasing the surface connec-tivity between the zones, or become filled, creating a dis-continuous drainage system with decreased connectivity be-tween process zones.
In light of the above, the movement of NPS pollutants through a drainage system will not only depend on exist-ing hillslope conditions and management practices, but on the hierarchal structure (morphometry) of the watershed and the connectivity between process zones and other hierarchal units. The primary objective of this paper is to describe spa-tial variations in the source(s), transport, and storage of sed-iment over annual to decadal time scales within the Mka-bela drainage basin, a representative catchment within the KwaZulu–Natal Midlands of eastern South Africa. The uti-lized analysis integrates field and cartographic data of fluvial landforms and processes with detailed geochemical analy-ses of sediment provenance. The latter analyanaly-ses allow for the quantification of long-term (decadal-scale) changes in sedimentation rates and basin connectivity along the axial drainage system.
2 Study area: geologic, geographic and climatic characteristics
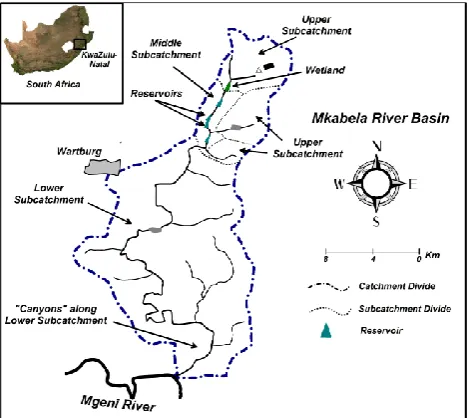
The Mkabela Catchment is located within the KwaZulu– Natal Midlands of eastern South Africa, approximately 25 km from Pietermaritzburg (Fig. 1). The Mkabela River basin was selected for study because (1) it is representative of catchments in the region in terms of size, relief, underly-ing geology, and land use, and (2) is a tributary to the much larger Mgeni River that drains most of the Midlands, and for which a decline in water quality, by means of eutrophication, has been an increasing concern. Important nutrient sources include direct waste water inputs, broken sewer lines, animal wastes, and non-point source inputs, particularly sediment-associated nutrients from agricultural lands.
Fig. 1. Map showing the location of the Mkabela Catchment in South Africa and the position of the defined subcatchments within the basin.
pasture and dairy operations, and maize. Significant areas of the catchment were converted to sugar cane in 1968 to 1970. Current land use varies between three morphologically dis-tinct catchment areas, referred to as the upper, middle (or mid), and lower subcatchments (Fig. 2). Land use within the upper subcatchments is dominated by sugar cane on hill-slopes, and pasture (grasslands), maize and other vegetables on valley floors. Forested areas of wattle and pine are also present on upland areas locally. The middle subcatchment is dominated by sugar cane on hillslopes and pastures (grass-lands) on the valley bottom (Fig. 2). Valley bottom wetlands are common within the upper catchments, and are replaced in mid-catchment areas by riparian wetlands and channelized alluvial valleys periodically interrupted by dams and reser-voirs, most of which were constructed between 1970 and 1980 (the downstream most reservoir within the study area, Fig. 1 was build in 1950). The lower subcatchment is char-acterized by forested riparian wetlands on the valley floor and hillslopes that are predominantly covered by sugar cane vegetation.
[image:3.595.310.546.64.355.2]The basin as a whole is underlain primarily by shales, silt-stones, and red sandstones of the Natal Sandstone and, to a lesser degree, the Dwyka Groups. Nine soils types have been described in sediments overlying the bedrock including Avalon, Cartref, Clovelly, Glencoe, Glenrosa, Hutton, Kat-spruit, Longlands, and Westleigh (Fig. 3).
Fig. 2. Map showing distribution of observed land-use types within the Mkabela Catchment (modified from Lorentz et al., 2011).
3 Methods
3.1 Process zone mapping and characterization
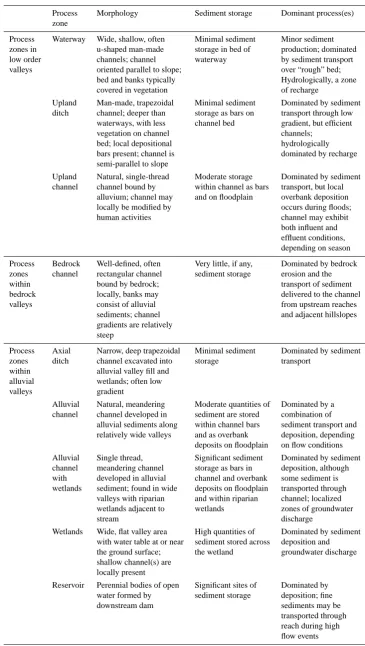
Field and cartographic observations indicated that the catch-ment could be subdivided into distinct process zone and sub-catchment areas (Figs. 1, 4 and 5). Subsub-catchment areas were defined according to changes in hillslope and valley mor-phology (e.g., gradient, width), whereas the processes zones represent stream reaches defined on the basis of their posi-tion on the landscape, their dimensions and cross-secposi-tional form, the composition and nature of the bounding materials (bedrock vs. sediment; sediment size, stratification, etc.), and the relief/gradient of the channel and surrounding terrain. It is important to recognize that while zone types were defined ge-omorphically, each type exhibits specific traits with regard to geomorphic processes (including erosion and deposition) op-erating within the channel, and hydrologic sources and sinks (Table 1).
Table 1. Summary of process zones and their general characteristics.
Process Morphology Sediment storage Dominant process(es)
zone
Process Waterway Wide, shallow, often Minimal sediment Minor sediment
zones in u-shaped man-made storage in bed of production; dominated
low order channels; channel waterway by sediment transport
valleys oriented parallel to slope; over “rough” bed;
bed and banks typically Hydrologically, a zone
covered in vegetation of recharge
Upland Man-made, trapezoidal Minimal sediment Dominated by sediment ditch channel; deeper than storage as bars on transport through low
waterways, with less channel bed gradient, but efficient
vegetation on channel channels;
bed; local depositional hydrologically
bars present; channel is dominated by recharge
semi-parallel to slope
Upland Natural, single-thread Moderate storage Dominated by sediment channel channel bound by within channel as bars transport, but local
alluvium; channel may and on floodplain overbank deposition
locally be modified by occurs during floods;
human activities channel may exhibit
both influent and effluent conditions, depending on season
Process Bedrock Well-defined, often Very little, if any, Dominated by bedrock zones channel rectangular channel sediment storage erosion and the
within bound by bedrock; transport of sediment
bedrock locally, banks may delivered to the channel
valleys consist of alluvial from upstream reaches
sediments; channel and adjacent hillslopes
gradients are relatively steep
Process Axial Narrow, deep trapezoidal Minimal sediment Dominated by sediment
zones ditch channel excavated into storage transport
within alluvial valley fill and
alluvial wetlands; often low
valleys gradient
Alluvial Natural, meandering Moderate quantities of Dominated by a channel channel developed in sediment are stored combination of
alluvial sediments along within channel bars sediment transport and relatively wide valleys and as overbank deposition, depending
deposits on floodplain on flow conditions
Alluvial Single thread, Significant sediment Dominated by sediment channel meandering channel storage as bars in deposition, although with developed in alluvial channel and overbank some sediment is wetlands sediment; found in wide deposits on floodplain transported through
valleys with riparian and within riparian channel; localized
wetlands adjacent to wetlands zones of groundwater
stream discharge
Wetlands Wide, flat valley area High quantities of Dominated by sediment with water table at or near sediment stored across deposition and the ground surface; the wetland groundwater discharge shallow channel(s) are
locally present
Reservoir Perennial bodies of open Significant sites of Dominated by water formed by sediment storage deposition; fine
downstream dam sediments may be
Av Av Av
Ka
Lo Lo Av
Cv Ka
Av Av
Lo We We We Gs
Gs
.
Av
Av
Gc
Gc
Cf We
Lo
Cf
Cf Hu
Cf
Hu Gc Av - Avalon
Cf -Cartref Cv - Clovelly Gc - Glencoe Gs - Glenrosa Hu - Hutton Ka - Katspruit Lo - Longlands We - Westleigh
We
Soil Form
Variations in Slope (%)
0-1
4-7 2-4 1-2
[image:5.595.49.285.63.372.2]7-15 15-20 20-100
Fig. 3. Six soil types found on Mkabela Catchment (after Le Roux et al., 2006).
on the type and distribution of the process zones and the abil-ity of the drainage network to transfer water, sediment, and any nutrients that they carry down catchment.
3.2 Geochemical tracing
Two types of geochemical tracing studies were applied to a series of sediment cores extracted from wetland and reser-voir deposits within the Mkabela Catchment. First, a geo-chemical fingerprinting and mixing model approach was uti-lized to determine the relative percentage of sediment within a wetland of the upper subcatchment and an upstream sec-tion of the middle subcatchment that was derived from the primarily soil and land-use types within the basin. This anal-ysis provides insights into the provenance of sediment de-livered to depositional areas of the valley floor. Second, Cu and Zn were used as tracers to gain insights into the geomor-phic connectivity, and changes in connectivity, with the entire drainage system through time. Cu and Zn could be utilized as tracers within the Mkabela Catchment because they are pri-marily associated with soil amendments used on vegetable (cabbage, maize) fields predominately located in headwa-ter areas. Thus, variations in their concentration within sedi-ment extracted from cores located along the drainage system
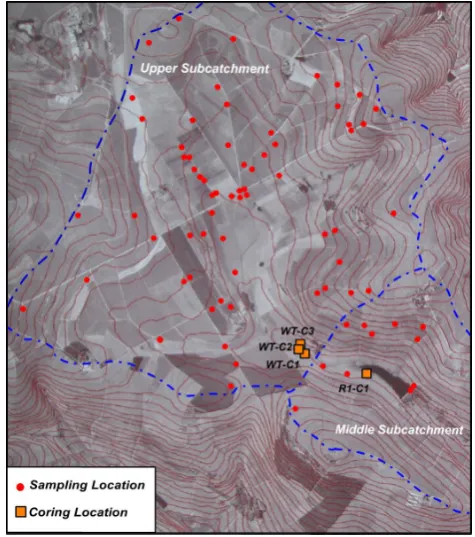
Fig. 4. Sampling and coring locations within the Mkabela Catchment.
reflected the downstream movement of particulates from the upper subcatchment, through the middle subcatchment, and ultimately to a riparian wetland cored within the lower sub-catchment. When combined, results from the two methods yield insights into both sediment provenance from upland ar-eas to the valley floor and the geomorphic connectivity of the drainage network over a period of decades.
3.2.1 Collection, sedimentology and analysis of sediment cores
The two geochemical tracing methods described above were applied to four cores collected in 2008 from the upper and middle subcatchments, including one core from the margin of the upstream-most reservoir (R1-C1), and three cores from the wetland (WT-C1, WT-C2, and WT-C3) (Fig. 4). A fifth core (B2WTC1) was collected in 2009 from a riparian wet-land located along the channel in the uppermost portion of the lower catchment (Fig. 5). All of the cores were shipped to the Nevada Bureau of Mines and Geology and subse-quently described, photographed, and sampled for geochem-ical analyses.
[image:5.595.308.546.64.333.2]Fig. 5. Delineation of process zones and subcatchment areas within the upper and middle subcatchments.
the digestion of 200 mg of dried and homogenized sediment, <2 mm in size, in 125 mL polypropylene screw-top bottles containing 4 mL of aqua regia. These were sealed and held in a 100◦C oven for 60 min. The leachates were then trans-ferred to 200 mL volumetric flasks, brought up to volume with ultra-pure water and stored until analyzed by ICP-MS. With respect to total elemental concentrations, the Platform was calibrated using USGS, NIST, and in-house standard reference materials (SRMs). Reagent blanks and the ana-lyte concentrations for the SRMs were plotted against blank-subtracted integrated peak areas. A regression line was fitted to this array of calibration points and the equation of the line was used to quantify unknown sample concentrations. Devi-ation of standards from the regression line was used to esti-mate analytical accuracy, which was generally±3 to 5 % of the amount present when determining total concentrations. Replicate analyses were used to determine analytical preci-sion, which was generally<±5 % for most elements. With respect to Pb isotopic analyses, precision when comparing data from individual digestions was 0.2 to 0.3 % relative de-viation (one sigma) for206Pb,207Pb, and208Pb. Instrumen-tal precision was better. Accuracy of isotopic measurements was assessed with the NIST 981 lead isotope standard. Ac-curacy was typically better than±0.5 %, and systematic in-strumental bias was corrected. Given the limited abundance of204Pb, precision and accurracy values were much higher; thus,204Pb was not used as a potential tracer.
Selected cores were dated by means of210Pb (137Cs lev-els were too low to yield useful results). The analyses were carried out by Flett Research Ltd. located in Winnipeg, Canada. Flett Research was also contracted to use the raw
210Pb data to model the age-depth relationships within the
cores. As is typical of210Pb analyses, background values of
210Pb in the cores was determined by comparison with226Ra
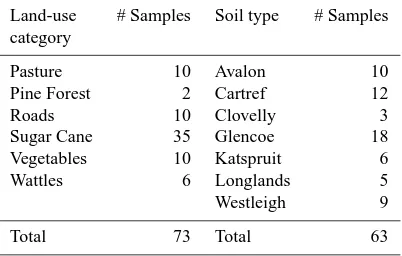
Table 2. Summary of samples collected in May 2008. Samples from roads were not included in the statistical analysis (see text).
Land-use # Samples Soil type # Samples category
Pasture 10 Avalon 10 Pine Forest 2 Cartref 12 Roads 10 Clovelly 3 Sugar Cane 35 Glencoe 18 Vegetables 10 Katspruit 6 Wattles 6 Longlands 5 Westleigh 9
Total 73 Total 63
measured near the bottom of the core. The results were then used to determine sedimentation rates at the site. Depth-age curves were modeled using the constant rate of supply (CRS) method (Appleby and Oldfield, 1978).
3.2.2 Upland sediment sampling and analysis
[image:6.595.328.529.94.222.2]All of the upland samples were loaded into pre-cleaned polypropylene sampling containers, which were subse-quently placed in plastic sampling bags, and shipped to the Nevada Bureau of Mines and Geology in the USA where they were analyzed by ICP-MS for the same elements as the core samples (as described above).
3.2.3 Source modeling procedure
Determination of the relative contribution of sediments from the source areas relies on the use of a sediment mixing model. The basic premise underlying the use of geochemical finger-printing of NPS pollutants is that the processes involved in the erosion, transport, and deposition of sediment ultimately result in a deposit that represents a mixture of material de-rived from multiple source areas within the catchment. It is then possible to characterize the sediments within the source areas and the downstream alluvial/lacustrine deposits for a suite of parameters and statistically compare their parameter characteristics to unravel the relative proportion of sediment that was derived from each source type (Miller and Orbock Miller, 2007). During this investigation, the original model used by Miller et al. (2005) was modified using the approach provided by Rowen et al. (2000) to estimate sediment source contributions from the hillslopes to the cored deposits.
Constraints on the mixing model require that (1) each source type contributes some sediment to the mixture, and thus the proportions (xj,j= 1, 2, ...n), derived fromn in-dividual source areas must be non-negative (0≤xj≤1), and (2) the contributions from all of the source areas must equal unity, i.e.,
n X
j=1
xj =1. (1)
In addition, some differences (error) between the values of themmeasured parameters, in the source area,aij(i= 1 ...m, j= 1 ...n) and the mixture,bi (i= 1 ...m) must be allowed. The residual error corresponding to thei-th parameter can be determined as follows:
εi =bi − n X
j=1
aijxj (2)
fori= 1, 2, ...m, whereaij (i= 1, 2, 3 ...m,j= 1, 2, ...n) are the measurement on the corresponding i-th parameter within thej-th source area andxj is the proportion of the j-th source component in the sediment mixture. When the number of measured parameters is greater than the number of source areas (m≥n), the system of equations is over-determined, and a “solution” is typically obtained using an iterative computational method that minimizes an objective function using a gradient search, thereby obtaining a best fit solution to the entire data set (Yu and Oldfield, 1989). There are several ways to obtain a best fit, but in previous studies,
the objective function,f, has taken the form of the sum of the relative errors (Yu and Oldfield, 1989) where
f (x1, ..., xm)= m X
i=1
|εi/bi| (3)
or (Collins et al., 1997a)
f (x1, ..., xm)= m X
i=1
(εi/bi)2. (4)
However, in the case wheref is relatively “flat”, the gradient near zero may halt an iterative search method prematurely.
We take an alternative route, following Rowan et al. (2000) and Nash and Sutcliffe (1970), whereby we create the effi-ciency function
E (x1, ..., xm)=1− m P
i=1
(εi)2
m P
i=1
(bi −di)2
, (5)
wheredi (i= 1, 2, 3 ... m) is the mean of the i-th param-eter over all source regions. An ideal solution would re-sult in E= 1 or 100 % efficiency. We then create a parti-tion of all possible combinaparti-tions of non-negative n-tuples (x1, ..., xn) satisfying the unity constraint (Eq. 1), by in-crements of 1x= 0.05. By evaluatingE at each of then -tuples, we are able to determine the specific combination of the source contributionsxˆ= (x1, ..., xn) yielding the maxi-mum efficiency on the partition.
As Rowan et al. (2000) pointed out, the efficiency func-tion E has a maximum value atxˆ, but there may be a range ofn-tuples having an efficiency within a specified tolerance of the maximum efficiency. That is, there are a number of solutions that are statistically equivalent. For example, us-ing the data from sample WT-C1-1, the optimal efficiency value was 0.9963 when 50 % of the contribution was from cane, 25 % from Maize and vegetable, and 25 % from wattle groves. Yet we see that there is a small range of proportions for each source that yields efficiency levels at the 0.95 level or above.
limited catchment areas increase the probability that eroded sand-sized and smaller sediment will be transported from the source to the point of deposition within the timeframe repre-sented by a sample extracted from the analyzed cores.
It order for the model to describe the relative quantity of sediment eroded from each of the source areas, it must be as-sumed that the sediment leaves all sources and is transported downstream at an equal rate so that it arrives at the sampling point simultaneously. This assumption is often violated by differences in the proximity of a source to the sampled depo-sitional area, or differences in the rate at which particles of differing size are transported downstream. It must be recog-nized, then, that the estimated contributions with regards to upland erosion rates are likely to be biased. We believe, how-ever, that the bias is minimal because with the exception of the vegetable plots (which includes areas of maize), the de-fined sources upstream of the sampled wetland and reservoir are distributed throughout much of the catchment (Fig. 2). More importantly, the mixing model will accurately describe the source of the sediment delivered to, and found within, the wetland and reservoir deposits within the limitation of the utilized statistical methods. In this study, our interests pri-marily are focused on the relative contribution of sediment from the various source types found within the wetland and reservoir deposits (rather than the amount of sediment eroded from various source types) as these differences are reflective of downstream sediment delivery and connectivity.
4 Results and discussion
4.1 Drainage network characteristics
Field and cartographic data show that the drainage network within the Mkabela Basin can be subdivided into nine distinct process zones on the basis of their position on the landscape, valley dimensions and form, the underlying geological de-posits in which they are developed, and the degree to which they have been affected by human activities (Lorentz et al., 2011). Each of these defined process zones is dominated by a suite of geomorphic and hydrologic processes as described in Table 1, and occurs with different frequencies within distinct segments of the catchment referred to as the upper, middle, and lower subcatchments (Fig. 5). The general size and relief of the subcatchments are provided in Table 3.
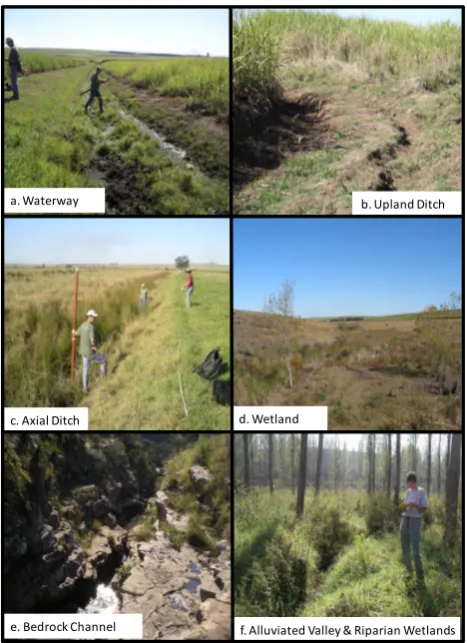
Upper subcatchments comprise the upstream-most (head-water) areas of both axial and large tributary drainage sys-tems (Figs. 1 and 5). Within these upper subcatchments, hill-slope drainage has often been significantly modified by cul-tivation, particularly in areas of sugar cane, in part to reduce the removal of sediment from the cultivated slopes. However, hillslopes are locally traversed by a relatively high density (approximately 2.5 km km−2) of man-made, low-gradient, u-shaped “waterways” that are oriented perpendicular to topo-graphic contours (Fig. 6a, Table 1). Hillslope runoff and flow
f. Alluviated Valley & Riparian Wetlands e. Bedrock Channel
a. Waterway
c. Axial Ditch
b. Upland Ditch Ditch
[image:8.595.311.545.62.384.2]d. Wetland
Fig. 6. Photographs of selected process zones types defined within the Mkabela Catchment.
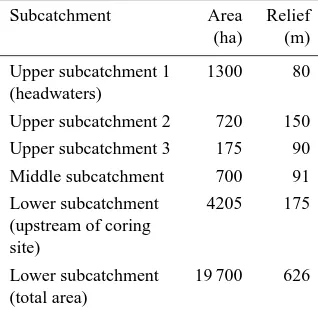
Table 3. Summary of subcatchment characteristics. See Figs. 1 and 4 for subcatchment locations.
Subcatchment Area Relief (ha) (m)
Upper subcatchment 1 1300 80 (headwaters)
Upper subcatchment 2 720 150 Upper subcatchment 3 175 90 Middle subcatchment 700 91 Lower subcatchment 4205 175 (upstream of coring
site)
Lower subcatchment 19 700 626 (total area)
an extensive wetland devoid of an integrated network of sur-face channels. Field observations indicate that the water ta-ble within the wetland is below the ground surface during the dry season, but is at or near the ground surface during wetter months. The extensive wetlands found within the ax-ial valley system of the upper catchment are dominated by relatively low channel and valley gradients and depositional processes.
The middle subcatchment begins downstream of the bedrock constricted wetland (Fig. 5). Hillslopes within this portion of the basin are also dominated by sugar cane fields that possess numerous waterways (Fig. 2). However, many of the waterways along the western side of the catchment are short, drain relatively small areas, and are disconnected geomorphically from the axial valley, limiting their ability to directly deliver sediment to the axial channel. Perhaps of more importance with respect to sediment transport, the axial drainage system within the middle subcatchment is charac-terized by a continuous, relatively shallow, but high gradient (∼0.008m m−1) alluvial channel that is locally boarded by disturbed riparian wetlands. The channel is disrupted by four separate farm dams and their associated reservoirs (Fig. 5). Water flows over the top of the dams throughout most of the year, but during wet season storms the movement of water through the reservoir and over the dam can be particularly intense. Immediately below the fourth dam, the stream con-sists of a bedrock channel locally characterized by a series of knickpoints (Fig. 6e). The river then enters the lower sub-catchment.
The lower subcatchment is dominated by a low gradient, alluvial channel boarded by extensive and forested riparian wetlands (Figs. 2 and 6f). The wetlands are intermingled with areas of sugar cane that also occur locally on hillslopes. In marked contrast to the upstream subcatchments, upland areas within the lower subcatchment exhibit very few waterways, axial ditches, or upland channels, in spite of the fact that val-ley floors are incised well below the surrounding terrain. The
Table 4. Discriminate analysis classification matrix. (A) Soil type and (B) land use.
(A) Number of samples classified per soil type % Soil type Av Cf Cv Ka Gc Lo We Correct
Av 9 0 0 1 0 0 0 90
Cf 0 9 3 0 0 0 0 75
Cv 0 0 3 0 0 0 0 100
Ka 0 0 1 5 0 0 0 83
Gc 3 0 1 0 11 1 2 61
Lo 0 0 0 0 0 5 0 100
We 0 0 0 0 1 0 8 89
Totals 12 9 8 6 12 6 10 79
(B) Number of samples classified per soil type % Land use Sc Veg Wt Pine Rds Past Correct
Sc 22 3 9 0 1 0 63
Veg 0 8 2 0 0 0 80
Wt 0 0 5 1 0 0 83
Pine 1 0 0 1 0 0 50
Rds 0 0 2 0 6 2 60
Past 0 0 2 0 1 7 70 Totals 23 11 20 2 8 9 67
Av – Avalon; Cf – Cartfer; Cv – Clovelly; Ka – Katspruit; Gc – Glencoe; Lo – Longlands; We - Westleigh; Sc – Sugar Cane; Veg. – Vegetables; Wt – Wattles; Pine – Pine Grove; Rds – Roads; Past – Pasture
low gradient nature of the axial channel, and the broad allu-vial valley consisting of extensive riparian wetlands, forms a highly depositional environment that allows for the storage of large volumes of sediment (as described below).
4.2 Sediment provenance analyses
4.2.1 Delineation of geochemical fingerprints
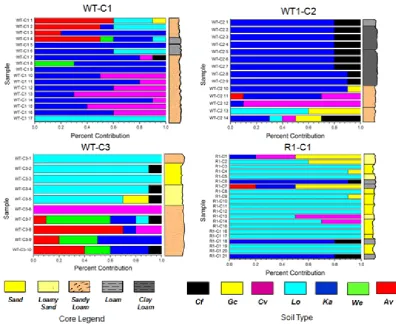
[image:9.595.311.546.92.304.2]Fig. 7. Relative percent of sediment derived from specific soil types within the catchment. Av – Avalon, Cf – Cartref, Cv – Clovelly, Gc – Glencoe, Ka – Katspruit, Lo – Longlands, We - Westleigh.
on the landscape (steep slopes) and possess sandy-textured horizons.
A stepwise discriminate analysis was also carried out for sediment sources defined by land use. The selected param-eters were the same as those used to differentiate soil types (Ti, Cr, Ga, Nb, La, Ce, Lu, and Hf) (Table 4b). Source mate-rial samples collected from specific land-use categories were incorrectly classified about a third of the time. The difficulty of correctly identifying a particular land cover may be related to two factors. First, crop rotations may potentially produce a mixed geochemical signal with regards to land use. The mapping of sediment provenance onto land use when land use has changed through time is a recognized problem asso-ciated with the use of geochemical fingerprinting techniques. Primarily at issue is whether alterations in land use will lead to changes in the concentration of the elements used to define the geochemical fingerprint such that the geochemistry of the sediment source samples reflects both its current and past land-cover history, or, perhaps more accurately, inhibits the identification of a geochemical fingerprint capable of defin-ing a specific land-use type. While potentially problematic, we believe that shifting land use did not significantly affect our results. Land areas covered in wattle and pine forests as
well as pasture have presumably changed little over at least the past four decades. Areas planted in sugar cane also have been relatively stable since its introduction into the catch-ment in 1968. Most maize fields were present prior to 1968, although some areas of maize were converted to sugar cane as it was introduced into the catchment. The most recent transition in land use is associated with the conversion of a dairy operation in the headwaters of the catchment to cab-bage fields around 2001. Difficulties in creating a fingerprint as a result of these land-use alterations that occurred are most likely to be associated with elements applied to agricultural fields as a soil amendment (e.g., fertilizers). The geochemical fingerprints developed for the various land-use types defined in this study were based on highly immobile rare earth el-ements which are less likely of exhibiting rapid changes in concentration within the sampled materials.
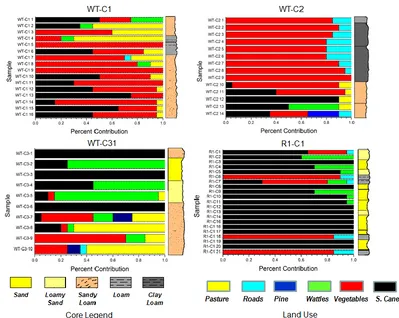
Fig. 8. Relative percent of sediment derived from specific land-use types within the catchment.
4.2.2 Modeling results
The location and general characteristics of cores collected, geochemically analyzed, and modeled to assess sediment provenance within the Mkabela Basin are provided in Fig. 5 and Table 5, respectively. The soil source modeling (in which provenance was defined on the basis of soil type) shows that three distinct intervals are present in WT1-C1 (Fig. 7). Samples 10–16 are composed exclusively of Clovelly (CV) and Katspruit (Ka) soil types. The relative contributions of Clovelly range from 10 to 70 %, and average 40 %; Katspruit ranges from 40 to 90 %.
Samples 7–9 are dominated by Katspruit (>60 %), with minor contributions of Westleigh (We), Avalon (Av), Catref (Cf), and Longlands (Lo), in three of the samples. The upper part of the core (samples 1–4) primarily consist of Avalon (30–60 %), Katspruit (10–70 %), and Longlands (10–40 %) soil types, with minor contributions of Glencoe (Gc) and Westleigh.
Boundaries between two of the major source type inter-vals within the core roughly correspond to stratigraphic unit boundaries. The boundary between the mid-interval (sam-ples 7–9) and the lower interval (sam(sam-ples 10–16) imprecisely correlate with a gradational stratigraphic boundary within the core.
Core WT-C1 can also be subdivided into three distinct in-tervals with respect to modeled land-use sediment sources (Fig. 8). The three intervals correlate with the intervals de-noted for soil type. Samples 10–16 are composed predom-inantly of sediment from cane (15–75 %) and vegetable (30–80 %) fields. The samples also contain minor amounts of sediment from pastures (<10 %). The intermediate in-terval (samples 7–9) is dominated by sediment from veg-etable fields (generally>70 %). However, in comparison to the lower unit, the interval exhibits a notable increase in sediment from pastures (∼10–25 %), and localized, minor amounts of material from roads and wattle-covered terrain. With the exception of sample 5, the upper 6 samples contain a wider range of source inputs. The dominant sources for these samples include sediment from vegetable fields, pas-tures, and cane fields, with lesser amounts of sediment from wattle-covered terrain (Fig. 8).
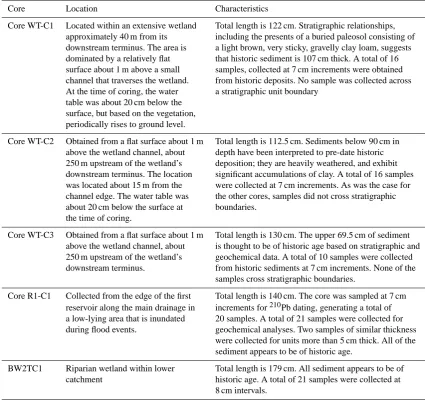
Table 5. Summary of collected cores.
Core Location Characteristics
[image:12.595.83.509.82.482.2]Core WT-C1 Located within an extensive wetland Total length is 122 cm. Stratigraphic relationships, approximately 40 m from its including the presents of a buried paleosol consisting of downstream terminus. The area is a light brown, very sticky, gravelly clay loam, suggests dominated by a relatively flat that historic sediment is 107 cm thick. A total of 16 surface about 1 m above a small samples, collected at 7 cm increments were obtained channel that traverses the wetland. from historic deposits. No sample was collected across At the time of coring, the water a stratigraphic unit boundary
table was about 20 cm below the surface, but based on the vegetation, periodically rises to ground level.
Core WT-C2 Obtained from a flat surface about 1 m Total length is 112.5 cm. Sediments below 90 cm in above the wetland channel, about depth have been interpreted to pre-date historic 250 m upstream of the wetland’s deposition; they are heavily weathered, and exhibit downstream terminus. The location significant accumulations of clay. A total of 16 samples was located about 15 m from the were collected at 7 cm increments. As was the case for channel edge. The water table was the other cores, samples did not cross stratigraphic about 20 cm below the surface at boundaries.
the time of coring.
Core WT-C3 Obtained from a flat surface about 1 m Total length is 130 cm. The upper 69.5 cm of sediment above the wetland channel, about is thought to be of historic age based on stratigraphic and 250 m upstream of the wetland’s geochemical data. A total of 10 samples were collected downstream terminus. from historic sediments at 7 cm increments. None of the
samples cross stratigraphic boundaries.
Core R1-C1 Collected from the edge of the first Total length is 140 cm. The core was sampled at 7 cm reservoir along the main drainage in increments for210Pb dating, generating a total of a low-lying area that is inundated 20 samples. A total of 21 samples were collected for during flood events. geochemical analyses. Two samples of similar thickness
were collected for units more than 5 cm thick. All of the sediment appears to be of historic age.
BW2TC1 Riparian wetland within lower Total length is 179 cm. All sediment appears to be of catchment historic age. A total of 21 samples were collected at
8 cm intervals.
sample 11 to 12 that is dominated by sediment from Clovelly (30–90 %) and Katspruit (10–60 %) soils, with minor contri-butions from Avalon soils (0–10 %). The majority of the core, ranging from sample 1 to 11, is dominated by sediment from Katspruit (80–90 %), with<20 % coming from Catref soils, except in the lowermost sample. This latter sample contains sediment from Glencoe rather than Catref soils. Changes in sediment source contributions correspond to stratigraphic unit boundaries.
With regards to land use, sediment provenance within Core WT-C2 can be subdivided into two intervals which closely, but not precisely, match the boundaries denoted for soils. The lowermost deposits (sample 10) contain relatively large percentages of sediment from cane fields (Fig. 8), whereas the overlying sediments are predominantly derived from veg-etable fields (>80 %) with lesser contributions from roads. Sample 10, located along the boundary between the two
intervals appears transitional in terms of source, consisting of large amounts of sediment from vegetable fields (as is the case for the overlying deposits), as well as minor amounts of sediment from cane fields and pastures (as is the case for the lower deposits).
Changes in sediment provenance modeled with respect to land use closely parallel noted changes in provenance as-sessed by soil type. The lowermost sediments (samples 7– 10) are composed primarily of sediment from pastures (15– 70 %), and in decreasing order, vegetable fields (5–70 %), wattles groves (5–15 %), pine groves (0–15 %), cane (5– 20 %) and roads (0–10 %). The uppermost part of the core (from 0–30 cm, samples 1–5) consists primarily of sediment from cane fields (10–100 %) and wattles (45–85 %), with small amounts (5 %) from vegetable fields and pastures in sample 5. Sample 6, which separates the two intervals and which is found at the top of a stratigraphic unit, consists ex-clusively of sediment from cane fields.
Core R1-C1 was obtained from the margin of reservoir lo-cated within the middle catchment. The majority of sediment within the reservoir was derived from Longlands soil, with the exception of five notable, but thin, horizons. Sampling intervals 18 and 21 at the bottom of the core are composed predominantly of sediment from Katspruit type soils. Sam-ples 13–14 contains 30–50 % Covelly soil material, in ad-dition to Longlands. The loamy fine sand to loam textured materials associated with samples 6 and 7 contain no de-finable sediment from Longlands soils, but are dominated by Katspruit (sample 6) or a mixture of Katspruit, Glencoe, and Clovelly (sampling interval 7). The uppermost sediments also contain significant amounts of Clovelly type materials as well as Glencoe and Katspruit in the case of sampling interval 1.
With regards to land use, the majority of the sand domi-nated sediment within Core R1-C1 appears to have been de-rived from cane fields. Fine-grained, loamy sediments (e.g., found in sampling intervals 1, 6, 7, 18, and 19) appear to have been derived primarily from vegetable plots. Figure 8 also shows that there is a notable increase in the contribution of sediment from wattle groves within and above sample 11, as well as vegetables and roads, at and above sample 8 fol-lowing a period of input primarily from cane fields between samples 12 and 16.
4.2.3 Sedimentation rates
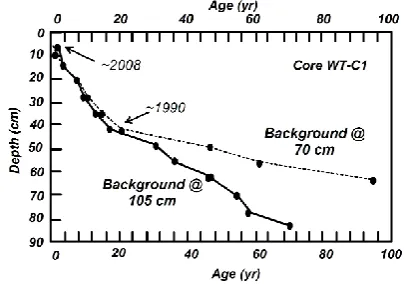
Samples from two cores (WT-C1 and R1-C1) were analyzed for210Pb to (1) determine the age of the deposits as a func-tion of depth, and (2) estimate sedimentafunc-tion rates for spe-cific time intervals. These two cores were selected on the ba-sis of their location (one from the upstream-most wetland and one from the reservoir) and their relatively complete strati-graphic nature (in which the core extended through historic to pre-historic sediments).210Pb in the relatively fine-grained sediment of Core WT-C1 was measurable, but low (Fig. 9). A226Ra measurement of 0.82 DPM g−1 in the deepest sec-tion (at 112–122 cm depth), which based on stratigraphic data represent pre-historic sediment, is similar to the210Pb measurement of 0.60 DPM g−1 in the same section. This
[image:13.595.325.528.64.206.2]210Pb measurement suggests that background levels of210Pb
Fig. 9. Estimated age of the sediments in Core WT-C1 as deter-mined by210Pb analysis. The slope of the line in age-depth plot rep-resents the sedimentation rate. Sedimentation rates increase above 41.2 cm, or after about 1992.
have been attained at 105 cm. Although210Pb values diverge slightly from the measured 226Ra value, background may have been attained at the shallower depth of 70 cm depth (R. Flett, personal communication, 2008).
Age-depth relations were modeled using the constant rate of supply (CRS) method for background values at both 105 and 70 cm, generating two age-depth curves (Fig. 9). Both curves are presented to provide the range of age-depth relations that may exist, depending on the background depth that is utilized. The two analyses yield similar results for the upper 6 samples (last 20 yr), but progressively diverge after that (Fig. 9). Both analyses indicate that sedimentation rates within the wetland are relatively uniform until the end of the 1980s, at which point sedimentation rates begin to increase significantly to the present.
The210Pb content of the sediment from R1-C1 was very low and irregular, showing no consistent pattern. This pat-tern is presumably related to the coarse-grained nature of the reservoir deposits as measurable concentrations were found in the fine-grained units. In any case, it was not possible to determine with confidence the date of deposition of any of the sediments within the core from the reservoir (R1-C1).
4.2.4 Controls on sediment source
Table 6. Brief description of the primarily soil types found in the study area (after Le Roux et al., 2006).
Soil type General characteristics
Avalon (Av) The Avalon soil type surveyed to 120 cm depth and consists primarily of soft plinthic B horizons which is a sandy yellow-brown B horizon underlain by hard plinthic horizons.
Cartref (Cf) Shallow, sandy soils with very little water holding capacity found on steep, short, convex hillslopes.
Clovelly (Cv) Associated with, and similar to, Longlands soil type.
Glencoe (Gc) Similar to Avalon soil type, but dominated by hard plinthic subhorizon; found on steeper slopes of higher relief. Parent material is thought to be the Natal Group Sandstone (NGS).
Hutton (Hu) Found near crest and midslopes of high relief, steep hillslopes. Moderately drained, underlain by NGS.
Katspruit (Ka) Clayey, strongly gleyed soils found on low-relief (10–15 m) terrain, particular valley bottoms.
Longlands (Lo) The Longlands soil type was surveyed up to 120 cm depth and consists of soils that are sandier than the Avalon soils with similar profile of soft plinthic B horizons well developed underlain by hard plinthic horizons.
Westleigh (We) The Westleigh soil type was surveyed up to 110 cm depth and consist a poorly drained hydrosequence dominated by clayey soils with prominent mottling and deep, clayed subsoils.
deposition, differences in flow magnitudes (owning to dif-ferences in catchment size), or a combination of the three factors.
The utilized sediment mixing model suggests that nearly all of the sand-sized sediment within the reservoir is derived from Longlands and, to a much lesser degree, Clovelly soils. Both of these soil types exhibit sandy textures within the catchment (Table 6; Le Roux et al., 2006). They tend to be sandier than the clay-rich Westleigh or Avalon hillslope soils, and much sandier than valley bottom soils such as the clayey Katspruit soil (Le Roux et al., 2006). The geographic dis-tribution of Longlands and Clovelly soils has been mapped in detail for only the headwaters of the Mkabela Catchment (Fig. 3). Here Longlands and Clovelly soils are located along the eastern corner of the catchment, and are shown to abut Cartref soils on the 1 : 100 000 soils map (Fig. 3). The ar-eas shown as Cartref soils on the 1 : 100 000 scale map is dominated by Cartref types soils, but also include localized areas of other soil types including Longlands and Clovelly soils that could not be shown on a map of this scale. Thus, the Longlands and Clovelly soils shown on the detailed soils map extend further south and underlay a portion of the east-ern hillslopes which drain into the wetland and the reservoir. It appears reasonable, then, that Longlands and Clovelly soils serve as the primary source of sand-sized sediment within the reservoir, particularly given the relatively steep slopes (4– 7 %) upon which they occur.
The hillslopes underlain by Longlands and Clovelly soils are primarily covered by sugar cane. This is also consistent with the land-use based mixing model results which indicate that the majority of the sand-sized sediment was derived from cane fields.
Several loam-textured layers occur within the reservoir core (R1-C1) (Figs. 7 and 8). These finer-grained units were modeled to consist of sediment primarily derived from Kat-spruit, and to a much lesser degree, Cartref, Glencoe, and Avalon soils. As would be expected, Katspruit soils are rich in clay as are Avalon and Glencoe soils (although not to the degree of Katspruit soils) (Le Roux et al., 2006).
The Katspruit soils are primarily covered by vegetable fields on relatively flat sections of the valley bottom, and the land-use based modeling suggests that the loamy de-posits within the reservoir are primarily derived from veg-etable fields, with minor contributions from roads (with a clay-plinthic base) and cane fields (presumably underlain by Avalon or other clayey hillslope soil).
cane, respectively (Figs. 7 and 8). Finer grained deposits (loam textured) between samples 7–9 were derived, accord-ing to the model, from Katspruit and Westleigh soils (both fine grained) overlain by vegetables (including Maize, which can be found on Westleigh hillslopes).
A detailed examination of the modeling results indicates that a significant change in sediment source near the mid-dle to top of the wetland and reservoir cores is superimposed on the texture, soil type, land-use association. In Core WT-C1, the change in source begins at a depth of approximately 55 cm (sample 8) with a progressive increase in the contri-bution of sediment from pastures, wattles, and, to a much lesser degree, roads. Avalon and Longlands soil contributions also become more prevalent. The top of Core WT-C3 (above sample 6) also exhibits an increase in the contribution of sediment from wattle groves, and an increase in Longlands and Cartref soil types (the latter of which underlies wattle groves). In Core WT-C2, sediment above sample 10 (62 cm) is derived almost exclusively from areas composed of Kat-spruit soils and vegetable fields, with a rather abrupt input of material from roads. Further downstream in the reservoir, the change in source is characterized by an increase in sed-iment from wattle groves, and an increase in sedsed-iment from Glencoe soils.
Interestingly, changes in sediment source coincide with a notable increase in sedimentation rates from approximately 0.67 to 2.21 cm yr−1as determined using210Pb data in Core WT-C1. The210Pb data suggest that the change occurred be-tween approximately 1988 and 1992.
The noted changes in sediment source and sedimentation may be related to (1) changes in land use and crop type through time, both in terms of the absolute area covered and their position on the landscape, and (2) changes in manage-ment strategies. It is more likely, however, that the alterations are associated with a major alteration in the geomorphic con-nectivity of headwater drainages that increased sediment de-livery to the wetland and reservoir. Discussions with a local sugar cane farmer revealed that in the early 1990s, small ar-eas of maize were changed to sugar cane. This would have involved contouring and water way development associated with cane, in order to limit off-site sediment yields.
At the time of the conversion of these maize fields to sugar cane, the valley bottom upstream of the cored wetland also consisted of a wetland that was consistently flooded, re-sulting in the deposition of sediment in an area which the farmer was attempting to pasture. Thus, a ditch was exca-vated through this wetland immediately upstream of the large tributary entering from the west (and which drains the wattle grove) (Fig. 5). The net result was an increase in geomor-phic and hydraulic connectivity that allowed drainage from the fields within the headwater areas of the catchment and the western tributary to be transported further downstream. The change appears as (1) an increase in sedimentation rates in Core WT-C1, and (2) an increase in sediment from the wat-tles and Cartref soils from the tributary, as well as a road that
previously limited downstream drainage. The increased con-tribution of sediment from pastures, present in Core WT-C1, is probably due to bank erosion along the excavated ditch.
Core WT-C2 exhibits a significant increase in sediment from vegetable fields underlain by Katspruit soils, at the ex-pense of sediment from cane fields. Given the conversion of some maize fields to sugar cane upstream of the cored wet-land around 1990, the change in sediment provenance is sur-prising. However, it may be related to better sediment control practices on the cane fields which allowed a larger proportion of the sediment to be derived from the vegetable plots (pri-marily cabbage). It is also important to remember that sedi-ment source is texture dependent, so that the contribution of sand-sized sediment from the cane fields was shown to in-crease within Cores WT-C3 and WT-C1 as a result of the drainage alteration.
It is significant to note that the relative contributions to the cored wetland and reservoir as determined from the mix-ing model cannot be quantitatively extrapolated to lower-subcatchment areas. Ideally, we would have performed the analysis on other downstream depositional environments, but financial constraints, particularly the costs of analyzing a larger number of upland samples, inhibited our ability to do so. We suspect that the relative contributions of sediment from the defined sediment sources will change along the val-ley to a limited degree as a result of (1) minor changes in the spatial distribution of primary soil and land-use types be-tween the upper, middle, and lower subcatchments, (2) sed-iment storage within downstream reservoirs, and (3) differ-ences in the relative percentage of runoff contributed to the channel from the upper, middle, and lower subcatchment ar-eas. With regards to the latter, stable isotopic data (H, O) show that between 22 and 75 % of the discharge in the chan-nel near the coring site within the lower subcatchment is de-rived from basin areas located downstream of the reservoirs. These isotopic data suggest that a non-negligible portion of the sediment is likely to be derived from downstream areas during at least some flows.
4.3 Insights into geomorphic connectivity from other geochemical tracers
Several trace elements provide useful information regarding the downvalley transfer of sediment within the entire section of the studied catchment. The two of most importance are Cu and Zn. Both elements are contained in fertilizer known to have been used on vegetable fields (cabbage, maize) pre-dominantly located within the upper subcatchment (Fig. 2). In fact, the utilized fertilizer is reported (on its bag) to contain 2.5 % Zn. The potential impact of the fertilizer on Zn concen-trations in the soil is illustrated by comparing the amount of Zn within pasture and vegetable fields underlain by the same soil type (Katspruit). The pasture samples exhibit a mean Zn concentration of 3.58 µg g−1, compared to a concentra-tion of 139 µg g−1for the vegetable plots, the latter higher by two orders of magnitude (Fig. 10). In addition, Zn concentra-tions within soils of the vegetable plots are much higher than is generally observed for uncontaminated bedrock (16–105 µg g−1) or soils (60 µg g−1), (Turekian, 1971; Buonicore, 1996; Miller and Orbock Miller, 2007). Similar trends are found for Cu, although differences between background ma-terials and the vegetable plots are not as significant (Fig. 10). Cu and Zn concentrations within the wetland cores vary systematically with depth, but the trends are distinctly differ-ent (Fig. 11). Variations in observed trends can be explained, however, by differences in sediment provenance. In Core WT-C1, for example, both Cu and Zn concentrations increase from the bottom of the core toward the surface (from sam-ples 16 to 7). The concentrations then abruptly decrease by a factor of 5 before remaining relatively constant until reach-ing the ground surface. The change in concentration is coin-cident with the observed increase in sedimentation rates (dis-cussed early), and a change in sediment sources documented by the mixing model. More specifically, Zn and Cu con-centrations tend to increase as contributions from vegetable fields increase, and decrease as contributions from pastures and cane fields increase (compare Figs. 8 and 11). The influ-ence of sediment provenance on Cu and Zn concentrations within the cores is illustrated more directly in Fig. 12. With the exception of three outliers (discussed below), there is a weak tendency for Zn and Cu concentrations to increase as the modeled contribution of sediment from vegetable fields increases. In contrast, inverse relations exist for cane and pas-ture. The dramatic decrease in concentration above sample 7 in Core WT-C1 can therefore be explained by (1) increasing contributions of sediment from pasture and cane fields, and (2) higher rates of sand-sized particle sedimentation which presumable exacerbated the effects of dilution on Cu and Zn concentrations.
[image:16.595.329.528.66.295.2]In contrast to Core WT-C1, contributions of sediment from vegetable fields in Core WT-C2 increase toward the surface (decreasing age) above sample 12 (Fig. 11). As expected from the paragraph above, concentrations of Cu and Zn in-crease as the contributions of sediment from vegetable fields
Fig. 10. Mean concentrations of Cu and Zn calculated for (a) up-land soil and (b) up-land use. Dashed lines represent global average Cu (blue) and Zn (orange) concentrations within soil reported by Buonicore (1996).
increase. It is also notable that the lowest Cu and Zn con-centrations are associated with sample 12 which the source model suggests contains the most sediment from the cane fields.
The indirect relationship between Cu and Zn concentra-tions and the relative contribution of sediment from pas-tures is understandable given the limited use of fertilizer on pastures. However, the indirect relationship between Cu–Zn concentrations and sediment from cane fields is surprising given the relatively high mean concentrations of the two el-ements in cane field samples (Fig. 10b). This inverse rela-tionship may be related the use of fertilizers on maize fields which were later converted into cane. This hypothesis is supported by (1) highly variable Cu and Zn concentrations within samples collected from the cane fields, and (2) Cu and Zn concentrations in a few samples that exceed those typi-cally found in soil and bedrock (Fig. 10). The hypothesized influx of sediment to the wetland from previously fertilized cane fields with high Cu and Zn concentrations would also explain the outliers on Fig. 12 (high Cu and Zn with no sig-nificant input of sediment from vegetable fields, and high Cu and Zn with high input from cane fields and pastures).
Fig. 11. Variations in Cu and Zn concentrations with depth in wetland Cores WT-C1 (a), WT-C2 (b), R1C1 (c), and B2WTC1 (d).
time why such large differences exist, when they do not for the other soil types. It is possible, however, that the sandy nature of Longlands soils, combined with their occurrence on relatively steep slopes, allowed the more mobile Zn to be leached from the sampled surface sediments.
Figure 11 shows that Cu and Zn concentrations are rel-atively low from the bottom of Core R1-C1 (sample 21 to sample 9). Concentrations of both elements above sample 9 are generally 3 to 5 fold higher. The change in concentrations is roughly coincident with the modeled change in sediment provenance that was attributed earlier to the construction of a drainage ditch through an upstream wetland. In other words, higher Cu and Zn concentrations appear to result from an in-crease in system connectivity and the capacity for sediment derived from headwater vegetable fields and other sediment sources to be transported downstream through the wetlands and to the reservoir.
Interestingly, Cores WT-C2 and B2WTC1 exhibit similar depth trends in Cu and Zn concentrations to that observed for approximately the top third of R1-C1 (Fig. 11b–d). Con-centrations are high at the surface and then systematically decrease with depth before increasing further down the core. The primary difference is that the abrupt decrease in Cu and Zn concentrations (and their subsequent uniform distribu-tion) observed at depth within Core R1-C1 is not present in the other two cores. The zone of relatively low Cu and Zn concentrations corresponds sedimentologically to layers containing significant amounts of sand-sized sediment which the source modeling indicates was derived in part from cane fields. The Cu- and Zn-enriched horizons are finer grained and derived predominantly from vegetable plots in Cores
WT-C2 and R1-C1 (as noted earlier, source modeling was not performed on Core B2WTC1 because it was located well downstream of the sampled upland sediment sources). The similarities in depth trends in concentration suggest that all three locations, spanning the entire study catchment, received sediment with similar Cu and Zn concentrations since about 1990. Because these two elements are primarily associated with soil amendments used on vegetable fields concentrated in headwater areas, the observed similarities in elemental concentrations as a function of depth within cores from the upper subcatchment wetland, the middle subcatchment reser-voir, and the lower subcatchment riparian wetland suggest that sediment was transported through the drainage system during runoff events. Thus, some degree of geomorphic con-nectivity must have existed. It therefore appears that follow-ing the construction of the upstream drainage ditch through the upstream wetland, the axial drainage network was geo-morphically and hydrologically connected.
4.4 Sediment sources, runoff magnitudes, and basin connectivity
0 0.2 0.4 0.6 0.8 1 1.2
0 200 400 600 800 1000 1200 1400
% S e d im e n t fr o m C a n e & P a s tu re
Zn Concentration (ppm) 0 0.2 0.4 0.6 0.8 1 1.2
0.0 100.0 200.0 300.0 400.0 500.0
% S e d im e n t fro m C a n e & P a s tu re s
Cu Concentration (ppm)
0 0.2 0.4 0.6 0.8 1 1.2
0.0 100.0 200.0 300.0 400.0 500.0
% S e d im e n t fr o m V e g e ta b le F ie ld s
Cu Concentration (ppm)
0 0.2 0.4 0.6 0.8 1 1.2
0 200 400 600 800 1000 1200 1400
% S e d im e n t fro m V e g e ta b le F ie ld s
Zn Concentration (ppm) Outliers
Outliers
Outliers
[image:18.595.50.289.62.485.2]Outliers
Fig. 12. Relationship between Cu and Zn concentrations and per-cent relative contribution from vegetable and pasture plus cane fields.
sandier soils with higher infiltration capacities was limited (Fig. 13). In other words, the lack of sandier sediments from cane fields on hillslopes within the wetland deposits suggests that the hillslopes were not significantly eroded during rel-atively low-magnitude events. Alternrel-atively, what sediment was eroded was redeposited on the hillslopes as a result of the utilized management practices.
Very little of the fine-grained sediment from low-lying vegetable fields was deposited and stored with the first down-stream reservoir of the middle subcatchment. The general lack of fine-sediment within the reservoir is presumably related to (1) the hydrologically and geomorphologically dis-connected nature of the drainage network during low-flow conditions (prior to valley floor modification), and (2) the
minimal impact of the dams on the storage of silt- and clay-sized particles during larger events when the system is hy-drologically connected. The lack of influence of the dams on sediment storage is not surprising given that water overflows the dams during periods of high surface runoff, creating a rapidly flowing system through the reservoir, and the increase in sediment transport capacity of the middle subcatchment (as described below).
Sandier sediments within both the wetland and the reser-voir were derived largely from hillslope cane fields. Presum-ably, these sediments were not only eroded from the val-ley bottom sediment sources, but from sandier hillslope soils covered largely by sugar cane during larger storm events that produced significant runoff. What is important to recognize is that the provenance of the sediment within the examined depositional environments varied as a function of both sedi-ment size and runoff magnitude. Moreover, given the chem-ically reactive nature of fine-particles, and the association of nutrients, particularly phosphate, with sediment, reductions in sediment-associated nutrient loads may best be sought through practices that address the erosion of sediment from agricultural fields along the valley floor.
The above provenance studies, combined with data from the geomorphic investigations, show that the Mkabela Basin, and presumably other similar catchments within the KwaZula–Natal Midlands, can be subdivided into three ge-omorphologically distinct subcatchments. These subcatch-ments vary in relief, the nature of their drainage network (or process zones) and their ability to store and transport sediment. As a result, sediment transport and storage do not systematically vary along the axial drainage system, but are characterized by spatially abrupt changes in their nature and magnitudes. In headwater areas with intact valley floors, sediment eroded predominantly from low-lying areas during low-magnitude events are largely deposited within wetlands that comprise large segments of the valley floor. The gen-eral lack of fine sediment within the reservoir, prior to valley modification, suggests that while the axial drainage network may be integrated during large floods, during low to moder-ate events the upper catchment areas were disconnected from downstream sections of the catchment (Fig. 14). Thus, the wetlands (in their natural state) serve as reservoirs of sedi-ment (and associated nutrients).
Upper Subcatchment (Sediment Production & Delivery, Storage in Wetlands
Middle SubCatchment (Transport Zone, Sand Storage in Reservoirs)
Lower Subcatchment (Sediment Deposition & Storage – Riparian Wetlands)
Previous
Wetland WetlandModern
Hillslope (Cane Fields)
Reservoir (Limited Fine-Sediment Storage) Drainage Ditch
(Altered Connectivity, Let to Input of Pasture
Soils by Bank Erosion)
Steep Alluvial & Bedrock Channels
Valley Bottom (Vegetable Fields)
Downstream/Downvalley
Ru
no
ff
/D
is
ch
ar
ge
S
ed
im
en
t
S
iz
e
S
ed
im
en
t
S
to
ra
[image:19.595.131.467.65.301.2]ge
Fig. 13. Schematic diagram of the primary processes occurring in each of the three delineated subcatchments, and the variations in sediment size and source from varying runoff magnitudes.
Distance Downstream
Relat
ive
Percen
t
Sto
rage o
r Co
nn
ectivi
ty
Geomorphic Connectivity
Sediment Storage
Upper-Catchment
Mid-Catchment
Lower-Catchment
Wetlands
Alluvial & Bedrock Channels
Alluvial Channel & Riparian Wetlands
Sediment Export
Fig. 14. Schematic diagram illustrating differences in geomorphic connectivity and sediment storage between subcatchment zones of the Mkabela Basin.
The lower subcatchment is dominated by low gradient, al-luvial channels boarded by extensive riparian wetlands. Stor-age of sediment within this zone is extensive, as illustrated by Core B2WTC1, once again limiting the downstream transla-tion of sediment and nutrients that they may carry (Fig. 14). The natural division of the catchment into geomorphologi-cally distinct sections suggests that previously developed wa-tershed modeling routines that are used to predict sediment exports from a basin may need to be modified before being applied to these catchments adequately to address the abrupt changes in sediment transport processes that occur.
5 Conclusions
The source, transport, and storage of sediment was evaluated within the Mkabela Catchment using a combination of geo-morphic, hydrologic, and geochemical tracing analyses. The integrated approach resulted in the following conclusions.
[image:19.595.153.441.355.526.2]