Hydrol. Earth Syst. Sci., 17, 1177–1188, 2013 www.hydrol-earth-syst-sci.net/17/1177/2013/ doi:10.5194/hess-17-1177-2013
© Author(s) 2013. CC Attribution 3.0 License.
EGU Journal Logos (RGB)
Advances in
Geosciences
Open Access
Natural Hazards
and Earth System
Sciences
Open AccessAnnales
Geophysicae
Open AccessNonlinear Processes
in Geophysics
Open AccessAtmospheric
Chemistry
and Physics
Open AccessAtmospheric
Chemistry
and Physics
Open Access DiscussionsAtmospheric
Measurement
Techniques
Open AccessAtmospheric
Measurement
Techniques
Open Access DiscussionsBiogeosciences
Open Access Open Access
Biogeosciences
DiscussionsClimate
of the Past
Open Access Open Access
Climate
of the Past
Discussions
Earth System
Dynamics
Open Access Open Access
Earth System
Dynamics
DiscussionsGeoscientific
Instrumentation
Methods and
Data Systems
Open Access
Geoscientific
Instrumentation
Methods and
Data Systems
Open Access DiscussionsGeoscientific
Model Development
Open Access Open Access
Geoscientific
Model Development
DiscussionsHydrology and
Earth System
Sciences
Open AccessHydrology and
Earth System
Sciences
Open Access DiscussionsOcean Science
Open Access Open Access
Ocean Science
DiscussionsSolid Earth
Open Access Open Access
Solid Earth
DiscussionsThe Cryosphere
Open Access Open Access
The Cryosphere
Discussions
Natural Hazards
and Earth System
Sciences
Open Access
Discussions
Spatial variability and its scale dependency of observed and
modeled soil moisture over different climate regions
B. Li1,2and M. Rodell2
1Earth System Science Interdisciplinary Center, University of Maryland, College Park, Maryland 20740, USA 2Hydrological Sciences Laboratory, NASA Goddard Space Flight Center, Greenbelt, Maryland 20771, USA Correspondence to: B. Li ([email protected])
Received: 17 August 2012 – Published in Hydrol. Earth Syst. Sci. Discuss.: 7 September 2012 Revised: 28 January 2013 – Accepted: 2 March 2013 – Published: 19 March 2013
Abstract. Past studies on soil moisture spatial variability have been mainly conducted at catchment scales where soil moisture is often sampled over a short time period; as a re-sult, the observed soil moisture often exhibited smaller dy-namic ranges, which prevented the complete revelation of soil moisture spatial variability as a function of mean soil moisture. In this study, spatial statistics (mean, spatial vari-ability and skewness) of in situ soil moisture, modeled and satellite-retrieved soil moisture obtained in a warm season (198 days) were examined over three large climate regions in the US. The study found that spatial moments of in situ mea-surements strongly depend on climates, with distinct mean, spatial variability and skewness observed in each climate zone. In addition, an upward convex shape, which was re-vealed in several smaller scale studies, was observed for the relationship between spatial variability of in situ soil mois-ture and its spatial mean when statistics from dry, interme-diate, and wet climates were combined. This upward convex shape was vaguely or partially observable in modeled and satellite-retrieved soil moisture estimates due to their smaller dynamic ranges. Despite different environmental controls on large-scale soil moisture spatial variability, the correlation between spatial variability and mean soil moisture remained similar to that observed at small scales, which is attributed to the boundedness of soil moisture. From the smaller sup-port (effective area or volume represented by a measurement or estimate) to larger ones, soil moisture spatial variability decreased in each climate region. The scale dependency of spatial variability all followed the power law, but data with large supports showed stronger scale dependency than those with smaller supports. The scale dependency of soil moisture variability also varied with climates, which may be linked to
the scale dependency of precipitation spatial variability. In-fluences of environmental controls on soil moisture spatial variability at large scales are discussed. The results of this study should be useful for diagnosing large scale soil mois-ture estimates and for improving the estimation of land sur-face processes.
1 Introduction
Spatial variability of soil moisture plays an important role in the estimation of land surface fluxes (evapo-transpiration (ET) and runoff), due to the non-linear relationship between soil moisture and the associated physical processes. Char-acterizing soil moisture spatial variability is also important for validating satellite-derived soil moisture, as the number of soil samples needed to accurately represent the spatial mean within the footprint of satellites depends on soil mois-ture spatial variability (Brocca et al., 2012; Famiglietti et al., 2008; Wang et al., 2008). In addition, since the footprint of satellite-derived soil moisture is often larger than the res-olution of many hydrological applications, downscaling re-trieved soil moisture is often necessary, which can be helped with knowledge of soil moisture spatial variability and its scale dependency.
Famiglietti, 2005; Famiglietti et al., 1999, 2008): some stud-ies have indicated that spatial variability increased as mean soil moisture became wetter while others have indicated just the opposite. Several hypotheses have been explored as to how the two opposite correlations could co-exist (Crow and Wood, 1999; Rodriguez-Iturbe et al., 1995). Famiglietti et al. (2008), Brocca et al. (2012) and Rosenbaum et al. (2012) showed an upward convex (or concave) relationship that con-sists of both negative and positive correlations. A noticeable shortcoming of past studies is that they are based on data col-lected in a short time period and/or in specific climate regions (most with intermediate precipitation), which limited the dy-namic range of soil moisture and prevented the full revelation of this relationship.
The theoretical foundation for scaling spatial variability is the power law, which states that the spatial variability at one scale is related to that at another scale by the power of a scaling factor (Crow and Wood, 2002; Hu et al., 1998). Studies using spatial aggregations have shown that the rela-tionship between soil moisture variability and its spatial res-olution generally follows the power law (Crow and Wood, 2002; Hu et al., 1998; Parada and Liang, 2003). Famiglietti et al. (2008) and Brocca et al. (2012) examined another aspect of the power law using field measurements, that is, the rela-tionship between spatial variability and the extent (the max-imum spatial range of measurements) and showed that the variability of soil moisture increased as the extent (<50 km) increased. There is no knowledge about the scale dependency of spatial variability at even larger extents, which can be im-portant for understanding the scale dependency of large-scale land surface processes that interact with soil moisture.
In addition to in situ measurements, models provide spa-tially and temporally continuous soil moisture estimates with global coverage. Model estimates are derived based on large-scale representations of static parameters and meteorological forcing fields and inevitably impacted by imperfect model physics and parameters. Satellite-derived soil moisture es-timates also provide global coverage but are influenced by errors in retrieval procedures and limitations of the sensor (Jackson, 1993; Njoku et al., 2003), in addition to their larger spatial representations. Studying the spatial variability of these two data sources along with in situ data should pro-vide additional insights into the nature of soil moisture spa-tial variability and its scale dependency, as well as useful in-formation for improving model estimated soil moisture.
The objective of this study is to examine the spatial vari-ability of in situ, modeled and remotely sensed soil moisture at large extents (>100 km) over different climate regions and their scale dependency. The three types of data are: in situ soil moisture measurements from the Soil Climate Analy-sis Network (SCAN, Schaefer et al., 2007), North Ameri-can Land Data Assimilation System (NLDAS) Noah model estimates, and Advanced Microwave Scanning Radiometer-EOS (AMSR-E) soil moisture retrievals. The SCAN net-work, which has stations across the US, provides diverse
climate conditions to study the impact of climate on the spa-tial variability of soil moisture in a more complete soil mois-ture range than examined in previous studies.
In the rest of the paper, the scale triplet, spacing (the dis-tance between two sampling locations), support (the effec-tive area or volume represented by each data type) and extent (maximum spatial distance covering all sampling points), as defined by Western and Bl¨osch (1999), is used to discuss the scale dependency of soil moisture spatial variability.
2 Data and study design
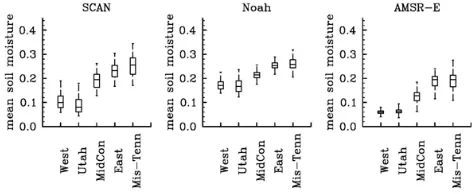
Figure 1 shows the location of the 109 SCAN sites used for this study. To study the relationship between soil mois-ture variability and climate, the continental US was split into three regions along the −104◦ and −96◦ longitude lines: West, Mid-continent (MidCon) and East, which roughly rep-resent dry (noting that no SCAN sites exist on West Coast), intermediate and wet conditions, respectively. In West and East, two sub-regions were further chosen to create a smaller extent for statistical analysis. The sub-region in West es-sentially encompasses the state of Utah (thereafter referred to as Utah) and the sub-region in East is located in the Mississippi/Tennessee/Alabama area (referred to as Miss-Tenn). No sub-region was selected for MidCon due to lack of densely located SCAN stations in the region. The number of SCAN locations in each region is given in Table 1. The extent is about 500 to 700 km for the sub-regions and about 2000 to 3000 km for the three large climate regions. Figure 1 also shows three series of concentric squares, with side lengths ranging from 110 to 1500 km, which were used to study the scale dependency of modeled and remotely sensed soil mois-ture in Sect. 4.4.
Most SCAN stations began measuring soil moisture in the early 1990s, while new stations such as those in Utah were added in 2007. To include as many stations as possible, 2008 was chosen as the study year, which was further lited to 1 May–15 November (198 days) to eliminate the im-pact of freezing/thawing conditions on the analysis. SCAN soil moisture is recorded hourly at the 5, 10, 20, 50 and 100 cm depths using Hydro Probe, which converts soil di-electric permittivity to water content through calibrated equa-tions (Seyfried et al., 2005). As SCAN staequa-tions generally are located in agricultural areas, typical soil types are silt loam and fine sandy loam.
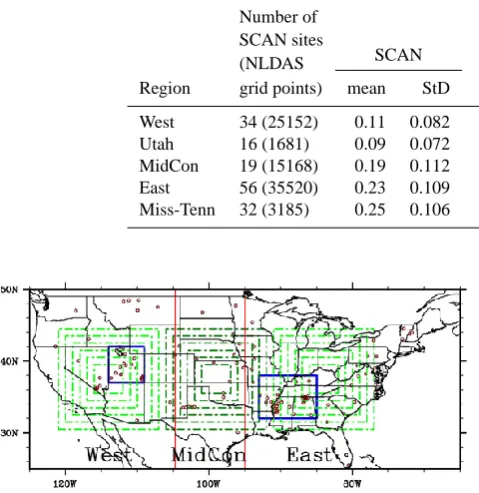
Table 1. The number of SCAN stations, temporally averaged (over 198 days) spatial mean and spatial variability (StD) of soil moisture (cm3cm−3)in each region. Statistics were calculated using data values at SCAN sites, except the numbers in parentheses, which were computed using all grid points in each region.
Number of SCAN sites
(NLDAS SCAN NLDAS AMSR-E
Region grid points) mean StD mean StD mean StD
West 34 (25152) 0.11 0.082 0.17 (0.18) 0.051 (0.069) 0.06 0.024 Utah 16 (1681) 0.09 0.072 0.17 (0.17) 0.042 (0.045) 0.06 0.020 MidCon 19 (15168) 0.19 0.112 0.21 (0.22) 0.074 (0.060) 0.12 0.050 East 56 (35520) 0.23 0.109 0.25 (0.24) 0.046 (0.050) 0.19 0.045 Miss-Tenn 32 (3185) 0.25 0.106 0.26 (0.25) 0.038 (0.037) 0.19 0.039
Fig. 1. SCAN site locations (in brown circles), climate regions (di-vided by red lines), sub-regions (in blue rectangles), and three series of concentric squares (in dark and light green) used in the scale-dependency study for Noah and AMSR-E soil moisture data.
situ measurements. NLDAS precipitation is based on daily measurements from over 10 000 gauges located in the US, which are then temporally disaggregated into hourly data us-ing hourly Doppler radar images (Cosgrove et al., 2003). As given in Table 2, NLDAS precipitation (for the study pe-riod) generally agrees with gauged data recorded at SCAN sites, especially in terms of capturing climate differences in each region. For NLDAS, total precipitation averaged over all grid points in each region is also provided in Ta-ble 2, which shows some differences from those averaged over SCAN locations only, due to the scattered nature of the SCAN network. The 1-km STATSGO soil texture used by NLDAS/Noah was also found (not shown) in good agree-ment with field soil descriptions at SCAN sites. Hourly Noah soil moisture estimates, which are integrated on a 0.125-degree grid were extracted from archived NLDAS/Noah out-puts (http://www.emc.ncep.noaa.gov/mmb/nldas/).
Advanced Microwave Scanning Radiometer for EOS (AMSR-E) soil moisture retrievals produced by the NOAA’s National Environmental Satellite, Data and Information Ser-vice (Zhan et al., 2008) were used in this study. This AMSR-E product, derived from the X-band frequency brightness temperature using the Single Channel Retrieval algorithm (Jackson, 1993), has larger dynamic ranges than the official
Table 2. Total SCAN and NLDAS precipitation (mm) for the study period (1 May–15 November).
NLDAS NLDAS
Region SCAN (at SCAN sites) (at all grid points)
West 181 173 222
Utah 134 142 132
MidCon 486 554 483
East 580 702 670
Miss-Tenn 596 673 661
AMSR-E product (Njoku et al., 2003) with more realistic mean values in wetter climates than the official product (not shown). The sensing depth of the AMSR instrument is be-lieved to be about 1–2 cm from the surface (Njoku et al., 2003). AMSR-E retrievals, with a 25 by 25 km spatial reso-lution and ca. 1–2 retrievals per day, have the largest support among the three data types.
3 Statistical moments
To analyze the three data sets, the first three statistical mo-ments were calculated for daily soil moisture values in each climate region and sub-region. All statistics were calculated using NCL (http://www.ncl.ucar.edu/overview.shtml) build-in functions and their mathematical formulations are pro-vided here. ForNsoil moisture values on daytin any given region, their spatial mean,M, is given by
Mt = 1 N
N X
i=1
θi,t, (1)
whereθi,t is the soil moisture at locationion dayt.
Following the same notation, the spatial variability of soil moisture is measured by the sample standard deviation,
σt= 1
N−1 N X
i=1
θi,t−Mt2 !1/2
[image:3.595.311.544.277.367.2]and the skewness, which measures the asymmetry of data distribution, is defined as
St=
N
P
i=1
θi,t−Mt3
/N
N
P
i=1
θi,t−Mt2
/N 3/2
. (3)
For two soil moisture time series at any given location (i), their temporal correlation is given by the Pearson correlation coefficient:
ri12= 1 Ntσi1σi2
Nt X
t=1
(θi,t1 −Yi1)(θi,t2 −Yi2), (4)
where superscripts 1 and 2 represent the two time series;Nt is the number of data points in the time series, which is 198 days for this study;Yiandσiare the temporal mean and stan-dard deviation at locationi, respectively.
4 Results
4.1 Mean, spatial variability and skewness
Daily soil moisture of SCAN, Noah and AMSR-E was first calculated at each SCAN location and then used to compute spatial statistics – mean, variability and skewness – in each region (climate and sub-region) for each data set. Because AMSR-E retrievals are surface observations only, the statisti-cal analysis was limited to the SCAN measurements at the 5-cm depth and the top layer of Noah estimates. All soil mois-ture values used for statistical calculations and presented in the graphs are in volumetric water content (cm3cm−3).
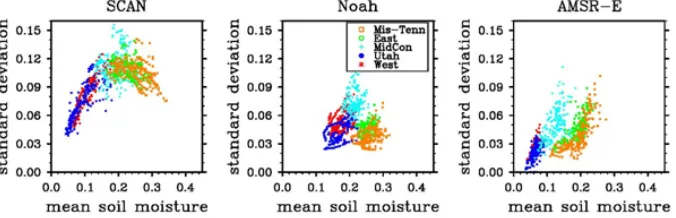
[image:4.595.309.546.63.160.2]Figure 2 is the box plot of the daily mean soil moisture for the three data types in each region. The lower, center and up-per limits of each box represent the 25th, 50th and 75th up- per-centiles of spatial means while the two whiskers represent the minimum and maximum value in each data set. All three data types show sensitivity to climate conditions with median soil moisture increasing from the West to the East. Observed soil moisture (SCAN and AMSR-E) is more sensitive to changes in climate conditions than Noah, whose median soil moisture increases less than the others as the climate becomes wetter. Noah and AMSR-E estimates have smaller dynamic ranges in all regions, as the boxes are generally smaller than those of SCAN. In West and Utah, Noah estimates show positive bias relative to SCAN, with the median value near 0.2. AMSR-E retrievals, on the other hand, generally exhibit a drier bias in each region. Temporally averaged (over the 198 days) daily mean values given in Table 1 further confirm these biases. Many factors could contribute to these discrep-ancies in spatial means. AMSR-E soil moisture data were affected by the shallow sensing depth (1–2 cm) and lack of retrievals during rainfall, which may have reduced their abil-ity to capture the seasonal variabilabil-ity seen in the SCAN and
Fig. 2. Box plot of daily mean soil moisture (cm3cm−3)in climate regions and sub-regions for the three data types. Statistics of Noah and AMSR-E were calculated using data at SCAN locations.
Noah soil moisture datasets. The reduced sensitivity of X-band brightness temperature to soil moisture in the growing season may also prevent accurate retrievals (Jackson, 1993). Similarly, Noah soil moisture is affected by inaccurate model parameters (including dynamic forcing fields) and deficien-cies in model physics. Both Noah and AMSR-E soil moisture are also averaged values over an area where the vegetation cover, soil texture and the atmospheric forcing may differ from those at the location of SCAN sites. Exploring the exact cause for such deviations is beyond the scope of this study; instead, the rest of this study focuses on how mean soil mois-ture, in particular, its magnitude relative to the mid-range soil moisture (defined as the arithmetic mean of the maximum and minimum soil moisture), affects the higher moments of soil moisture. The soil moisture range for AMSR-E is 0–0.5 and about 0–0.45 for SCAN data, based on the tested soil types (Seyfried et al., 2005). Noah soil moisture is limited by the wilting point and porosity, which are 0.07 and 0.44, respectively, based on the averaged values of all soil types appeared in the study area. Given the limited information on SCAN soil properties, the mid-range soil moisture is approx-imately at 0.2 for SCAN and 0.25 for Noah and AMSR-E.
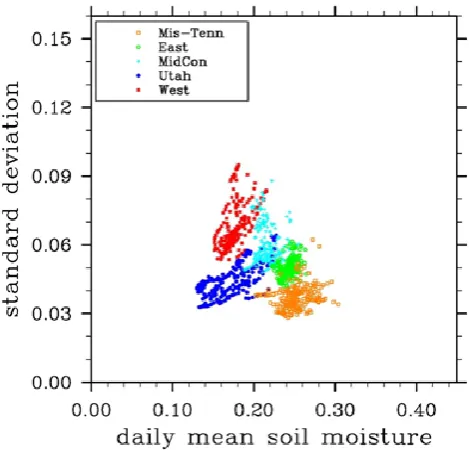
Fig. 3. Spatial variability (standard deviation) of soil moisture as a function of mean soil moisture (cm3cm−3)for the three data types. Statistics of Noah and AMSR-E were calculated using data at SCAN locations.
variability is the highest. This transitioning of correlation from the positive to negative around the mid-range soil mois-ture was also noted by Penn et al. (2009) and Rosenbaum et al. (2012). Rosenbaum et al. (2012) also showed a more sub-stantial decreasing trend in the wetter range of soil moisture, which is missing in East because mean soil moisture in the region did not reach the wetter end.
Spatial variability of Noah soil moisture shows positive correlation with mean soil moisture in West and Utah and no correlation in other regions. The lack of negative corre-lation in East/Miss-Tenn is associated with the fact that the spatial means of these two regions are very close to the mid-range soil moisture. As SCAN, Noah soil moisture exhibits the largest spatial variability in MidCon. The spatial vari-ability of AMSR-E soil moisture, on the other hand, shows positive correlation with mean soil moisture in all regions. This behavior is also linked to the fact that the median mean of AMSR-E retrievals is always near or below its mid-range soil moisture (0.25) in each region (Fig. 2). More discussions on the contributing factors to this upward convexity will be given in Sect. 4.3.
To illustrate the temporal variation of spatial variability, Fig. 4 shows the time series of spatial mean soil moisture, soil moisture spatial variability (StD) and mean precipitation in the three climate regions. SCAN soil moisture shows strong seasonality with larger dynamic ranges. Noah soil moisture exhibits similar seasonality but with smaller dynamic ranges and noticeable wetter conditions in the summer. Both of them also show strong correlation with daily precipitation. No sim-ilar seasonality is observed in AMSR-E soil moisture, which may be attributed to its shallow sensing depth and reduced sensitivity of brightness temperatures to moisture content in the growing season when vegetation water content is high (Jackson, 1993).
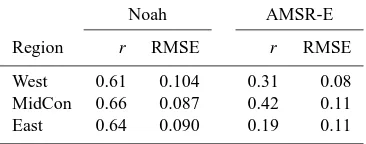
[image:5.595.310.547.228.404.2]Temporal correlations and root mean square errors (RMSE) of the Noah and AMSR-E estimates with respect to SCAN soil moisture at each SCAN site were also calculated and their region-averaged values are given in Table 3. Noah shows better correlation and lower RMSE than AMSR-E in all regions, except in West where AMSR-E has lower RMSE. As can be seen from Fig. 4, the low correlation of AMSR-E
Fig. 4. Time series of daily (averaged over values at SCAN loca-tions) precipitation (mm), spatial mean soil moisture (cm3cm−3) and soil moisture standard deviation (StD) in climate regions. Statis-tics of Noah and AMSR-E were calculated using data at SCAN lo-cations.
with SCAN measurements mainly stems from its lack of sea-sonality and no correlation with daily precipitation. As dis-cussed earlier, many factors contributed to the difference be-tween AMSR-E/Noah and SCAN soil moisture including the scattered nature of SCAN sites in each region. Thus, these statistics are provided for quantifying the difference between the two data sets and for the purpose of discussing their im-pacts on spatial variability and are not presented as evalua-tions of Noah and AMSR-E soil moisture.
Fig. 5. Soil moisture skewness as a function of spatial mean soil moisture (cm3cm−3)for the three data types. Statistics of Noah and AMSR-E were calculated using data at SCAN locations.
Table 3. Temporal correlations (r) and root mean square errors (RMSE) of Noah/AMSR-E soil moisture with respect to SCAN measurements. Statistics were first calculated at each SCAN site and then averaged over all SCAN locations in each region.
Noah AMSR-E
Region r RMSE r RMSE
West 0.61 0.104 0.31 0.08
MidCon 0.66 0.087 0.42 0.11
East 0.64 0.090 0.19 0.11
to East. This is due to the fact that soil moisture in MidCon and East fluctuates around its mid-range soil moisture and therefore any increasing or decreasing trend of spatial vari-ability is frequently reversed. Similar behaviors are seen with Noah estimates, but not with AMSR-E retrievals. These re-sults demonstrate that soil moisture spatial variability is sen-sitive to mean soil moisture, especially its relative magnitude with respect to the mid-range soil moisture, and its temporal variability.
Skewness measures the asymmetry of a probability dis-tribution and is important for ensemble-related data assim-ilation techniques, which often assume normality. Figure 5 shows the skewness of daily soil moisture for the three data types. SCAN exhibits climate dependent skewness: soil moisture is positively skewed in West and Utah, nega-tively skewed in East and Miss-Tenn, and centered at zero-skewness in MidCon. These behaviors can be explained us-ing the boundedness of soil moisture. For example, in the dry climate where median soil moisture value is smaller than the mid-range soil moisture, the left tail (representing values be-low the median) of soil moisture distributions is suppressed by the zero bound, which leads to positive skewness.
Noah estimates exhibit a somewhat similar behavior in skewness across different climate zones. Because their mean values do not reach very dry and wet ends of the full soil moisture range, soil moisture in West and East is only slightly skewed. There are some strayed data points in Utah that have negative skewness, even though the means are less than its
mid-range soil moisture. This is associated with the relative uniform soil moisture conditions in June that made the statis-tics less representative. AMSR-E soil moisture, on the other hand, shows all positive skewness in each region, which is caused by its drier than its mid-range spatial means in all re-gions.
4.2 Impact of sampling density on spatial mean and spatial variability
Due to the limitation of the SCAN network, the above statis-tical analyses were based on scattered data points that may not represent the true averaged behavior of soil moisture in each region. To evaluate the impact of sampling sizes (num-ber of sampling points within each region), daily mean and spatial variability of Noah soil moisture were calculated us-ing all grid points (between 25◦N and 49◦N for all three re-gions and the east of 121◦W for West to exclude the coastal area) and compared with those using data at SCAN locations only. The scatter plot of Fig. 6 (left panel) shows that daily means calculated using the two sampling schemes are nearly unbiased in each region. This is further confirmed by their temporally averaged mean values in Table 1. This result sug-gests that the true spatial mean of Noah soil moisture in each region is sufficiently sampled by data (i.e., Noah soil mois-ture) at SCAN locations alone.
Fig. 6. Scatter plot of Noah daily mean soil moisture (cm3cm−3, left panel) and standard deviation (right panel) calculated at SCAN locations versus those over all grid points in each region.
estimates as sampled at SCAN locations is representative of Noah’s true soil moisture spatial variability. The significant increase of spatial variability in West is likely associated with the increase in total precipitation (see Table 2) when all grid points were sampled. Increasing precipitation increased the wetness of soil moisture, which led to increased spatial vari-ability because of the positive correlation between spatial variability and mean soil moisture in West. In MidCon, mean soil moisture slightly increased even though precipitation de-creased with inde-creased sampling, indicating that SCAN lo-cations missed some low precipitation spots. This preferen-tial sampling of the SCAN network may be the reason why spatial variability decreased with increased sampling in Mid-Con.
Because the support of SCAN soil moisture is smaller than that of Noah estimates, this test does not necessarily imply that the mean and spatial variability at the point scale are accurately captured by SCAN soil moisture. However, given the good correlations between SCAN and Noah soil moisture (Table 3) and the agreement between NLDAS and SCAN precipitation (Table 2), this test provides some confidence that statistics based on SCAN data are representative of the climate condition in each region.
4.3 Factors contributing to soil moisture spatial variability
[image:7.595.50.287.63.171.2]Previous studies have linked factors such as atmospheric forcing, ET, soil texture, topographical features and vege-tation types (see review by Rosenbaum et al., 2012) to soil moisture spatial variability and its relationship with mean soil moisture. For the scale of this study, physical processes such as precipitation and ET (which includes the effect of vegetation and radiation) are the major contributors to soil moisture spatial variability. Topography, which mainly af-fects soil moisture distribution at hillslope scales, does not play a significant role because SCAN sites are separated by much longer distances. Soil texture, which affects soil moisture through root zone uptake and drainage, also plays a lesser role than atmospheric forcing at large scales. For
Fig. 7. Standard deviation of Noah soil moisture as a function of daily mean soil moisture (cm3cm−3). Statistics were calculated us-ing all gridded data in each region.
instance, drainage occurring at a northwestern US location may differ from that at a southwestern US location due to soil texture, but the spatial variability of precipitation and ET at these two locations plays an even stronger role in their dif-ferences. Note that even though soil types observed at SCAN sites are limited (mainly silt loam and fine sandy loam), it does not mean that the spatial variability of soil moisture is significantly under-represented by SCAN data because their spatial distribution can capture a significant degree of vari-ability in precipitation.
Figure 8 shows that precipitation spatial variability always positively correlates with mean precipitation, regardless of climate conditions. But the effect of precipitation on soil moisture spatial variability depends on soil water capacity in each climate. In dry climates where soils have large water capacity, soil moisture is responsive to changes in precipita-tion (see Fig. 4), i.e., a larger increase in precipitaprecipita-tion leads to a larger increase in soil moisture. This strong correlation means that increased precipitation results in increased soil wetness which then leads to increased soil moisture spatial variability due to the positive correlation between precipita-tion variability and mean precipitaprecipita-tion. Thus, precipitaprecipita-tion alone can be responsible for the positive correlation between soil moisture spatial variability and mean soil moisture in the West and Utah. In addition, ET is constrained by moisture availability in a dry climate and is positively correlated with precipitation (Xia et al., 2012), meaning it also contributes to the positive correlation in the same way as precipitation.
Fig. 8. Spatial variability (standard deviation) of daily precipitation (mm) as a function of mean precipitation. Daily precipitation of NLDAS and SCAN were first calculated at each SCAN location and then used to calculate spatial mean and standard deviation in each region.
available soil water capacity. With increased precipitation, more runoff is generated and so not all precipitation spatial variability is transferred to soil moisture. Impacts of ET on soil moisture also decrease because ET is now limited by en-ergy availability. Rosenbaum et al. (2012) used the reduced impact from ET to explain the negative correlation between spatial variability and mean soil moisture. As soil becomes even wetter, soil moisture approaches its upper limit, satura-tion, where a minimum spatial variability should be reached because a bounded distribution normally exhibits minimum variances at the boundaries (Western et al., 2003). In the case of soil moisture, spatial variability at its two bounds should equal the spatial variability of wilting point and porosity (Western et al., 2003; Famiglietti et al., 2008). Indeed, spa-tial variability of Noah soil moisture is larger than the spaspa-tial variability of wilting points (not shown) used in the model in the drier range of soil moisture and larger than the spatial variability of porosity in the wetter range.
From a physical point of view, boundedness causes related physical processes to lose their interactions with soil mois-ture at the wilting point and saturation; as a result, the maxi-mum spatial variability should occur around the mid-range soil moisture where boundedness has the weakest impact. Consequently, the positive and negative correlation should co-exist if spatial means extend to both the drier and wetter side of the soil moisture range as seen in SCAN soil mois-ture. However, the degree of correlation and the peak value in the upward convexity, which reflect the strength of the inter-action between physical processes and soil moisture, should depend on the processes involved and their relative strength. 4.4 Scale dependency of spatial variability
To explore the scale dependency of soil moisture spatial vari-ability and its relationship with climate, a range of extents shown in Fig. 1 (dark and light green concentric squares) were used to calculate the spatial variability of Noah and AMSR-E soil moisture. Since SCAN soil moisture only has one extent in MidCon, spatial variability of soil mois-ture by Famiglietti et al. (2008) at the 2.5 m, 16 m, 100 m, 800 m, 1600 m and 50 000 m extents (values taken from their
Fig. 11) were combined with SCAN spatial variability in MidCon. Most their measurements were obtained from the Great Plains, which has the similar climate condition as Mid-Con. To obtain a unique spatial variability value for each ex-tent, the daily spatial variability of SCAN, Noah and AMSR-E were averaged over the 198 days and plotted against ex-tents in Fig. 9.
Log-transformation was used in Fig. 9 because, based on the self-similarity theory, the spatial variability is related to scales in an exponential function (the so-called power law), which can be linearized through log-transformation (Hu et al., 1998) as
log(σλ)=Hlog(λ)+C, (5)
whereλ represents the scale (in this case the extent);σλ is the spatial variability (standard deviation) at scaleλ;C is a constant;H is a scaling factor indicating the degree of de-pendency of spatial variability on scales. Following this rela-tionship, linear relations were fitted for each data type (black lines in Fig. 9) and the slopes (H) are given in Table 4.
The spatial variability of soil moisture increases as extents increase, with the increasing rate depending on data types and climate regions as shown in Table 4. From the small-est support (SCAN) to the largsmall-est (AMSR-E), the slope in-creases, meaning spatial variability increases faster as extents increase. This phenomenon can be explained by the dimin-ished influence of supports on spatial variability with increas-ing extent. Specifically, the difference in supports will be-come negligible at large extents where spatial variability has reached such a high level that finer scale spatial variability becomes negligible. Because data sets with larger supports begin with lower spatial variability at smaller extents, their spatial variability has to increase at a faster rate to reach the same level of large scale spatial variability.
Fig. 9. Log-(standard deviation of soil moisture) as a function of log-(extent) in climate regions. Standard deviations of SCAN, Noah and AMSR-E soil moisture were obtained by temporally averaging daily values in each region over the 198 days.
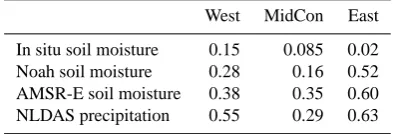
Table 4. Slopes of linear relationship between log-(spatial variabil-ity of soil moisture and precipitation) and log-(extent) in each cli-mate region. NLDAS precipitation (mm) was calculated using val-ues at SCAN locations only.
West MidCon East
In situ soil moisture 0.15 0.085 0.02 Noah soil moisture 0.28 0.16 0.52 AMSR-E soil moisture 0.38 0.35 0.60 NLDAS precipitation 0.55 0.29 0.63
However, the increased spatial variability with decreasing supports is true even when all statistics were calculated in the same region as shown in Table 1. In either case, the reduced spatial variability in AMSR-E and Noah (compared to that in SCAN) is mainly caused by reduced occurrences of extreme soil moisture values due to the use of spatially and tempo-rally averaged forcing and parameter fields for Noah, and the large footprint of the sensor and maximum of two retrievals per day for AMSR-E. The spatial variability of AMSR-E be-comes closer to that of Noah as the climate condition changes from dry to wet. This may indicate increased spatial correla-tion in wetter soil condicorrela-tions which smoothes out the differ-ence in spatial variability at the support of Noah and AMSR-E. In theory, a linear relationship could also be fit for the log-(spatial variability) versus log-support which was not at-tempted due to an insufficient number of SCAN sites within each concentric square.
From the dry to wet climate, AMSR-E retrievals and Noah estimates exhibit the weakest scale dependency in MidCon and the strongest scale dependency in the East. To identify the source of such climate dependency for Noah soil mois-ture, the slope of NLDAS precipitation scale dependency is also provided in Table 4. The spatial variability of NLDAS precipitation exhibits climate dependency that is similar to that of Noah soil moisture, confirming the strong influence of precipitation on soil moisture and its spatial variability as dis-cussed in Sect. 4.3. One explanation for the weaker scale de-pendency of precipitation in MidCon is that the climate does not change as much as in West and East when the extent scale
increases. For instance, with increasing extents in the West, precipitation differences between the wetter North and drier South become even larger, which leads to a larger (compared to that in MidCon) increase in precipitation spatial variabil-ity.
Figure 9 shows that data obtained from Famiglietti et al. (2008) and the SCAN data in MidCon can be fit by a linear function, suggesting that a single scaling relationship can potentially be used to scale spatial variability from very small scales to much larger scales. Brocca et al. (2012) re-ported a slope of 0.16, using data collected in a similar cli-mate condition as MidCon. Note that soil moisture data from Famiglietti et al. (2008) represent the top 6 cm of soil and were gathered from field campaigns conducted in different years (1997, 1999, 2002 and 2003), while SCAN soil mois-ture was measured hourly at 5 cm in 2008. Using temporally averaged spatial variability values mitigated some of the im-pacts associated with sampling frequency and sampling pe-riods since the dynamic range of spatial variability in June and July (sampling periods of Famiglietti et al., 2008) is very close to that of the entire period (Fig. 4). There was also no report of shallow groundwater, which can impact the vertical distribution of soil moisture (Rosenbaum et al., 2012), at the Famiglietti et al. (2008) and SCAN sites and so the behavior of soil moisture spatial variability at 5 cm is expected to be similar to that of the top 6 cm of soil. This apparent linear relationship should be further tested when more in situ soil moisture data become available.
5 Summary and discussions
[image:9.595.68.265.281.348.2]contrasting climate zones where both the drier and wetter (compared to the mid-range soil moisture) ranges of mean soil moisture were reached. When mean soil moisture ex-tends to both the drier and wetter ends of soil moisture, the upward convex shape results because minimum variability always occurs at the bounds for a bounded variable like soil moisture. Physical processes also influence soil moisture spa-tial variability and its relationship with mean soil moisture, with the maximum impacts occurring around the mid-range soil moisture where the effect of boundedness is the weakest. Due to the limited number of SCAN sites in each region, the true mean and spatial variability may differ from that ob-tained from SCAN data. However, spatial means of SCAN soil moisture are consistent with the climate condition for each region, i.e., driest in West and wettest in East. In con-junction with the effect of boundedness, the upward convex-ity can still be expected when high spatial densconvex-ity data sets become available; but the degree of correlation in West/East and the maximum correlation in MidCon may change. Note that the correlation between spatial variability and mean soil moisture needs to be discussed with respect to the extent of measurements because the dynamic range of mean soil mois-ture may change with extents. For instance, the upward con-vexity can be observed from data collected in a sub-humid or humid region alone (e.g., Famiglietti et al., 2008; Rosenbaum et al., 2012) if spatial means reach to both the drier and wetter range of soil moisture.
Noah modeled soil moisture exhibited much smaller spa-tial variability than in situ soil moisture due to its larger sup-port where temporally and spatially averaged forcing and parameter fields were used to derive the estimates. In ad-dition, the upward convex relationship is barely discernible and skewness is nearly non-existent because their spatial means are close to the mid-range soil moisture in all re-gions. AMSR-E soil moisture retrievals, having the largest support, exhibited the smallest spatial variability among all three data types. The spatial variability of the retrievals showed only positive correlation with mean soil moisture, and skewness was also only positive. Despite differences in spatial means due to various reasons, the higher moments of AMSR-E and Noah showed dependencies on mean soil moisture that were similar to those of SCAN: positive corre-lation/skewness when most of their mean values (represented by the 25–75 percentiles in Fig. 2) were less than the mid-range soil moisture of each data set, negative when most spa-tial means were greater than the mid-range soil moisture and no correlation when means are around or near the mid-range soil moisture. This dependency on mean soil moisture sug-gests that obtaining appropriate mean soil moisture at any given time (the box plot in Fig. 2 is a collection of all spatial means in 198 days) is critical for accurately modeling soil moisture spatial variability. Penn et al. (2009) showed that soil moisture spatial variability could be modeled correctly even without explicitly representing the topography, a ma-jor contributor to the spatial variability in their study site,
if spatial mean soil moisture was appropriately simulated. One explanation for that result is that the boundedness of soil moisture largely dictates the dependency of spatial variabil-ity on mean soil moisture. Even though AMSR-E retrievals are generally less well validated by SCAN data, they exhib-ited smaller RMSE (assuming SCAN statistics are represen-tative) than Noah soil moisture in West (Table 3) and may be used to improve the spatial mean of model estimates through data assimilation (Li et al., 2012). Data assimilation also pro-vides a way to downscale retrievals in which high spatial and temporal resolution model estimates are dynamically merged with the retrievals.
Although observed and simulated soil moisture exhibited scalability as governed by the power law, their scale depen-dency differs: data with large supports showed stronger scale dependency than those with finer supports. The scale depen-dency also varies by climate regions: scale dependepen-dency of Noah and AMSR-E soil moisture was strongest in a wet cli-mate and weakest in the transitional zone, which may be a consequence of the scale dependency of precipitation for Noah soil moisture. This relationship between the scale de-pendency of soil moisture and that of other physical pro-cesses has been suggested by Western et al. (2003) but has not been demonstrated in previous studies. One of the major differences of this study is that soil moisture spatial variabil-ity was dominated by precipitation variabilvariabil-ity, which is dif-ficult to examine in small catchments where precipitation is relatively uniform and other controls (e.g., topography and soil texture) may have a stronger influence on soil mois-ture spatial variability. Fumois-ture studies should be conducted on how the dependency of soil moisture spatial variability influences that of other processes such as ET and precipita-tion which would be useful for better understanding the in-teraction between the land and atmosphere and for improving the prediction of land surface processes. Based on the results presented here, such studies should be conducted in regions with intermediate precipitation such as MidCon where mean soil moisture is around the mid-range and processes can have the largest impact on soil moisture. This region of strong connections was also noted by Dirmeyer et al. (2009), who showed sustained interactions between soil moisture and pre-cipitation in the Great Plains of the US through coupled land-atmosphere modeling. Scalability of spatial variability from continental to catchment scales can be useful for obtaining spatial variability at intermediate scales for which appropri-ate measurement networks do not exist. Due to the limita-tions of Famiglietti et al. (2008) and SCAN data such as their differences in sampling depth and sampling period, further studies are needed to examine the scalability of soil mois-ture spatial variability across a wide range of extents; in par-ticular, the impact of interannual variability of precipitation which is significant in MidCon on soil moisture spatial vari-ability should be investigated.
(anomalies) and time-invariant (mean) components. It is un-known if the spatial variability of soil moisture anomalies, which is a greater concern in some applications, exhibits sim-ilar climate dependency. Although Mittelbach and Senevi-ratne (2012) found that soil moisture anomalies only con-stituted a small percentage of soil moisture spatial variabil-ity, they also showed that the spatial variability in anomalies could differ from that in the full magnitude of soil moisture when precipitation changed. Information on the spatial vari-ability of soil moisture anomalies is also critical for validat-ing terrestrial water storage (TWS) products as provided by Gravity Recovery and Climate Experiment (GRACE, Tapley et al., 2004) satellites. GRACE TWS anomalies (deviations from the temporal mean) integrate anomalies in soil ture, groundwater, snow and surface water, with soil mois-ture as one of the major components (e.g., Rodell et al., 2007). Thus, a similar study on the spatial variability of soil moisture anomalies and its scale dependency is also needed and will be conducted in the future when longer in situ data records become available to obtain more reliable mean soil moisture states in each region.
Acknowledgements. We would like to thank Heye Bogena and an
anonymous reviewer for their comments and suggestions that have helped to improve the quality of this paper.
Edited by: H.-J. Hendricks Franssen
References
Brocca, L., Morbidelli, R., Melone, F., and Moramarco, T.: Soil moisture spatial variability in experimental areas of central Italy, J. Hydrol., 333, 356–373, doi:10.1016/j.jhydrol.2006.09.004, 2007.
Brocca, L., Tullo, T., Melone, F., Moramarco, T., and Morbidelli, R.: Catchment scale soil moisture spatial–temporal variability, J. Hydrol., 422–423, 63–75, 2012.
Choi, M., Jacobs, J. M., and Cosh, M. H.: Scaled spatial vari-ability of soil moisture fields, Geophys. Res. Lett., 34, L01401, doi:10.1029/2006GL028247, 2007.
Cosgrove, B., Lohmann, D., Mitchell, K., Houser, P., Wood, E. F., Schaake, J. C., Robock, A., Marshall, C., Sheffield, J., Duan, Q., Luo, L., Higgins, R. W., Pinker, R. T., Tarpley, J. D., and Meng, J.: Real-time and retrospective forcing in the North American Land Data Assimilation System (NLDAS) project, J. Geophys. Res., 108, 8842, doi:10.1029/2002JD003118, 2003.
Crow, W. and Wood, E.: Multi-scale dynamics of soil moisture vari-ability observed during SGP’97, Geophys. Res. Lett., 26, 3485– 3488, 1999.
Crow, W. and Wood, E.: The value of coarse-scale soil moisture ob-servations for regional surface energy balance modeling, J. Hy-drometeorol., 3, 467–482, 2002.
Dirmeyer, P., Schlosser, C. A., and Brubaker, K. L.: Precipitation, recycling, and land memory: an integrated analysis, J. Hydrome-teorol., 10, 278–288, doi:10.1175/2008JHM1016.1, 2009.
Famiglietti, J. S., Devereaux, J. A., Laymon, C. A., Tsegaye, T., Houser, P. R., Jackson, T. J., Graham, S. T., Rodell, M., and van Oevelen, P. J.: Ground-based investigation of soil moisture variability within remote sensing footprints during the Southern Great Plains 1997 (SGP97) Hydrology Experiment, Water Re-sour. Res., 35, 1839–1851, 1999.
Famiglietti, J. S., Ryu, D., Berg, A. A., Rodell, M., and Jackson, T. J.: Field observations of soil moisture variability across scales, Water Resour. Res., 44, W01423, doi:10.1029/2006WR005804, 2008.
Hu, Z., Chen, Y., and Islam, S.: Multiscaling properties of soil mois-ture images and decomposition of large- and small-scale feamois-tures using wavelet transforms, Int. J. Remote Sens., 19, 2451–2467, 1998.
Jackson, T. J.: Measuring surface soil moisture using passive mi-crowave remote sensing, Hydrol. Process., 7, 139–152, 1993. Li, B., Toll, D., Zhan, X., and Cosgrove, B.: Improving
esti-mated soil moisture fields through assimilation of AMSR-E soil moisture retrievals with an ensemble Kalman filter and a mass conservation constraint, Hydrol. Earth Syst. Sci., 16, 105–119, doi:10.5194/hess-16-105-2012, 2012.
Mitchell, K. E., Lohmann, D., Houser, P. R., Wood, E. F., Schaake, J. C., Robock, A., Cosgrove, B. A., Sheffield, J., Duan, Q., Luo, L., Higgins, R. W., Pinker, R. T., Tarpley, J. D., Lettenmaier, D. P., Marshall, C. H., Entin, J. K., Pan, M., Shi, W., Koren, V., Meng, J., Ramsay, B. H., and Bailey, A. A.: The multi-institution North American Land Data Assimilation System (NLDAS): Uti-lizing multiple GCIP products and partners in a continental dis-tributed hydrological modeling system, J. Geophys. Res., 109, D07S90, doi:10.1029/2003JD003823, 2004.
Mittelbach, H. and Seneviratne, S. I.: A new perspective on the spatio-temporal variability of soil moisture: temporal dynamics versus time-invariant contributions, Hydrol. Earth Syst. Sci., 16, 2169–2179, doi:10.5194/hess-16-2169-2012, 2012.
Njoku, E. G., Jackson, T. J., Lakshmi, V., Chan, T. K., and Nghiem, S. V.: Soil moisture retrieval from AMSR-E, IEEE T. Geosci. Remote, 41, 215–229, 2003.
Parada, L. M. and Liang, X.: A downscaling framework for L band radiobrightness temperature imagery, J. Geophys. Res., 108, 8863, doi:10.1029/2003JD003637, 2003.
Penna, D., Borga, M., Norbiato, D., and Fontana, G. D.: Hillslope scale soil moisture variability in a steep alpine terrain, J. Hydrol., 364, 311–327, 2009.
Rodriguez-Iturbe, I., Vogel, G. K., Rigon, R., Entekhabi, D., Castelli, F., and Rinaldo, A.: On the spatial organization of soil moisture fields, Geophys. Res. Lett., 106, 2757–2760, 1995. Ryu, D. and Famiglietti, J. S.: Characterization of
footprint-scale surface soil moisture variability using Gaussian and beta distribution functions during the Southern Great Plains 1997 (SGP97) hydrology experiment, Water Resour. Res., 41, W12433, doi:10.1029/2004WR003835, 2005.
Rodell, M., Chen, J., Kato, H., Famiglietti, J., Nigro, J., and Wilson, C.: Estimating ground water storage changes in the Mississippi River basin (USA) using GRACE, Hydrogeol. J., 15, 159–166, doi:10.1007/s10040-006-0103-7, 2007.
doi:10.1029/2011WR011518, 2012.
Schaefer, G. L, Cosh, M. H., and Jackson, T. J.: The USDA Natural Resources Conservation Service Soil Climate Analysis Network (SCAN), J. Atmos. Ocean. Tech., 24, 2073–2077, 2007. Seyfried, M. S., Grant, L. E., Du, E., and Humes, K.: Dielectric loss
and calibration of the hydra probe soil water sensor, Vadose Zone J., 4, 1070–1079, 2005.
Tapley, B. D., Bettadpur, S., Ries, J. C., Thompson, P. F., Watkins, M. M.: GRACE measurements of mass variability in the Earth system, Science, 305, 503–505, 2004.
Wang, C., Zuo, Q., and Zhang, R.: Estimating the necessary sampling size of surface soil moisture at different scales us-ing a random combination method, J. Hydrol., 352, 309–321, doi:10.1016/j.jhydrol.2008.01.011, 2008.
Western, A. W. and Bl¨osch, G.: On the spatial scaling of soil mois-ture, J. Hydrol., 217, 203–224, 1999.
Western, A. W., Grayson, R. B., Bl¨oschl, G., and Wilson, D. J.: Spa-tial variability of soil moisture and its implications for scaling, in: Scaling Methods in Soil Physics, editede by: Perchepsky, Y., Selim, M., and Radcliffe, A., CRC Press, Boca Raton, 119–142, 2003.
Xia, Y., Ek, M., Wei, H., and Meng, J.: Comparative analysis of re-lationships between NLDAS-2 forcings and model outputs, Hy-drol. Process., 26, 467–474, doi:10.1002/hyp.8240, 2012. Zhan, X., Liu, J., Jackson, T. J., Meng, J., Weng, F., and Mitchell,