www.hydrol-earth-syst-sci.net/21/1669/2017/ doi:10.5194/hess-21-1669-2017
© Author(s) 2017. CC Attribution 3.0 License.
Identification of dominant hydrogeochemical processes for
groundwaters in the Algerian Sahara supported by inverse
modeling of chemical and isotopic data
Rabia Slimani1, Abdelhamid Guendouz2, Fabienne Trolard3, Adnane Souffi Moulla4, Belhadj Hamdi-Aïssa1, and
Guilhem Bourrié3
1Ouargla University, Fac. des Sciences de la Nature et de la Vie, Lab. Biochimie des Milieux Désertiques, 30000 Ouargla, Algeria
2Blida University, Science and Engineering Faculty, P.O. Box 270, Soumaâ, Blida, Algeria 3INRA – UMR1114 EMMAH, Avignon, France
4Algiers Nuclear Research Centre, P.O. Box 399, Alger-RP, 16000 Algiers, Algeria
Correspondence to:Rabia Slimani ([email protected])
Received: 8 September 2015 – Discussion started: 1 February 2016
Revised: 31 October 2016 – Accepted: 20 November 2016 – Published: 21 March 2017
Abstract. Unpublished chemical and isotopic data taken
in November 1992 from the three major Saharan aquifers, namely the Continental Intercalaire (CI), the Complexe Ter-minal (CT) and the phreatic aquifer (Phr), were integrated with original samples in order to chemically and isotopically characterize the largest Saharan aquifer system and investi-gate the processes through which groundwaters acquire their mineralization. Instead of classical Debye–Hückel extended law, a specific interaction theory (SIT) model, recently in-corporated in PHREEQC 3.0, was used. Inverse modeling of hydrochemical data constrained by isotopic data was used here to quantitatively assess the influence of geochemical processes: at depth, the dissolution of salts from the geo-logical formations during upward leakage without evapora-tion explains the transievapora-tions from CI to CT and to a first end member, a cluster of Phr (cluster I); near the surface, the dis-solution of salts from sabkhas by rainwater explains another cluster of Phr (cluster II). In every case, secondary precip-itation of calcite occurs during dissolution. All Phr waters result from the mixing of these two clusters together with calcite precipitation and ion exchange processes. These pro-cesses are quantitatively assessed by the PHREEQC model. Globally, gypsum dissolution and calcite precipitation were found to act as a carbon sink.
1 Introduction
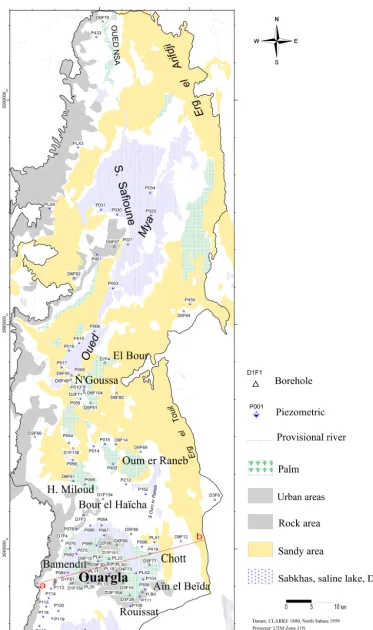
Figure 1.Location and schematic relations of aquifers in Ouargla. Blue lines represent limits between aquifers, and the names of aquifers are given in bold letters; as the limit between Senonian and Mio-Pliocene aquifers is not well defined, a dashed blue line is used. Names of villages and cities are given in roman (Bamendil, Ouargla, Sidi Khouiled), while geological/geomorphological features are in italic (glacis, sabkha, chott, dunes). Depths are relative to the ground surface. Letters “a” and “b” refer to the cross section (Fig. 2) and to the localization map (Fig. 3).
– At the top, the phreatic aquifer (Phr), in the nary sandy gypsum permeable formations of Quater-nary, is almost unexploited, due to its extreme salinity (50 g L−1).
– In the middle, the Complexe Terminal (CT) (Cornet and Gouscov, 1952; UNESCO, 1972) is the most ex-ploited and includes several aquifers in different ge-ological formations. Groundwater circulates in one or the two lithostratigraphic formations of the Eocene and Senonian carbonates or in the Mio-Pliocene sands. – At the bottom, the Continental Intercalaire (CI), hosted
in the lower Cretaceous continental formations (Bar-remian and Albian), mainly composed of sandstones, sands and clays. It is only partially exploited because of its significant depth.
The integrated management of these groundwaters is presently a serious issue for local water resources man-agers due to the large extension of the aquifers and the complexity of the relations between them. Several stud-ies (Guendouz, 1985; Fontes et al., 1986; Guendouz and Moulla, 1996; Edmunds et al., 2003; Guendouz et al., 2003; Hamdi-Aïssa et al., 2004; Foster et al., 2006; OSS, 2008) started from chemical and isotopic information (2H, 18O, 234U,238U,36Cl) to characterize the relationships between
aquifers. In particular, such studies focused on the recharge of the deep CI aquifer system. These investigations espe-cially dealt with water chemical facies, mapped iso-contents of various parameters and reported typical geochemical ra-tios ([SO24−] / [Cl−], [Mg2+] / [Ca2+]) as well as other
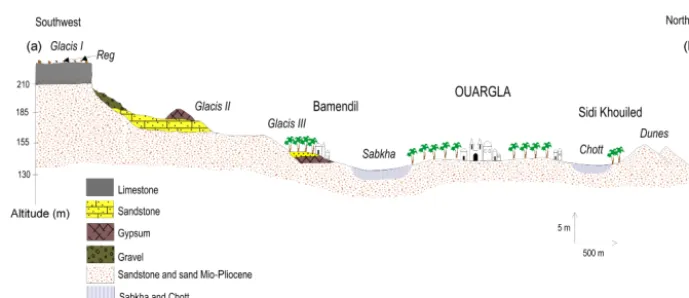
se-Figure 2.Geologic cross section in the region of Ouargla. The blue pattern used for chott and sabkha correspond to the limit of the saturated zone.
lected, which allowed Dai et al. (2006) to optimize simul-taneously transmissivities and geochemical transformations in a confined aquifer. Inverse modeling with PHREEQC 3.0 was used here in a different way (only on geochemical data but for several aquifers) to account for the modifications of the composition of water along the flow path. At least two chemical analyses of groundwater at different points of the flow path, and a set of phases (minerals and/or gases) which potentially react while water circulates, are needed to operate the program (Charlton et al., 1996).
A number of assumptions are inherent to the application of inverse geochemical modeling: (i) the two groundwater anal-yses from the initial and the final boreholes should represent groundwater that flows along the same flow path; (ii) dis-persion and diffusion do not significantly affect groundwater chemistry; (iii) a chemical steady state prevails in the ground-water system during the time considered; and (iv) the mineral phases used in the inverse calculation are or were present in the aquifer (Zhu and Anderson, 2002). The soundness or the validity of the results depends on a valid conceptualiza-tion of the groundwater system, on the validity of the ba-sic hydrogeochemical concepts and principles, on the accu-racy of model input data and on the level of understanding of the geochemical processes occurring in the area (Güler and Thyne, 2004; Sharif et al., 2008). These requirements are ful-filled in the region of Ouargla, which can be considered as a “window” to the largest Saharan aquifer, and thus one of the largest aquifers in the world in a semi-arid to hyper-arid region subject to both global changes: urban sprawl and cli-mate change. The methodology developed here and the data collected can easily be integrated in the PRECOS framework proposed for the management of environmental resources (Trolard et al., 2016).
2 Methodology
2.1 Presentation of the study area
The study area is located in the northeastern desert of Algeria (lower Sahara) (Le Houérou, 2009) near the city of Ouargla (Fig. 1), 31◦540to 32◦10N and 5◦150to 5◦270E, with a mean elevation of 134 (m a.s.l.). It is located in the quaternary val-ley of Oued Mya basin. The present climate belongs to the arid Mediterranean type (Dubief, 1963; Le Houérou, 2009; ONM, 1975/2013), as it is characterized by a mean annual temperature of 22.5◦C, a yearly rainfall of 43.6 mm yr−1and a very high evaporation rate of 2138 mm yr−1.
Ouargla’s region and the entire lower Sahara has expe-rienced during its long geological history alternating ma-rine and continental sedimentation phases. During Secondary era, vertical movements affected the Precambrian basement, causing, in particular, collapse of its central part, along an axis passing approximately through the Oued Righ Valley and the upper portion of the Oued Mya Valley. According to Furon (1960), a epicontinental sea spread to the Lower Eocene of northern Sahara. After the Oligocene, the sea grad-ually withdrew. It is estimated at present that this sea did not reach Ouargla and transgression stopped at the edge of the bowl (Furon, 1960; Lelièvre, 1969). The basin is carved into Mio-Pliocene (MP) deposits, which alternate with red sands, clays and sometimes marls; gypsum is not abundant and dated from the Pontian era (during the MP) (Cornet and Gouscov, 1952; Dubief, 1953; Ould Baba Sy and Besbes, 2006). The continental Pliocene consists of a local limestone crust with puddingstone or lacustrine limestone (Fig. 2), shaped by eolian erosion into flat areas (regs). The Quater-nary formations are lithologically composed of alternating layers of permeable sand and relatively impermeable marl (Aumassip et al., 1972; Chellat et al., 2014).
[image:3.612.126.471.62.211.2]but overexploitation at the end of the 19th century led to a catastrophic decrease of the resource, with presently more than 900 boreholes (ANRH, 2011).
The exploitation of the Senonian aquifer dates back to 1953 at a depth between 140 and 200 m, with a small ini-tial rate of approximately 9 L s−1; two boreholes have been exploited since 1965 and 1969, with a total flow rate of ap-proximately 42 L s−1, for drinking water and irrigation.
The exploitation of the Albian aquifer dates back to 1956; presently, two boreholes are exploited:
– El Hedeb I, 1335 m deep, with a flow rate of 141 L s−1; – El Hedeb II, 1400 m deep, with a flow rate of 68 L s−1.
2.2 Sampling and analytical methods
The sampling programme consisted of collecting samples along transects corresponding to directions of flow for both the Phr and CT aquifers, while it was possible to collect only eight samples from the CI. A total of 107 samples were col-lected during a field campaign in 2013 along the main flow path of Oued Mya. Of these, 67 were from piezometers tap-ping the phreatic aquifer, 32 from CT wells and the last 8 from boreholes tapping the CI aquifer (Fig. 3). Analyses of Na+, K+, Ca2+, Mg2+, Cl−, SO24− and HCO−3 were per-formed by ion chromatography at Algiers Nuclear Research Center (CRNA). Previous and yet unpublished data (Guen-douz and Moulla, 1996) sampled in 1992 are used here too: 59 samples for the Phr aquifer, 15 samples for the CT aquifer and 3 samples for the CI aquifer for chemical analyses and data of18O and3H (Guendouz and Moulla, 1996).
2.3 Geochemical method
PHREEQC was used to check minerals–solutions equilibria using the specific interaction theory (SIT), i.e., the extension of Debye–Hückel law by Scatchard and Guggenheim incor-porated recently in PHREEQC 3.0 (Parkhurst and Appelo, 2013). Inverse modeling was used to calculate the number of minerals and gases’ moles that must, respectively, dissolve or precipitate/degas to account for the difference in compo-sition between initial and final water end members (Plum-mer and Back, 1980; Kenoyer and Bowser, 1992; Deutsch, 1997; Plummer and Sprinckle, 2001; Güler and Thyne, 2004; Parkhurst and Appelo, 2013). This mass balance technique has been used to quantify reactions controlling water chem-istry along flow paths (Thomas et al., 1989). It is also used to quantify the mixing proportions of end-member components in a flow system (Kuells et al., 2000; Belkhiri et al., 2010, 2012).
Inverse modeling involves designing a list of scenarios (modeling setups) that take into account the most plausible combinations of geochemical processes that are likely to oc-cur in our system. For example, the way to identify whether calcite dissolution/precipitation is relevant or not consists of
solving the inverse problem under two alternate scenarios: (1) considering a geochemical system in which calcite is present and (2) considering a geochemical system without calcite. After simulating the two scenarios, it is usually possi-ble to select the setup that gives the best results as the solution to the inverse modeling according to the fit between the mod-eled and observed values. Then one can conclude whether calcite dissolution/precipitation is relevant or not. This step-wise strategy allows us to identify the relevance of a given chemical process by inversely solving the problem through alternate scenarios in which the process is either participat-ing or not (Dai et al., 2006).
In the geochemical modeling inverse, soundness of results is dependent upon valid conceptualization of the system, va-lidity of basic concepts and principles, accuracy of input data and level of understanding of the geochemical processes. We use the information from the lithology, general hydrochemi-cal evolution patterns, saturation indices and mineral stability diagrams to constrain the inverse models.
3 Results and discussion
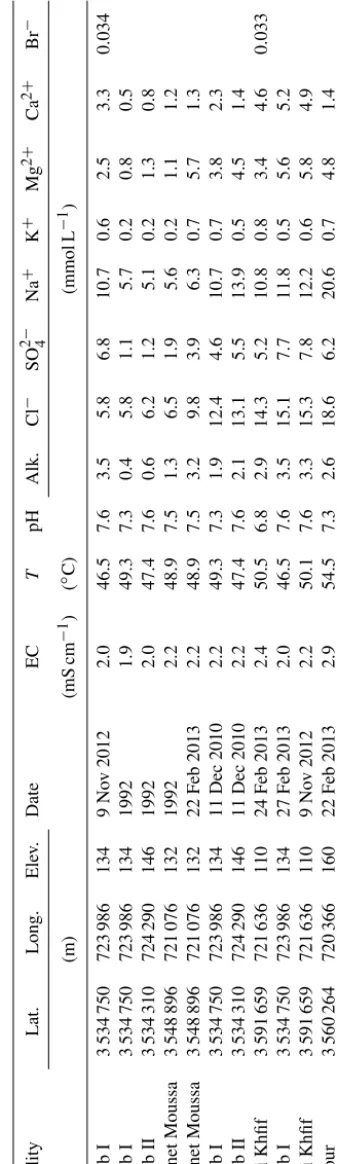
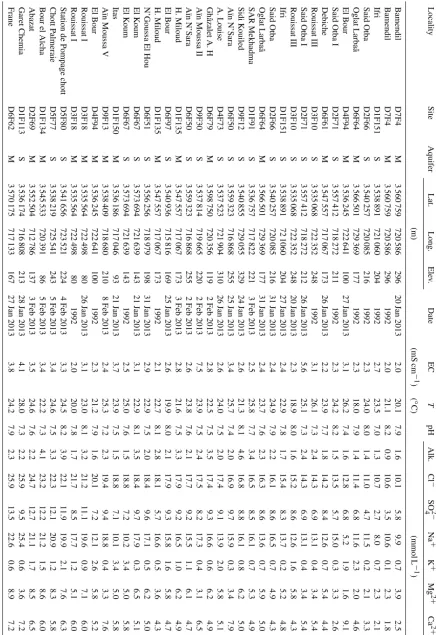
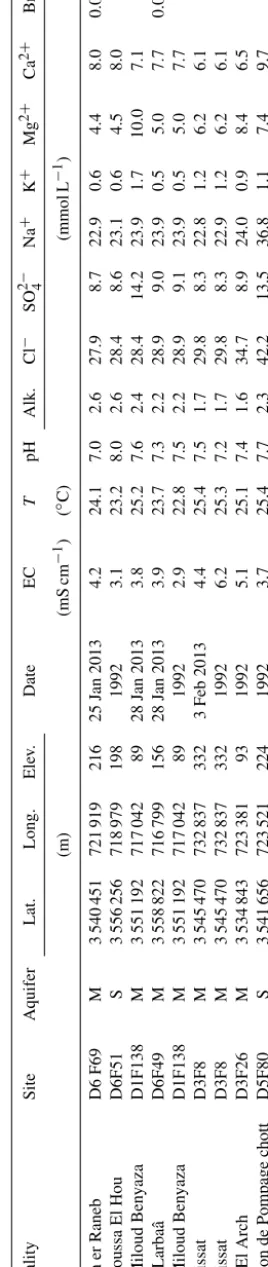
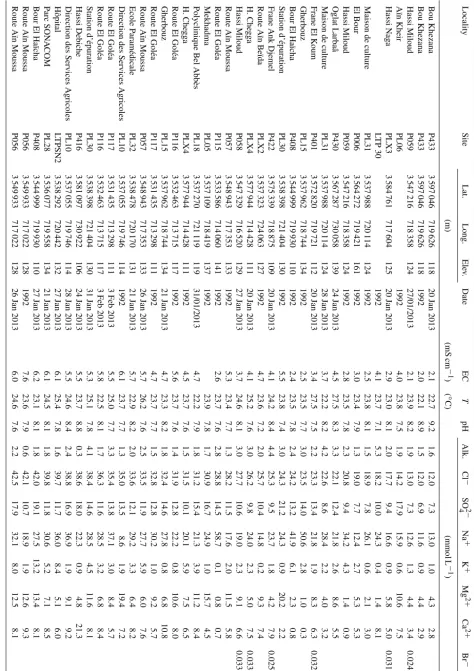
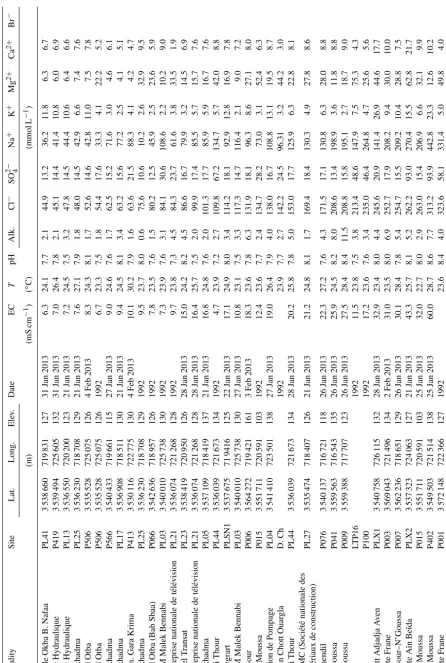
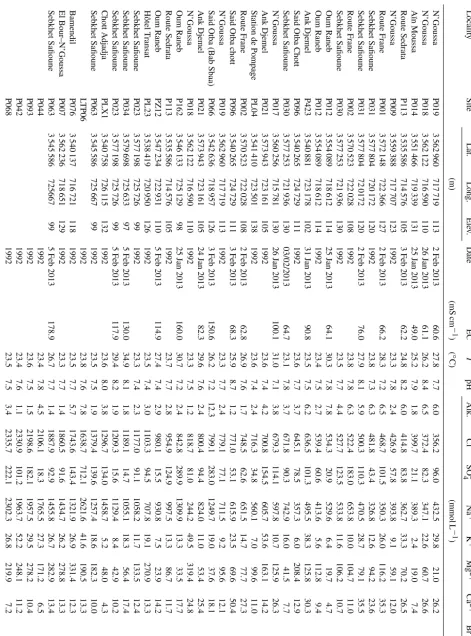
Tables 1 to 4 illustrate the results of the chemical and the iso-topic analyses. Samples are ordered according to an increas-ing electric conductivity (EC), and this is assumed to provide an order for increasing salt content. In both the phreatic and CT aquifers, temperature is close to 25◦C, while for the CI aquifer, temperature is close to 50◦C. The values presented in Tables 1 to 5 are raw analytical data that were corrected for defects of charge balance before computing activities with PHREEQC. As analytical errors could not be ascribed to a specific analyte, the correction was made proportionally. The corrections do not affect the anion-to-anion mole ratios, such as for [HCO3−] / ([Cl−]+2[SO42−]) or [SO24−] / [Cl−], whereas they affect the cation-to-anion ratio, such as for [Na+] / [Cl−].
3.1 Characterization of chemical facies of the
groundwater
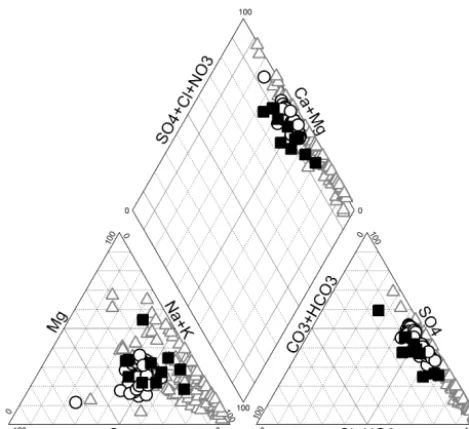
Figure 4. Piper diagram for the Continental Intercalaire (filled squares), Complexe Terminal (open circles) and phreatic (open tri-angles) aquifers.
3.2 Spatial distribution of the mineralization
The salinity of the phreatic aquifer varies considerably de-pending on the location (namely, the distance from wells or drains) and time (due to the influence of irrigation) (Fig. 5a). Its salinity is low around irrigated and fairly well-drained areas, such as the palm groves of Hassi Miloud, just north of Ouargla (Fig. 3), that benefit from freshwater and are drained to the sabkha Oum El Raneb. However, the three lowest salin-ity values are observed in the wells of the Ouargla palm grove itself, where the Phr aquifer water table is deeper than 2 m.
Conversely, the highest salinity waters are found in wells drilled in the chotts and sabkhas (a sabkha is the central part of a chott where salinity is the largest) (Safioune and Oum er Raneb) where the aquifer is often shallower than 50 cm.
The salinity of the CT (Mio-Pliocene) aquifer (Fig. 5b) is much lower than that of the Phr aquifer and ranges from 1 to 2 g L−1; however, its hardness is larger and it contains more sulfate, chloride and sodium than the waters of the Senon-ian formations and those of the CI aquifer. The salinity of the Senonian aquifer ranges from 1.1 to 1.7 g L−1, while the average salinity of the CI aquifer is 0.7 g L−1(Fig. 5c).
A likely contamination of the Mio-Pliocene aquifer by phreatic groundwaters through casing leakage in an area where water is heavily loaded with salt, and therefore par-ticularly aggressive, cannot be excluded.
3.3 Saturation indices
The calculated saturation indices (SIs) reveal that waters from CI at 50◦C are close to equilibrium with respect to cal-cite, except for three samples that are slightly oversaturated.
They are, however, all undersaturated with respect to gypsum (Fig. 6).
Moreover, they are oversaturated with respect to dolomite and undersaturated with respect to anhydrite and halite (Fig. 7).
Waters from the CT and phreatic aquifers show the same pattern, but some of them are more largely oversaturated with respect to calcite, at 25◦C.
However, several phreatic waters (P031, P566, PLX4, PL18, P002, P023, P116, P066, P162 and P036) that are lo-cated in the sabkhas of Safioune, Oum er Raneb, Bamendil and Aïn el Beïda’s chott are saturated with gypsum and anhy-drite. This is in accordance with highly evaporative environ-ments found elsewhere (UNESCO, 1972; Hamdi-Aïssa et al., 2004; Slimani, 2006).
No significant trend of SI from south to north upstream and downstream of Oued Mya (Fig. 7) is observed. This suggests that the acquisition of mineralization is due to geochemical processes that have already reached equilibrium or steady state in the upstream areas of Ouargla.
3.4 Change of facies from the carbonated cluster to the
evaporites’ cluster
The facies shifts progressively from the carbonated cluster (CI and CT aquifers) to the evaporites’ cluster (Phr aquifer) with an increase in sulfates and chlorides at the expense of carbonates (SI of gypsum, anhydrite and halite). This is il-lustrated by a decrease of the [HCO−3] / ([Cl−]+2[SO24−]) ratio (Fig. 8) from 0.2 to 0 and of the [SO24−] / [Cl−] ratio from 0.8 to values smaller than 0.3 (Fig. 9) while salinity increases. Carbonate concentrations tend towards very small values, while it is not the case for sulfates. This is due to both gypsum dissolution and calcite precipitation. Chlorides in groundwater may come from three different sources: (i) an-cient sea water entrapped in sediments, (ii) dissolution of halite and related minerals that are present in evaporite de-posits and (iii) dissolution of dry fallout from the atmosphere, particularly in these arid regions (Matiatos et al., 2014; Hadj-Ammar et al., 2014).
The [Na+] / [Cl−] ratio ranges from 0.85 to 1.26 for the CI aquifer, from 0.40 to 1.02 for the CT aquifer and from 0.13 to 2.15 for the Phr aquifer. The measured points from the three considered aquifers are linearly scattered with good ap-proximation around the unity slope straight line that stands for halite dissolution (Fig. 10). The latter appears as the most dominant reaction occurring in the medium. However, at very high salinity, Na+seems to swerve from the straight line
to-wards smaller values.
T
able
1.
Field
and
analytical
data
for
the
Continental
Intercalaire
aquifer
.
Locality
Lat.
Long.
Ele
v.
Date
EC
T
pH
Alk.
Cl
−
SO
2
−
4
Na
+
K
+
Mg
2
+
Ca
2
+
Br
−
(m)
(mS
cm
−
1)
(
◦C)
(mmol
L
−
1)
Hedeb
I
3
534
750
723
986
134
9
No
v
2012
2.0
46.5
7.6
3.5
5.8
6.8
10.7
0.6
2.5
3.3
0.034
Hedeb
I
3
534
750
723
986
134
1992
1.9
49.3
7.3
0.4
5.8
1.1
5.7
0.2
0.8
0.5
Hedeb
II
3
534
310
724
290
146
1992
2.0
47.4
7.6
0.6
6.2
1.2
5.1
0.2
1.3
0.8
Aouinet
Moussa
3
548
896
721
076
132
1992
2.2
48.9
7.5
1.3
6.5
1.9
5.6
0.2
1.1
1.2
Aouinet
Moussa
3
548
896
721
076
132
22
Feb
2013
2.2
48.9
7.5
3.2
9.8
3.9
6.3
0.7
5.7
1.3
Hedeb
I
3
534
750
723
986
134
11
Dec
2010
2.2
49.3
7.3
1.9
12.4
4.6
10.7
0.7
3.8
2.3
Hedeb
II
3
534
310
724
290
146
11
Dec
2010
2.2
47.4
7.6
2.1
13.1
5.5
13.9
0.5
4.5
1.4
Hassi
Khfif
3
591
659
721
636
110
24
Feb
2013
2.4
50.5
6.8
2.9
14.3
5.2
10.8
0.8
3.4
4.6
0.033
Hedeb
I
3
534
750
723
986
134
27
Feb
2013
2.0
46.5
7.6
3.5
15.1
7.7
11.8
0.5
5.6
5.2
Hassi
Khfif
3
591
659
721
636
110
9
No
v
2012
2.2
50.1
7.6
3.3
15.3
7.8
12.2
0.6
5.8
4.9
El
Bour
3
560
264
720
366
160
22
Feb
2013
2.9
54.5
7.3
2.6
18.6
6.2
20.6
0.7
4.8
1.4
chloride other than halite or from entrapped seawater. Con-versely, a [Na+] / [Cl−] ratio larger than 1 is observed for
phreatic waters, which implies the contribution of another source of sodium, most likely sodium sulfate, that is present as mirabilite or thenardite in the chotts and the sabkha areas. The [Br−] / [Cl−] ratio ranges from 2×10⁻³to 3×10⁻³. The value of this molar ratio for halite is around 2.5×10⁻³, which matches the aforementioned range and confirms that halite dissolution is the most dominant reaction taking place in the studied medium.
In the CI, CT and Phr aquifers, calcium originates both from carbonate and sulfate (Figs. 11 and 12). Three samples from the CI aquifer are close to the [Ca2+] / [HCO−3] 1 : 2 line, while calcium sulfate dissolution explains the excess of calcium. However, nine samples from the Phr aquifer are depleted in calcium, and plotted under the [Ca2+] / [HCO−3] 1 : 2 line. This cannot be explained by precipitation of cal-cite, as some are undersaturated with respect to that mineral, while others are oversaturated.
In this case, a cation exchange process seems to occur and lead to a preferential adsorption of divalent cations, with a release of Na+. This is confirmed by the inverse modeling that is developed below and which implies Mg2+fixation and Na+and K+releases.
Larger sulfate values observed in the phreatic aquifer (Fig. 12) with [Ca2+] / [SO24−]<1 can be attributed to a Na-Mg sulfate dissolution from a mineral bearing such elements. This is, for instance, the case of bloedite.
3.5 Isotope geochemistry
The CT and CI aquifers exhibit depleted and homogeneous 18O contents, ranging from−8.32 to−7.85 ‰. This was al-ready previously reported by many authors (Edmunds et al., 2003; Guendouz et al., 2003; Moulla et al., 2012). On the other hand, 18O values for the phreatic aquifer are widely dispersed and vary between −8.84 and 3.42 ‰ (Table 4). Waters located north of the virtual line connecting, approx-imately, Hassi Miloud to Sebkhet Safioune, are found more enriched in heavy isotopes and are thus more evaporated. In that area, the water table is close to the surface and mixing of both CI and CT groundwaters with phreatic ones through irrigation is nonexistent. Conversely, waters located south of Hassi Miloud up to Ouargla city show depleted values. This is the clear fingerprint of a contribution to the Phr waters from the underlying CI and CT aquifers (Gonfiantini et al., 1975; Guendouz, 1985; Fontes et al., 1986; Guendouz and Moulla, 1996).
[image:7.612.89.258.137.719.2]T
able
2.
Continued.
Locality
Site
Aquifer
Lat.
Long.
Ele
v.
Date
EC
T
pH
Alk.
Cl
−
SO
2
−
4
Na
+
K
+
Mg
2
+
Ca
2
+
Br
−
(m)
(mS
cm
−
1)
(
◦C)
(mmol
L
−
1)
Oum
er
Raneb
D6
F69
M
3
540
451
721
919
216
25
Jan
2013
4.2
24.1
7.0
2.6
27.9
8.7
22.9
0.6
4.4
8.0
0.035
N’Goussa
El
Hou
D6F51
S
3
556
256
718
979
198
1992
3.1
23.2
8.0
2.6
28.4
8.6
23.1
0.6
4.5
8.0
H.
Miloud
Ben
yaza
D1F138
M
3
551
192
717
042
89
28
Jan
2013
3.8
25.2
7.6
2.4
28.4
14.2
23.9
1.7
10.0
7.1
Aïn
Larbaâ
D6F49
M
3
558
822
716
799
156
28
Jan
2013
3.9
23.7
7.3
2.2
28.9
9.0
23.9
0.5
5.0
7.7
0.037
H.
Miloud
Ben
yaza
D1F138
M
3
551
192
717
042
89
1992
2.9
22.8
7.5
2.2
28.9
9.1
23.9
0.5
5.0
7.7
Rouissat
D3F8
M
3
545
470
732
837
332
3
Feb
2013
4.4
25.4
7.5
1.7
29.8
8.3
22.8
1.2
6.2
6.1
Rouissat
D3F8
M
3
545
470
732
837
332
1992
6.2
25.3
7.2
1.7
29.8
8.3
22.9
1.2
6.2
6.1
Aïn
El
Arch
D3F26
M
3
534
843
723
381
93
1992
5.1
25.1
7.4
1.6
34.7
8.9
24.0
0.9
8.4
6.5
Station
de
Pompage
chott
D5F80
S
3
541
656
723
521
224
1992
3.7
25.4
7.7
2.3
42.2
13.5
36.8
1.1
7.4
9.7
M
=
Mio-Pliocene
aquifer;
S
=
Senonian
aquifer
.
Cluster I represents the waters from CI and CT whose iso-topic composition is depleted in18O (average value around
−8.2 ‰) (Fig. 13). They correspond to an old water recharge (paleo-recharge), whose age, estimated by means of14C, ex-ceeds 15 000 yr BP (Guendouz, 1985; Guendouz and Miche-lot, 2006). Thus, it is not a water body that is recharged by recent precipitation. It consists of CI and CT groundwaters and partly of phreatic waters and can be ascribed to an up-ward leakage favored by the extension of faults near Amguid El Biod dorsal.
Cluster II, observed in Sebkhet Safioune, can be ascribed to the direct dissolution of surficial evaporitic deposits con-veyed by evaporated rainwater.
Evaporation alone cannot explain the distribution of data that is observed (Fig. 13). Evidence for this is given in a semi-logarithmic plot (Fig. 14), as classically obtained ac-cording to the simple approximation of the Rayleigh equa-tion (cf. Appendix):
δ18O≈1000×(1−α)log
Cl−+
k,
≈ −log
Cl−
+k, (1)
where α is the fractionation factor during evaporation, ≡ −1000×(1−α) is the enrichment factor andkis a con-stant (Ma et al., 2010; Chkir et al., 2009). CI and CT wa-ters are better separated in the semi-logarithmic plot because they are differentiated by their chloride content. According to Eq. (1), simple evaporation gives a straight line (solid line in Fig. 14). The value ofused is the value at 25◦C, which is equal to−73.5.
P115 is the only sample that appears on the straight evap-oration line (Fig. 14). It should be considered as an outlier since the rest of the samples are all well aligned on the loga-rithmic fit derived from the mixing line of Fig. 13.
The phreatic waters that are close to cluster I (Fig. 13) correspond to groundwaters occurring in the edges of the basin (Hassi Miloud, piezometer P433) (Fig. 14). They are low mineralized and acquire their salinity via two processes, namely dissolution of evaporites along their underground transit up to Sebkhet Safioune and dilution through upward leakage by the less-mineralized waters of the CI and CT aquifers (for example, Hedeb I for CI and D7F4 for CT) (Fig. 14) (Guendouz, 1985; Guendouz and Moulla, 1996).
The rates of the mixing that are due to upward leakage from CI to CT towards the phreatic aquifer can be calculated by means of a mass balance equation. It only requires know-ing theδvalues of each fraction that is involved in the mixing process.
Theδvalue of the mixture is given by
[image:9.612.99.233.89.723.2]Figure 5.Contour maps of the salinity (expressed as global mineralization) in the aquifer system of the(a)phreatic aquifer and(b, c) Com-plexe Terminal (withbindicating Mio-Pliocene andcindicating Senonian); figures are isovalues of global mineralization (values in g L−1).
Average values of mixing fractions from each aquifer to the phreatic waters computed by means of Eq. (2) gave the rates of 65 % for the CI aquifer and 35 % for the CT aquifer. A mixture of a phreatic water component that is close to cluster I (i.e., P433) with another component which is rather close to cluster II (i.e., P039) (Figs. 13 and 14), for an in-termediate water with aδ18O signature ranging from−5 to
−2 ‰, gives mixture fraction values of 52 % for cluster I and 48 % for cluster II. Isotope results will be used to indepen-dently cross-check the validity of the mixing fractions de-rived from an inverse modeling involving chemical data (see Sect. 3.6).
Turonian evaporites are found to lie in between the CI deep aquifer and the Senonian and Miocene formations bearing the CT aquifer. CT waters can thus simply originate from ascending CI waters that dissolve Turonian evaporites, a pro-cess which does not involve any change in18O content. Con-versely, phreatic waters result, to a minor degree, from evap-oration and mostly from dissolution of sabkha evaporites by 18O-enriched rainwater and mixing with CI/CT waters.
Tritium content of water
Tritium contents of the Phr aquifer are relatively small (Ta-ble 4), they vary between 0 and 8 TU. Piezometers PZ12, P036 and P068 show values close to 8 TU; piezometers P018, P019, P416, P034, P042 and P093 exhibit values ranging be-tween 5 and 6 TU; and the rest of the samples’ concentrations are lower than 2 TU.
These values are dated back to November 1992, so they are old values and they are considered high comparatively to what is expected to be found nowadays. In fact, at present times, tritium figures have fallen lower than 5 TU in precipi-tation measured in the northern part of the country.
T
able
3.
Continued.
Locality
Site
Lat.
Long.
Ele
v.
Date
EC
T
pH
Alk.
Cl
−
SO
2
−
4
Na
+
K
+
Mg
2
+
Ca
2
+
Br
−
(m)
(m
S
cm
−
1
)
(◦
C)
(mmol
L
−
1
)
Oum
Raneb
PZ12
3
547
234
722
931
110
1992
23.3
7.6
2.2
2405.6
109.9
2178.6
25.2
199.4
12.7
Hassi
Debiche
P416
3
581
097
730
922
106
1992
23.3
7.8
4.3
2433.7
178.9
2361.1
24.3
196.1
9.2
N’Goussa
P041
3
559
563
716
543
135
1992
23.4
7.9
2.1
2599.7
324.6
2879.0
44.6
152.8
11.0
Sebkhet
Safioune
P034
3
579
698
725
633
97
1992
23.3
7.8
1.9
2752.0
134.1
2616.8
24.4
180.1
10.5
P039
1992
23.4
6.9
1.9
4189.5
201.4
4042.6
17.9
257.8
9.2
Sebkhet
Safioune
P074
1992
23.5
6.5
4.2
4356.5
180.9
2759.9
57.4
930.1
22.6
Sebkhet
Safioune
P037
1992
23.4
6.9
1.5
4953.8
184.5
4611.1
2.9
347.6
7.9
Sebkhet
Safioune
P036
1992
23.4
7.5
1.4
4972.8
108.1
4692.2
36.8
221.1
9.6
F
or
longitude
and
latitude,
the
reference
is
UTM
31
projection
for
north
Sahara
1959
(CLARKE
1880
[image:14.612.313.546.65.420.2]ellipsoid).
Figure 6. Equilibrium diagrams of calcite (top panel) and gypsum (bottom panel) for the Continental Intercalaire (filled squares), Complexe Terminal (open circles) and phreatic (open triangles) aquifers. Equilibrium lines are de-fined as log{Ca2+} +log{CO23−} =logKsp for calcite and
log{Ca2+} +2log{H2O} +log{SO24−} =logKspfor gypsum.
correspond to a rainy event that had happened during the field campaign (5 and 6 November 1992). It is the most represen-tative value for that region and for that time. Unfortunately, all the other stations (Algiers, Ankara and Tenerife) (Mar-tinelli et al., 2014) are subject to a completely different cli-matic regime and (besides the fact that they have more recent values) can absolutely not be used for our case. Therefore, all the assumptions based on recent tritium rain values do not apply to this study.
[image:14.612.102.236.86.643.2]Figure 7.Variation of saturation indices with distance from south to north in the region of Ouargla.
the Cl−versus18O diagrams (Figs. 13 and 14) could partly derive from an ascending drainage from the deep and con-fined CI aquifer (exhibiting depleted homogenous18O con-tents and very low tritium), a vertical leakage that is favored by the Amguid El Biod highly faulted area (Guendouz and Moulla, 1996; Edmunds et al., 2003; Guendouz et al., 2003; Moulla et al., 2012).
3.6 Inverse modeling
We assume that the relationship between18O and Cl−data
Table 4.Isotopic data18O and3H and chloride concentration in the Continental Intercalaire, Complexe Terminal and phreatic aquifers (sampling campaign in 1992).
Piezometer Cl− δ18O 3H Piezometer Cl− δ18O 3H Piezometer Cl− δ18O 3H (mmol L−1) (‰) (UT) (mmol L−1) (‰) (UT) (mmol L−1) (‰) (UT)
Phreatic aquifer
P007 1860.5 −2.5 0 PL15 23.5 −7.85 0.6(1) P074 4356.4 3.4 6.8(8) P009 426.9 −6.6 1.2(3) P066 80.2 −8.1 0.8(1) PL06 14.2 −8.1 1.0(2) P506 54.4 −6.8 1.6(3) PL23 1103.3 −6.1 0 PL30 24.3 −7.48 2.4(4) P018 818.7 −2.9 6.2(11) P063 1379.3 −3.4 8.7(15) P002 522.4 −5.7 0.6(1) P019 779.1 −4.7 5.6(9) P068 2335.6 −3.1 8.8(14) PL21 84.3 −7.7 1.2(2) PZ12 2405.5 −2.3 8.1(13) P030 527.7 −6.6 2.4(4) PL31 18.9 −7.4 1.6(3) P023 1176.9 −2.6 0.2(1) P076 1743.5 −5.6 2.8(5) P433 12.0 −8.8 0 P416 2433.7 −7.9 5.9(9) P021 700.7 −5.2 2.6(4) PL03 84.1 −7.4 1.7(3) P034 2752.0 −1.8 5.7(9) PL04 716.3 −2.9 PL44 109.8 −8.8 1.0(2) P036 4972.7 3.3 2.1(4) P093 2198.5 −2.6 5.1(8) PL05 30.9 −7.4 1.9(3) P037 4953.8 3.1 1.8(3) P096 645.1 −6.1 4.8(8) P408 24.2 −7.9 0 P039 4189.5 1.0 2.2(4) PLX1 1296.6 −5.6 1.1(2) P116 31.9 −7.2 1.1(2) P041 2599.7 −0.6 7.3(13) PLX2 25.7 −7.6 1.3(2) LTP 16 213.4 −7.5 1.6(3) P044 2106.1 −4.5 2.7(5) P015 134.7 −6.8 3.0(5) P117 32.8 −6.9 0.1 P014 336.9 −6.9 2.8(5) P001 323.6 −4.7 2.5(4) PL10 35.0 −7.3 0.2(1) P012 539.3 −6.4 2.2(4) P100 235.0 −5.8 0 PL25 75.6 −7.4 0.9(2) P042 2330.8 2.1 6.0(10) P056 42.1 −7.0 2.9(5) LTP30 18.2 −7.5 1.1(2) P006 19.0 −6.6 0.5(1) P113 954.9 −4.8 0.8(2) LTP06 1638.6 −1.9 2.8(5) P057 28.2 −7.3 1.1(2) PLX4 31.5 −7.1 0.3(1) P031 481.8 −6.1 3.0(5) P059 20.8 −7.8 0 P115 28.8 −2.5 6.8(12)
Borehole Cl− δ18O 3H Borehole Cl− δ18O 3H Borehole Cl− δ18O 3H (mmol L−1) (‰) (UT) (mmol L−1) (‰) (UT) (mmol L−1) (‰) (UT)
Complexe Terminal aquifer
D5F80 42.2 −7.9 D1F138 28.9 −8.1 0.7(1) D2F71 13.5 −8.2 0.6(1) D3F8 29.8 −8.1 1.4(2) D3F18 21.7 −8.2 0.2(1) D7F4 10.6 −8.3 0.1(1) D3F26 34.7 −8.0 0.8(1) D3F10 14.3 −7.9 1.5(2) D2F66 11.0 −8.3 D4F94 20.1 −8.2 0.6(1) D6F51 28.4 −7.9 0.7(1) D1F151 10.8 −8.3 0.4(1) D6F67 18.8 −8.2 3.7(6) D1F135 18.1 −8.1 1.1(2) D6F64 11.4 −8.3 4.3(7)
Continental Intercalaire aquifer
Hadeb I 5.8 −8.0 0 Hadeb II 6.2 −7.9 0.1(1) Aouinet Moussa 6.5 −7.9 1.1(2)
than 35 mmol L−1; cluster II, withδ18O values larger than 3 and very large Cl−concentrations, more specifically larger than 4000 mmol L−1(Table 5); intermediate Phr samples re-sulting from mixing between clusters I and II (mixing line in Fig. 13, mixing curve in Fig. 14) and from evaporation of cluster I (evaporation line in Fig. 14). The mass-balance modeling has shown that relatively few phases are required to derive observed changes in water chemistry and to ac-count for the hydrochemical evolution in Ouargla’s region. The mineral phases’ selection is based upon geological de-scriptions and analysis of rocks and sediments from the area (OSS, 2003; Hamdi-Aïssa et al., 2004).
The inverse model was constrained so that mineral phases from evaporites including gypsum, halite, mirabilite, glauberite, sylvite and bloedite were set to dissolve until they reach saturation, and calcite and dolomite were set to pre-cipitate once they reached saturation. Cation exchange reac-tions of Ca2+, Mg2+, K+and Na+ on exchange sites were
included in the model to check which cations are adsorbed or desorbed during the process. Dissolution and desorption contribute as positive terms in the mass balance, as elements are released in solution. On the other hand, precipitation and adsorption contribute as negative terms, while elements are removed from the solution. CO2(g)dissolution is considered
by PHREEQC as a dissolution of a mineral, whereas CO2(g)
degassing is dealt with as if it were a mineral precipitation. Inverse modeling leads to a quantitative assessment of the different solutes’ acquisition processes and a mass balance for the salts that are dissolved or precipitated from CI, CT and Phr groundwaters (Fig. 14, Table 6), as follows:
– Transition from CI to CT involves gypsum, halite and sylvite dissolution, and some ion exchange, namely cal-cium and potassium fixation on exchange sites against magnesium release, with a very small and quite neg-ligible amount of CO2(g) degassing. The maximum
Table 5.Statistical parameters for the Continental Intercalaire (CI), Complexe Terminal (CT) and phreatic (Phr) aquifer samples selected on the basis ofδ18O and Cl−data (see text).
Aquifer Size Parameter EC T pH Alk. Cl− SO42− Na+ K+ Mg2+ Ca2+ (mS cm−1) (◦C) (mmol L−1)
CI 11 Average 2.2 49.0 7.5 2.3 11.0 4.7 10.3 0.5 3.6 2.4
CI 11 SD 0.3 2.0 0.2 1.0 4.6 2.5 4.6 0.2 2.0 1.8
CT 50 Average 3.2 23.0 7.8 2.3 20.0 8.9 17.0 1.0 5.5 5.6
CT 50 SD 1.1 2.4 0.4 0.8 7.0 2.6 6.0 0.8 2.2 1.7
Phr cluster I 30 Average 3.9 24.0 7.9 2.3 24.7 11.8 24.2 2.1 7.2 5.3 Phr cluster I 30 SD 1.3 1.3 0.4 1.0 6.9 3.4 11.0 1.7 5.0 2.7
[image:17.612.295.547.98.435.2]Phr cluster II 3 Average 23.4 7.0 2.4 4761.0 158.0 4021.0 32.4 500.0 13.0 Phr cluster II 3 SD 0.1 0.5 1.6 350.0 43.0 1093.0 28.0 378.0 8.0
Figure 8.Change from carbonate facies to evaporite from the Con-tinental Intercalaire (filled squares), Complexe Terminal (open cir-cles) and phreatic (open triangles) aquifers.
model consists of a minimum number of phases (i.e., six solid phases and CO2(g)); another model also implies
dolomite precipitation with the same fractional error. – Transition from CT to an average water component
of cluster I involves dissolution of halite, sylvite and bloedite from Turonian evaporites, with a very tiny cal-cite precipitation. The maximum fractional error in el-emental concentration is 4 %. Another model implies CO2(g) escape from the solution, with the same
frac-tional error. Large amounts of Mg2+and SO24− are re-leased within the solution (Sharif et al., 2008; Li et al., 2010; Carucci et al., 2012).
– The formation of Phr cluster II can be modeled as be-ing a direct dissolution of salts from the sabkha by rain-water with positiveδ18O; the most concentrated water (P036 from Sebkhet Safioune) is taken here for clus-ter II, and pure waclus-ter is taken as rainwaclus-ter. In a
de-Figure 9.Change from sulfate facies to chloride from the Continen-tal Intercalaire (filled squares), Complexe Terminal (open circles) and phreatic (open triangles) aquifers.
scending order of amount, halite, sylvite, gypsum and huntite are the minerals that are the most involved in the dissolution process. A small amount of calcite precipi-tates while some Mg2+ is released versus K+fixation
on exchange sites. The maximum elemental fractional error in the concentration is equal to 0.004 %. Another model implies dolomite precipitation with some more huntite dissolving, instead of calcite precipitation, but salt dissolution and ion exchange are the same. Huntite, dolomite and calcite stoichiometries are linearly related, so both models can fit field data, but calcite precipita-tion is preferred compared to dolomite precipitaprecipita-tion at low temperature.
Figure 10. Correlation between Na+ and Cl− concentrations in the Continental Intercalaire (filled squares), Complexe Ter-minal (open circles) and phreatic (open triangles) aquifers. Seawater composition (star) is [Na+]=459.3 mmol L−1 and [Cl−]=535.3 mmol L−1(Stumm and Morgan, 1999, p. 899).
Figure 11.Calcium versus HCO−3 diagram in the Continental In-tercalaire (filled squares), Complexe Terminal (open circles) and phreatic (open triangles) aquifers. Seawater composition (star) is [Ca2+]=10.2 mmol L−1 and [HCO−3]=2.38 mmol L−1 (Stumm and Morgan, 1999, p. 899).
[image:18.612.311.546.290.461.2]Figure 12.Calcium versus SO24− diagram in the Continental In-tercalaire (filled squares), Complexe Terminal (open circles) and phreatic (open triangles) aquifers. Seawater composition (star) is [Ca2+]=10.2 mmol L−1 and [SO42−]=28.2 mmol L−1 (Stumm and Morgan, 1999, p. 899).
Figure 13.Chloride concentration versusδ18O in the Continental Intercalaire (filled squares), Complexe Terminal (open circles) and phreatic (open triangles) aquifers from Ouargla.
[image:18.612.53.288.380.615.2]consid-Figure 14.Log [Cl−] concentration versusδ18O in Continental In-tercalaire (filled squares), Complexe Terminal (open circles) and phreatic (open triangles) aquifers from Ouargla.
eration ion exchange reactions are not found compati-ble with isotope data. Mixing rates obtained with such models are, for example, 98 % of cluster I and 0.9 % of cluster II, which leads to aδ18O=(−7.80 ‰) which is quite far from the real measured value (−3.04 ‰). The main types of groundwaters occurring in the Ouargla basin are thus explained and could quantitatively be recon-structed. An exception is, however, sample P115, which is located exactly on the evaporation line of Phr cluster I. De-spite numerous attempts, it could not be quantitatively re-built. Its 3H value (6.8) indicates that it is derived from a more or less recent water component with very small salt content, most possibly affected by rainwater and some pref-erential flow within the piezometer. As this is the only sam-ple on this evaporation line, there remains doubt regarding its significance.
Globally, the summary of mass transfer reactions occur-ring in the studied system (Table 6) shows that gypsum disso-lution results in calcite precipitation and CO2(g) dissolution, thus acting as an inorganic carbon sink.
4 Conclusions
Two of the aquifers studied in this work, Complexe Terminal and Continental Intercalaire, are the main aquifers of Sahara, by extent (thousands of kilometers from the recharge area to the Gulf of Gabès) and time of transfer (thousands of years). The last one, the phreatic aquifer, is a shallow aquifer. The
chemical facies of these aquifers have long been qualitatively described. Our results quantitatively explain, for the first time, the processes that occur during upward leakage through interaction between solution and the mineral constituents of the aquifers and ultimately by mixing with surface waters. The hydrochemical study of the aquifer system occurring in Ouargla’s basin allowed us to identify the origin of its min-eralization. Waters exhibit two different facies: sodium chlo-ride and sodium sulfate for the phreatic aquifer (Phr), sodium sulfate for the Complexe Terminal (CT) aquifer and sodium chloride for the Continental Intercalaire (CI) aquifer. Cal-cium carbonate precipitation and evaporite dissolution ex-plain the facies change from carbonate to sodium chloride or sodium sulfate that is recorded. However, reactions imply many minerals with common ions, deep reactions without evaporation, as well as shallow processes affected by both evaporation and mixing. Those processes are separated by considering both chemical and isotopic data, and quantita-tively explained making use of an inverse geochemical mod-eling. The latter was applied, for the first time ever, in Al-geria, to an extreme environment featuring a lack of data on a scarce natural resource such as Saharan groundwater. The populations of the region rely on this resource for their daily drinkable water as well as for agriculture, which mainly con-sists of date production and some vegetables that grow within the date-palm groves. Results obtained through inverse mod-eling could help water resources managers, both at the local and the regional scales, to gather the necessary information for an integrated management of that vital resource. More-over, and regarding the large geographic scale of the aquifers, such a pilot study could be taken as a supporting work to fur-ther investigations elsewhere in similar regions. The present study leads to the main result that phreatic waters do not orig-inate simply from infiltration of rainwater and dissolution of salts from the sabkhas. Conversely, Phr waters are largely influenced by the upwardly mobile deep CT and CI ground-waters, with fractions of the latter interacting with evapor-ites from the Turonian formations. Phreatic water occurrence is explained as a mixture of two end-member components: cluster I, which is very close to CI and CT, and cluster II, which is highly mineralized and results from the dissolution by rainwater of salts from the sabkhas. At depth, CI leaks up-wardly and dissolves gypsum, halite and sylvite, with some ion exchange, to give waters of the CT aquifer composition. CT transformation into Phr cluster I waters involves the dis-solution of Turonian evaporites (halite, sylvite and bloedite) with minor calcite precipitation. At the surface, direct dis-solution by rainwater of salts from sabkhas (halite, sylvite, gypsum and some huntite) with precipitation of calcite and Mg2+/ K+ ion exchange results in cluster II Phr composi-tion. All phreatic groundwaters result from a mixing of clus-ter I and clusclus-ter II waclus-ter that is accompanied by calcite pre-cipitation, fixation of Mg2+on ion exchange sites against the release of K+and Na+. Moreover, some CO2(g)escapes from
[image:19.612.53.288.63.303.2]Table 6. Summary of mass transfer for geochemical inverse modeling. Phases and thermodynamic database are from PHREEQC 3.0 (Parkhurst and Appelo, 2013).
Phases Stoichiometry CI/CT CT/Phr I Rainwater/P036 PhrI/PhrII 60/40 %
Calcite CaCO3 – −6.62×10⁻⁶ −1.88×10⁻¹ −2.26×10⁻¹
CO2(g) CO2 −6.88×10
−5 – 8.42×10⁻⁴ 5.77×10⁻⁴
Gypsum CaSO4·2H2O 4.33×10⁻³ – 1.55×10⁻¹ 1.67×10⁻¹
Halite NaCl 7.05×10⁻³ 3.76×10⁻³ 6.72×100 1.28×100 Sylvite KCl 2.18×10⁻³ 1.08×10⁻³ 4.02×10⁻¹ – Bloedite Na2Mg(SO4)2·4H2O – 1.44×10⁻³ – –
Huntite CaMg3(CO3)4 – – 4.74×10⁻² 5.65×10⁻²
Ca ion exchange CaX2 −1.11×10⁻³ – – –
Mg ion exchange MgX2 1.96×10⁻³ – 1.75×10⁻¹ −2.02×10⁻¹
Na ion exchange NaX – – – 3.92×10⁻¹
K ion exchange KX −1.69×10⁻³ – −3.49×10⁻¹ 1.20×10⁻² Values are in mol kg−1H
2O. Positive-phase (mass entering solution) and negative-phase (mass leaving solution) mole transfers indicate dissolution and
precipitation, respectively; this indicates no mass transfer.
The most complex phenomena occur during the dissolution of Turonian evaporites while CI leaks upwardly towards CT, and from Phr I to Phr II, while the transition from CT to Phr I implies a very limited number of phases. Globally, gypsum dissolution and calcite precipitation processes both act as an inorganic carbon sink.
5 Data availability
Appendix A
According to a simple Rayleigh equation, the evolution of the heavy isotope ratio in the remaining liquidRlis given by
Rl≈Rl,0×flα−1, (A1)
wherefl is the fraction of remaining liquid andαthe frac-tionation factor.
The fraction of remaining liquid is derived from chlo-ride concentration, as chlochlo-ride can be considered conserva-tive during evaporation: all phreatic waters are undersatu-rated with respect to halite, which precipitates only in the last stage. Hence, the following equation holds:
fl≡ nw,1 nw,0=
Cl−
0
Cl−1. (A2)
By taking natural logarithms, one obtains
lnRl≈(1−α)×lnCl−+constant. (A3)
As, by definition,
Rl≡RSD×
1+δ
18O 1000
, (A4)
one has
lnRl≡lnRSD+ln
1+δ
18O 1000
,
≈lnRSD+δ
18O
1000. (A5)
Hence, with base 10 logarithms,
δ18O≈ 1000(1−α)logCl−+constant,
Competing interests. The authors declare that they have no conflict of interest.
Acknowledgements. The authors wish to thank the staff members of the National Agency for Water Resources in Ouargla (ANRH) and the Laboratory of Algerian Waters (ADE) for the support provided to the Technical Cooperation programme within which this work was carried out. Analyses of 18O were funded by the project CDTN/DDHI (Guendouz and Moulla, 1996). The support of University of Ouargla and of INRA for travel grants of R. Slimani and G. Bourrié are gratefully acknowledged too.
Edited by: M. Giudici
Reviewed by: G. Martinelli and one anonymous referee
References
ANRH: Inventaire des forages de la Wilaya de Ouargla, Rapport technique, Agence Nationale des Ressources Hydrauliques, Di-rection régionale Sud, Ouargla, 2011.
Aumassip, G., Dagorne, A., Estorges, P., Leèvre-Witier, P., Mahrour, F., Nesson, C., Rouvillois-Brigol, M., and Trecolle, G.: Aperçus sur l’Évolution du paysage quaternaire et le peuplement de la région de Ouargla, Libyca, Cnrpah, Tome XX, Algérie, 205–257, 1972.
Belkhiri, L., Boudoukha, A., Mouni, L., and Baouz, T.: Applica-tion of multivariate statistical methods and inverse geochemical modeling for characterization of groundwater – A case study: Ain Azel plain (Algeria), Geoderma, 159, 390–398, 2010. Belkhiri, L., Mouni, L., and Boudoukha, A.: Geochemical evolution
of groundwater in an alluvial aquifer: Case of El Eulma aquifer, East Algeria, J. Afr. Earth Sci., 66–67, 46–55, 2012.
Carucci, V., Petitta, M., and Aravena, R.: Interaction between shal-low and deep aquifers in the Tivoli Plain (Central Italy) en-hanced by groundwater extraction: A multi-isotope approach and geochemical modeling, Appl. Geochem., 27, 266–280, doi:10.1016/j.apgeochem.2011.11.007, 2012.
Charlton, S., Macklin, C., and Parkhurst, D.: PhreeqcI – A graphical user interface for the geochemical computer program PHREEQC, Rapport technique, US Geological Survey Water-Resources, USA, 1996.
Chellat, S., Bourefis, A., Hamdi-Aïss, a. B., and Djerrab, A.: Pale-oenvironemental reconstitution of Mio-pliocenes sandstones of the lower-Sahara at the base of exoscopic and sequential analy-sis, Pensee J., 76, 34–51, 2014.
Chkir, N., Guendouz, A., Zouari, K., Hadj Ammar, F., and Moulla, A.: Uranium isotopes in groundwater from the continental intercalaire aquifer in Algerian Tunisian Sa-hara (Northern Africa), J. Environ. Radioact., 100, 649–656, doi:10.1016/j.jenvrad.2009.05.009, 2009.
Cornet, A. and Gouscov, N.: Les eaux du Crétacé inférieur conti-nental dans le Sahara algérien: nappe dite “Albien”, in: Congrès géologique international, vol. tome II, Alger, p. 30, 1952. Dai, Z., Samper, J., and Ritzi, R.: Identifying Geochemical
Pro-cesses By Inverse Modeling of Multicomponent Reactive Trans-port in the Aquia Aquifer, Geosphere, 2, 210–219, 2006.
Deutsch, W.: Groundwater Chemistry-Fundamentals and Applica-tions to Contamination, Lewis Publishers, New York, 1997. Dubief, J.: Essai sur l’hydrologie superficielle au Sahara,
Direc-tion du service de la colonisaDirec-tion et de l’hydraulique, Service des Études scientifiques, Algérie, 1953.
Dubief, J.: Le climat du Sahara, Hors-série, Institut de recherches sahariennes, Algérie, 1963.
Eckstein, G. and Eckstein, Y.: A hydrogeological approach to trans-boundary ground water resources and international law, Am. Univers. Int. Law Rev., 19, 201–258, 2003.
Edmunds, W., Guendouz, A., Mamou, A., Moulla, A., Shand, P., and Zouari, K.: Groundwater evolution in the continental inter-calaire aquifer of southern Algeria and Tunisia: trace element and isotopic indicators, Appl. Geochem., 18, 805–822, 2003. Fontes, J., Yousfi, M., and Allison, G.: Estimation of long-term,
dif-fuse groundwater discharge in the northern Sahara using stable isotope profiles in soil water, J. Hydrol., 86, 315–327, 1986. Foster, S., Margat, J., and Droubi, A.: Concept and importance of
nonrenewable resources, no. 10 in IHP-VI Series on Groundwa-ter, UNESCO, Paris, 2006.
Furon, R.: Géologie de l’Afrique, 2nd Edn., Payot, Paris, 1960. Gonfiantini, R., Conrad, G., Fontes, J.-C., Sauzay, G., and Payne,
B.: Étude isotopique de la nappe du Continental Intercalaire et de ses relations avec les autres nappes du Sahara septentrional, Isotop. Tech. Groundw. Hydrol., 1, 227–241, 1975.
Guendouz, A.: Contribution á létude hydrochimique et isotopique des nappes profondes du Sahara nord-est septentrional, Algérie, PhD thesis, Université d’Orsay, Orsay, France, 1985.
Guendouz, A. and Michelot, J.: Chlorine-36 dating of deep ground-water from northern Sahara, J. Hydrol., 328, 572–580, 2006. Guendouz, A. and Moulla, A.: Étude hydrochimique et isotopique
des eaux souterraines de la cuvette de Ouargla, Algérie, Rapport technique, CDTN/DDHI, Algérie, 1996.
Guendouz, A., Moulla, A., Edmunds, W., Zouari, K., Shands, P., and Mamou, A.: Hydrogeochemical and isotopic evolution of water in the complex terminal aquifer in Algerian Sahara, Hy-drogeol. J., 11, 483–495, 2003.
Güler, C. and Thyne, G.: Hydrologic and geologic factors control-ling surface and groundwater chemistry in Indian wells – Owens valley area, southeastern California, USA, J. Hydrol., 285, 177– 198, 2004.
Hadj-Ammar, F., Chkir, N., Zouari, K., Hamelin, B., Deschamps, P., and Aigoun, A.: Hydrogeochemical processes in the Complexe Terminal aquifer of southern Tunisia: An integrated investigation based on geochemical and multivariate statistical methods, J. Afr. Earth Sci., 100, 81–95, 2014.
Hamdi-Aïssa, B., Vallès, V., Aventurier, A., and Ribolzi, O.: Soils and brines geochemistry and mineralogy of hyper arid desert playa, Ouargla basin, Algerian Sahara, Arid Land Res. Manage., 18, 103–126, 2004.
Kenoyer, G. and Bowser, C.: Groundwater chemical evolution in a sandy aquifer in northern Wisconsin, Water Resour. Res., 28, 591–600, 1992.
Kuells, C., Adar, E., and Udluft, P.: Resolving patterns of ground water flow by inverse hydrochemical modeling in a semiarid Kalahari basin, Trac. Model. Hydrogeol., 262, 447–451, 2000. Le Houérou, H.: Bioclimatology and biogeography of Africa,
Lelièvre, R.: Assainissement de la cuvette de Ouargla, rapports géo-hydraulique no. 2, Ministère des Travaux Publique et de la con-struction, Algérie, 1969.
Li, P., Qian, H., Wu, J., and Ding, J.: Geochemical modeling of groundwater in southern plain area of Pengyang County, Ningxia, China, Water Sci. Eng., 3, 282–291, 2010.
Ma, J., Pan, F., Chen, L., Edmunds, W., Ding, Z., Zhou, K., He, J., Zhoua, K., and Huang, T.: Isotopic and geochemical evidence of recharge sources and water quality in the Quaternary aquifer be-neath Jinchang city, NW China, Appl. Geochem., 25, 996–1007, 2010.
Martinelli, G., Chahoud, A., Dadomo, A., and Fava, A.: Isotopic features of Emilia-Romagna region (North Italy) groundwaters: Environmental and climatological implications, J. Hydrol., 519, 1928–1938, doi:10.1016/j.jhydrol.2014.09.077, 2014.
Matiatos, I., Alexopoulos, A., and Godelitsas, A.: Multivariate statistical analysis of the hydrogeochemical and isotopic com-position of the groundwater resources in northeastern Pelo-ponnesus (Greece), Sci. Total Environ., 476–477, 577–590, doi:10.1016/j.scitotenv.2014.01.042, 2014.
Moulias, D.: L’eau dans les oasis sahariennes, organisation hy-draulique, régime juridique, PhD thesis, Algérie, 1927.
Moulla, A., Guendouz, A., Cherchali, M.-H., Chaid, Z., and Ouarezki, S.: Updated geochemical and isotopic data from the Continental Intercalaire aquifer in the Great Occidental Erg sub-basin (south-western Algeria), Quatern. Int., 257, 64–73, 2012. OECD: OECD Environmental Outlook to 2030, Tech. Rep. 1,
Or-ganisation for Economic Cooperation and Development, Paris, 2008.
ONM: Bulletins mensuels de relevé des paramtres climatologiques en Algérie, Office national météorologique, Ouargla, Algérie, 1975/2013.
OSS: Système aquifère du Sahara septentrional, Tech. rep., Obser-vatoire du Sahara et du Sahel, Tunis, 2003.
OSS: Systme aquifère du Sahara septentrional (Algérie, Tunisie, Libye): gestion concertée d’un bassin transfrontal-ier, Tech. Rep. 1, Observatoire du Sahara et du Sahel, Tunis, 2008.
Ould Baba Sy, M. and Besbes, M.: Holocene recharge and present recharge of the Saharan aquifers – a study by numerical mod-eling, in: International symposium – Management of major aquifers, Dijon, France, 2006.
Parkhurst, D. and Appelo, C.: Description of Input and Examples for PHREEQC (Version 3) – A computer program for speciation, batch-reaction, one-dimensional transport, and inverse geochem-ical calculations, Tech. Rep. 6, US Department of the Interior, US Geological Survey, http://wwwbrr.cr.usgs.gov/ (last access: 15 November 2016), 2013.
Plummer, L. and Back, M.: The mass balance approach: application to interpreting the chemical evolution of hydrological systems., American Journal of Science, 280, 130–142, 1980.
Plummer, L. and Sprinckle, C.: Radiocarbon dating of dissolved in-organic carbon in groundwater from confined parts of the upper Floridan aquifer, Florida, USA, J. Hydrol., 9, 127–150, 2001. Sharif, M., Davis, R., Steele, K., Kim, B., Kresse, T., and
Fazio, J.: Inverse geochemical modeling of groundwater evo-lution with emphasis on arsenic in the Mississippi River Val-ley alluvial aquifer, Arkansas (USA), J. Hydrol., 350, 41–55, doi:10.1016/j.jhydrol.2007.11.027, 2008.
Slimani, R.: Contribution à l’évaluation d’indicateurs de pollution environnementaux dans la région de Ouargla: cas des eaux de rejets agricoles et urbaines, MS thesis, Université de Ouargla, Ouargla, 2006.
Stumm, W. and Morgan, J.: Aquatic Chemistry: Chemical Equilib-ria and Rates in Natural Waters, John Wiley and Sons, New York, 1999.
Thomas, J., Welch, A., and Preissler, A.: Geochemical evolution of ground water in Smith Creek valley – a hydrologically closed basin in central Nevada, USA, Appl. Geochem., 4, 493–510, 1989.
Trolard, F., Bourrié, G., Baillieux, A., Buis, S., Chanzy, A., Clas-tre, P., Closet, J.-F., Courault, D., Dangeard, M.-L., Di Virgilio, N., Dussouillez, P., Fleury, J., Gasc, J., Géniaux, G., Jouan, R., Keller, C., Lecharpentier, P., Lecroart, J., Napoleone, C., Mo-hammed, G., Olioso, A., Reynders, S., Rossi, F., Tennant, M., and Lopez, J. D. V.: The PRECOS framework: Measuring the impacts of the global changes on soils, water, agriculture on ter-ritories to better anticipate the future, J. Environ. Manage., 181, 590–601, doi:10.1016/j.jenvman.2016.07.002, 2016.
UNESCO: Projet ERESS, Étude des ressources en eau du Sahara septentrional, Tech. Rep. 10, UNESCO, Paris, 1972.
Vallès, V., Rezagui, M., Auque, L., Semadi, A., Roger, L., and Zouggari, H.: Geochemistry of saline soils in two arid zones of the Mediterranean basin. I. Geochemistry of the Chott Melghir-Mehrouane watershed in Algeria, Arid Soil Res. Rehabil., 11, 71–84, 1997.