A Kinetics Study on the Thermal Degradation of
Starch/Poly (Vinyl Alcohol) Blend
Mohammad Taghi Taghizadeh
*, Reza Abdollahi
Department of Physical Chemistry, Faculty of Chemistry, University of Tabriz, Iran
Copyright © 2015 by authors, all rights reserved. Authors agree that this article remains permanently open access under the terms of the Creative Commons Attribution License 4.0 International License
Abstract
The thermal degradation of starch/poly (vinyl alcohol) (PVA) blend was studied by using TG in air atmosphere. Thermo-analytic investigations on pure starch film and starch/PVA blend film were carried out to evaluate the thermal stability and the respective activation energy of the materials. Experiments in air atmosphere and under non-isothermal and isothermal condition carried out. The Kissinger and Flynn-Wall-Ozawa methods were used to calculate the activation energy of non-isothermal degradation of starch and starch/PVA blends. The results show that these two methods were suitable and effective to describe the thermal degradation of starch and starch/PVA blends. These results are shown that starch/PVA blend was thermally less stable than pure starch and thermal stability of films decreased with increasing PVA content.Keywords
Starch, Poly Vinyl Alcohol, ThermalDegradation
1. Introduction
The thermal degradation of polymers refers to the case where polymers at elevated temperatures start to undergo chemical changes without the simultaneous involvement of another compound [1]. Starch is one of the main polymers present in nature and usually includes about 30% amylase and 70% amylopectin [2]. Structure and properties of starch have been investigated extensively in the past century. Starch has shown advantages and superior characteristics over other natural and synthetic biodegradable polymers, especially because of the low cost of the raw materials. Its applications have been extended from traditional food, paper and textile industries to packaging, controlled drug delivery and many other areas in either its native or modified forms [3].
However, as compared to most petroleum–based polymers, the poor mechanical properties and relatively high hydrophilic nature of starch prevent its use in widespread applications [4]. Chemical and physical properties of starch have been widely investigated due to its suitability to be
converted into a thermoplastic and then to be used in different applications as a result of its known biodegradability, availability and economical feasibility [5]. Starch has been processed in various ways to produce starch plastic. Starch film prepared by casting from solution has been reported. The influence of starch sources, components, molecular mass and plasticizer, such as water and polyols has been studied to improve the mechanical properties of starch plastics [6]. The molecular weight of starch influences many properties of starch-based product, such as expansion rate, cold paste viscosity, water solubility and absorption, the degree of retro-gradation and gelling properties [7]. Today native starch can be processed under controlled high pressure and temperature to give thermoplastic products, which can easily be transformed into injection or blow moulded articles [8].
The other component of cited blend is Poly (vinyl alcohol) (PVA) that is an interesting water-soluble synthetic polymer with a broad range of applications. Mainly it is used as a sizing agent or stabilizer of dispersed systems. Owing to its solubility and biodegradability, PVA films are also increasingly used as packaging materials. Two technologies are mainly used for PVA film production – casting from viscous water solution or blow extrusion from the melt. Therefore, an increase of thermal stability of the melt during processing is an essential aspect that can positively influence the blowing technology of water-soluble PVA films [9].
However, PVA is a biodegradable synthetic material, which has the advantages of good film formation, strong conglutination, and high thermal stability and is a versatile polymer with many industrial applications [4, 10].
research has focused on pure starch-based materials and starch/degradable polymer blend materials such as starch/cellulose, starch/polyvinyl alcohol [13]. In addition, thermal degradation of starch films is important to conduct comprehensive studies on their thermal properties and stability of their application in food and pharmaceutical industries and to facilitate their use, since edible films may be submitted to heat processes during their preparation, processing or consumption [14]. Because of the thermal degradation of these films due to their intrinsic chemical reaction processes during the preparation of PVA/starch blended films, investigation on their degradation kinetics is important to optimize the process conditions [15].
2. Materials and Methods
2.1. Materials
Starch (ST), polyvinyl alcohol (PVA) with Mn=7200 and glycerol (Mn= 92
/
10, grade of pure 78%) purchased from Merck company. The water used to prepare starch/polyvinyl alcohol blend films was distilled water.2.2. Film Preparation
Starch/PVA blend films were prepared using a solvent casting method. 6gr of starch and 5, 10, 15, 20 and 25wt% of PVA respectively, was dissolved in 100 ml of distilled water while mixing at the room temperature. After that, obtained solutions refluxed at 90°C for 30min and then glycerol (used as a plasticizer) added to samples and the mixture stirred for 90 min. The films were prepared by spreading the viscous solution on a Teflon plate surface (20×20 cm) and dried for 12h at 50°C in oven. The fully dried membranes peeled away from the Teflon plate.
2.3. Thermogravimetric Analysis
For the dynamic and isothermal degradation studies, the films (0.25g) of the starch/PVA blend were cut in small pieces and the experiment was carried out in air atmosphere by employing a TGA50 SHIMADZU thermal analyzer.
In the dynamic experiment the films were heated from room temperature to 600°C at the rates of 5, 10, 15 °C/min
while the loss of mass was monitored. For the iso-thermal experiment, the film was heated at a rate of 5°C/min to 200°C,
maintained at this temperature for 15 min and then heated at a rate of 15°C/min to the desired temperature.
3. Theoretical Approach
The kinetic parameters of a thermal decomposition reaction can be evaluated by dynamic and isothermal experiments. In the former case, the sample is heated from
room temperature until its complete decomposition at a linearly programmed rate while in the latter case several isothermal experiments are carried out for different periods of time at a temperature close to the degradation temperature.
The activation energy for thermal degradation of the systems was determined by using the following equations. A reaction rate can be defined as the derivation of the conversion with respect to time. The conversion at the time [α(t)] represents the reaction extent of the component of the sample being degraded, defined by:
(1)
Where ω0, ωt and ω∞ are the initial mass of the sample, the sample mass at the time, t, and the final mass at the end of the degradation process, respectively. The rate of conversion is a linear function of rate constant:
(2)
(3) Where f(α) is the conversion functional relationship depending on the particular degradation mechanism. Most commonly form of f(α) for solid state reactions is (1-α)n and “n” is the reaction order. The logarithm of Eq.3 results the following expressions:
(4) The plot of –Ln(1-α) versus t gives a straight line that its slope is κ.Where κ, was defined as the rate constant dependence to activation energy and can be expressed according to the following Arrhenius equation:
(5) Where Ea is the activation energy and A is the Arrhenius pre-exponential factor (independent of temperature), T is the absolute temperature, and R is the universal gas constant. The logarithm of Eq.5 results in:
(6
)
The plot of Lnκ versus 1/T gives a straight line with the slope –E/R giving the activation energy E. By changing Eq.2, we can approach to Kissinger and Ozawa model:
(7)
For dynamic data obtained at a constant heating rate,
β=dT/dt, that this new term is inserted in Eq.7 to obtain: (8)
0
0
( )
t
t∞
ω − ω
α
=
ω − ω
( ) ( )
d
k T f a
dt
α
=
n
f
(
α
)
=
(
1
−
α
)
(1
)
Ln
kT C
−
− α =
+
RT Ea
Ae
T
)
=
−(
κ
Ea
LnK
LnA
RT
−
=
+
exp
( )
da
A
Ea
f a
dT
RT
−
=
exp
( )
da
A
Ea f a
dT
RT
−
=
(9)
(10)
Where g(α) is the integral of the conversion dependence function and β is the heating rate. The integral of the rate equation in a dynamic heating experiment may be expressed as:
(11)
To get the activation energy, several differential methods as well as integral methods have been developed. The equations used are given in the following section Flynn-Wall-Ozawa Equation. Flynn-Wall and Ozawa provided on approximation to integral (11) and therefore obtained the following expressions:
(12)
Where TMax is the maximum degradation at maximum rate of mass loss. The slope of plot of Lnβ versus 1000/ TMax give the value of –E/R from which we get the value of the activation energy.
Kissinger has developed a model and the equation has the following from:
(13)
Where TMax is the maximum degradation temperature at maximum rate of mass loss, αMax is conversion yield at TMax. Therefore the plot of Ln[β/TMax] versus 1000/ TMax gives the values of E in the regression analysis from Eq.13.
4. Results and Discussion
4.1. Isothermal Degradation
Studies on the thermal degradation of starch reported that thermal reactions for starch start around 300°C with thermal condensation between hydroxyl groups of starch chains to form ether segments and liberation of water molecules and other small molecular species. Dehydration of neighboring hydroxyl groups in the glucose ring also occurred, resulting in the formation of C=C bonds or breakdown of the glucose ring [16]. Aldehyde groups were formed at the same time possibly as endgroups when the glucose ring was fractured. Increasing temperature generated aromatic rings, such as substituted benzene and furan structures with either –CH2–
or –CH2–O–CH2– as the main linkages between the aromatic groups. The starch structure disintegrated after heating to 400℃, and above that temperature a highly crosslinked system was formed similar to thermally crosslinked phenol/benzene/furfuryl resins. Thereafter, the thermal reactions of the system followed similar reaction pathways as phenol–formaldehyde or furfuryl resins undergoing thermal crosslinking and decomposition at increased temperatures [17, 18].
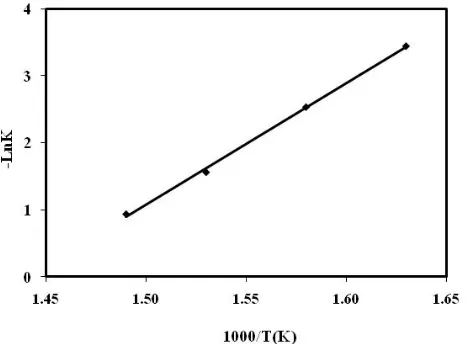
The pure starch and starch/PVA blend were decomposed at the temperatures used for isothermal degradation. The initial mass of the sample was 250mg and their weight losses were measured as a function of heating time, shows the weight loss of pure starch (Figure 1) and starch/PVA blend (Figure 2) versus time, taken at 5min intervals. The reduced weight was lower for the system with higher temperature. The weight loss of pure starch sample is the lower than starch/PVA blend. The k (T) values that refer to rate constant of reaction, for the pure starch and starch/PVA blend were calculated from slopes of the plots of –Ln (1-α) versus time (Tab. 1). The results show that k (T) increased with temperature, obviously. Fig. 3 and 4 show the plots of Ln κ(T) versus 1/T that give us the value of activation energy which was 150 kJ/mol for pure starch decreased to 67 kJ/mol for starch/PVA blend due to the presence of PVA.
Figure 1. The weight loss plots against time for the isothermal
degradation of pure starch at different temperature using. Degradation time at –♦–340 ºC, –■–360 ºC, –▲–380 ºC and–●– 400 ºC.
4.2. Non-isothermal Degradation
Thermal degradation of polymeric materials is a consequence of the fact that the organic macromolecules inside the polymer matrix as well as low-molecular weight organic molecules are stable only up to a certain temperature range. The thermogravimetric TG/TGA curves for starch and starch/PVA blends at various heating rate are showed in Fig. 5 and 6. The pure starch and starch/PVA blend curves showed a tree-step decomposition pattern.
( )
( )
da
g a
f a
=
( )
A
exp
Ea
g a
dT
RT
−
=
β
0
( )
p aT E
RT
T
A
g a
=
e dT
−β
∫
MaxRT
E
a
Eg
AR
Log
Log
]
2
.
315
0
.
456
)
(
[
]
[
β
=
−
−
1 max 2
max max
(1
)
nAR
E
Ln
Ln
Ln n a
T
E
RT
−
β
=
+
−
−
−
[image:3.595.316.549.390.567.2]Figure 2. The weight loss plot against time for the isothermal degradation of starch/PVA blends at different temperature using. Degradation time at
–♦–340 ºC, –■–360 ºC, –▲–380 ºC and–*– 400 ºC.
Figure 3. The degradation plot of –LnK against 1/T for the isothermal
degradation of PE at different temperature using (Eq.(4)).
Figure 4. The degradation plot of –LnK against 1/T for the isothermal
degradation of PE at different temperature using (Eq.(4)).
The first step of degradation (up to about 260°C) was related to the loss of adsorbed and bound water, accompanied by the formation of volatile disintegrated products. The second step was related to the degradation of
[image:4.595.312.545.161.334.2]the starch and starch/PVA blend at 260°C to 360°C that, this step was described polymer degradation structure. This step was studied to determine the kinetic parameters. After that, further heating broke down the polymer backbone and the TG/DTG curves under air atmosphere at heating rate for pure starch and starch/PVA blend presented a mass loss.
Figure 5. TGA/DTG curves of pure starch at various heating rate. Heating
rate(a) 5°C/min,(b)10 °C /min K,(c)15 °C /min.
The activation energy related to the second thermal event of the pure starch and starch/PVA blend were obtained the isoconversional methods of Flynn-Wall-Ozawa and Kissinger to the mass losses defined by TG/DTG curves at 5, 10, 15°C/min .
Figure 6. TGA/DTG curves of starch/PVA blend at various heating rate.
Heating rate (a) 5°C/min,(b) 10 °C /min,(c) 15 °C /min.
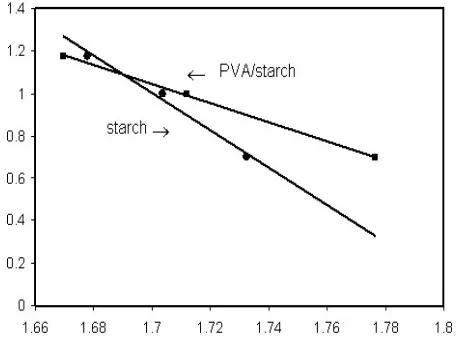
[image:4.595.62.295.306.478.2] [image:4.595.313.549.444.624.2] [image:4.595.63.291.514.678.2]experimental data that for polymer degradation is a complex and unknown parameter but also, we can use kinetic free methods such as Kissinger and Flynn-Wall-Ozawa For PVA starch/starch, while the Kissinger method is independent of any thermal degradation mechanism. According to Eq.13, the activation energy of degeneration can be obtained from Ln (β/Tmax2) vs 1000/T. Results can be seen in Fig. 7.
Figure 7. Kissinger method applied to experimental data at different
heating rates.
Figure 8. Flynn-wall-Ozawa method applied to experimental data at
different heating rates
The activation energy of starch and PVA/starch are 76 and 158 kJ/mol, respectively. The Flynn-Wall-Ozawa method is also independent of degradation mechanism. Eq.12 was used for calculation of the activation energy of starch and starch/PVA blend.
Plotting logβ Vs 1000/T with any constant degree of conservation (α=5%) will result group of lines, as shown in Fig.8. The activation energy values of E and E′, which can be calculated by estimating the slope of each line for the values of PVA starch/starch, are E=81 and E′=160Kj/mol, respectively.
According to the results, we can find the consistency of activation energy of Kissinger and Flynn-Wall-Ozawa
methods for PVA starch/starch blends. This means that both methods are suitable and effective for degradation of PVA starch/starch blends.
Table 1. Comparison of rate constants for pure starch and starch/PVA
blend calculated in different temperatures.
T (°C) Pure starch Starch/PVA blend k (min-1) k (min-1)
340 0.0319 0.0537
360 0.0793 0.0891
380 0.2102 0.1261
400 0.3932 0.1686
5. Conclusions
In this study we assessed the pure starch film and starch/PVA blend film were synthesized and their thermal stability studied by non-isothermal, isothermal Thermogravimetric analysis. The results showed that starch/PVA blend was less thermally stable compared to pure starch and, thermal stability decreased with increasing the value of polyvinyl alcohol. The calculation of the activation energy of isothermal degradation of pure starch and starch/PVA blends were obtained by Kissinger and Ozawa methods. For pure starch film, the activation energy of degradation obtained by Kissinger and Flynn-Wall-Ozawa methods were 158 and 160kJ/mol, respectively. For PVA/starch blend, the corresponding activation energies of degradation were 76 and 81 kJ/mol, respectively. Obviously, the activation energy obtained by Kissinger was close to that by Flynn-Wall-Ozawa, which means that these two methods were suitable to describe the thermal degradation of starch and Starch/PVA blends.
REFERENCES
[1] W. Schnabel, Polymer Degradation: Principles and Practical Applications,(Akademie-Verlag, Berlin, 1981).
[2] M. Zhai, F. Yoshii, T. Kume and K. Hashim, Carbohyd. Polym. 50, 295 (2002).
[3] Z. Stojanovic, L. Katsikas, I. Popovic, S. Jovanovic and K. Jeremic, Polym. Degrad. Stab.87, 177 (2005).
[4] SH. Tang, P. Zou, H. Xiong and H. Tang, Carbohyd. Polym. 72, 521(2008).
[5] J. F. Mano, D. Koniarova and R. L. Reis, J. Mater. Sci. 14, 127 (2003).
[6] M. Zhai, F. Yoshii and T. Kume, Carbohyd Polym. 52, 311 (2003).
[image:5.595.315.551.146.234.2] [image:5.595.62.291.175.340.2] [image:5.595.63.293.386.557.2][8] U. Funke, W. Bergthaller and M. G. Lindhauer, Polym. Degrad. Stab. 97, 163 (1997).
[9] J. L. Willett, M. M. Millard and B. K. Jasberg, Polym.38, 5983 (1997).
[10]W.J. Lee, Y. N. Youn, Y. H.Yun and S. D. Yoon, J. Polym. Environ. 15, 35 (2007).
[11]N. Follain, C. Joly, P. Dole and C. Bliard, Carbohyd. Polym. 60, 185 (2005).
[12]N. Tudorachi, C. N. Cascaval, M. Rusu and M. Pruteanu, Polym. Test.19, 785 (2000).
[13]Y. Yun, Y. Na and S. Yoon, J. Polym. Environ. 14, 71 (2006). [14]R. M. D. Soares, A. M. F. Lima, R. V. B. Oliveira, A. T. N.
Pires and V. Soldi, Polym. Degrad. Stab. 90, 449 (2005). [15]B. Sreedhar, D. K. Chattopadhyay, M. Sri Hari Karunakar and
A.R.K Sastry, J. Appl. Polym. Sci. 101, 25 (2006).
[16]R. M. van der Einde, M. E. van der Veen, H. Bosman, A. J. van der Goot and R.M. Boom, J. Food Eng. 66, 147 (2005). [17]X. Zhang, J. Golding and I. Burgar, Polym. 43, 5791 (2002). [18]X. Zhang, M. G. Looney, D. H. Solomon, A.K. Whittaker,