THE NATIONAL
POLICY AND
ADVISORY BOARD
FOR ENTERPRISE,
TRADE, SCIENCE,
TECHNOLOGY AND
INNOVATION
State Expenditure on
Science & Technology, 1999
Financial allocations by Government for 1999 to institutions
engaged in any activity related to science and technology - the
Science and Technology Budget for 1999.
Is é Forfás an bord náisiúnta um polasaí agus comhairle le haghaidh fiontraíochta, trádála, eolaíochta, teicneolaíochta agus nuála. Is é an comhlacht é a bhfuil comhactaí dlíthiúla an stáit maidir le cur-chun-cinn tionscail agus forbairt teicneolaíochta dílsithe ann. Is é an comhlacht é freisin trína dciomnaítear cumhachtaí ar Fhiontraíocht Éireann le tionscail dúchais a chur chus cinn agus ar ghníomhaireacht Forbartha Tionscail na hÉireann (GFT Éireann) le hinfheistíocht isteach sa tir a chur chun tosaight. Is iad feighmeanna Fhorfáis:
■ comhairle a chur ar an Aire ó thaobh cúrsaí a bhaineann le forbairt tionscail sa Stát
■ comhairle maidir le forbairt agus comhordú polasaithe a chur ar fáil d’Fhiontraíocht Éireann, d’GFT Éireann agus d’aon fhoras eile dá leithéid (a bunaíodh go reachtúil) a d’fhéadfadh an tAire a ainmniú trí ordú
■ forbairt na tionsclaíochta, na teicneolaíochta, na margaíochta agus acmhainní daonna a spreagadh sa Stát
■ bunú agus forbairt gnóthas tionsclaíoch ón iasacht a spreagadh sa Stát, agus
■ Fiontraíocht Éireann agus GFT Éireann a chomhairliú agus a chomhordú ó thaobh a gcuid feidhmeanna.
Forfás is the national policy and advisory board for enterprise, trade, science, technology and innovation. It is the body in which the State’s legal powers for industrial promotion and technology development have been vested. It is also the body through which powers are delegated to Enterprise Ireland for the promotion of indigenous industry and to IDA Ireland for the promotion of inward investment.. The broad functions of Forfás are to:
■ advise the Minister on matters relating to the development of industry in the State
■ to advise on the development and co-ordination of policy for Enterprise Ireland, IDA Ireland and such other bodies (established by or under statute) as the Minister may by order designate
■ encourage the development of industry, technology, marketing and human resources in the State
■ encourage the establishment and development in the State of industrial undertakings from outside the State, and
■ advise and co-ordinate Enterprise Ireland and IDA Ireland in relation to their functions.
Peter Cassells CHAIRMAN
Sean Dorgan CHIEF EXECUTIVE, IDA IRELAND
Dan Flinter CHIEF EXECUTIVE, ENTERPRISE IRELAND
Paul Haran SECRETARY GENERAL, DEPARTMENT OF ENTERPRISE, TRADE AND EMPLOYMENT
Professor Michael Hillery CHAIR OF MANUFACTURING ENGINEERING, UNIVERSITY OF LIMERICK
John Lynch DIRECTOR GENERAL, FÁS
William Murphy PARTNER, TYNAN DILLON AND COMPANY
Feargal O’Rourke PARTNER, TAXATION, PRICEWATERHOUSECOOPERS
William Scally ECONOMIST
Professor Yvonne Scannell FACULTY OF LAW, TRINITY COLLEGE
John Travers CHIEF EXECUTIVE, FORFÁS
Science & Technology
Budget
Review of State Expenditure on Science &
Technology 1990 - 1999
Incorporating financial expenditures in 1998 and allocations for
1999 by Government to Institutions engaged in any activity related
to science and technology.
For further information contact: Kevin Lydon Evaluation and Indicators Unit
TABLE OF CONTENTS
Page
Executive Summary________________________________________________________________i
Commentary______________________________________________________________________v
1. Introduction __________________________________________________________________1
2. Research and Development ____________________________________________________3
2.1 Performance of R&D in the Government Sector ______________________________3 2.2 Funding of R&D by the State________________________________________________6 2.3 International comparisons on Public Sector R&D ____________________________11
3. Science and Technology for the Productive Sectors______________________________13
3.1 Industry__________________________________________________________________13 3.2 Agriculture ______________________________________________________________15 3.3 Environment______________________________________________________________16 3.4 Marine and Forestry ______________________________________________________17 3.5 Energy __________________________________________________________________19 3.6 Transportation____________________________________________________________21
4. Education and Health Activities________________________________________________22
5. General Public Service Activities________________________________________________25
6. Economic and Social Activities ________________________________________________27
7. Total Government Funding of Science and Technology __________________________28 7.1 Total Funding and Trends__________________________________________________28 7.2 Funding by Type of Cost __________________________________________________30 7.3 Comparison with GDP and Total Government Budgets ______________________31 7.4 Government Departments/Agencies funding science & technology____________32 7.5 Funding by activity________________________________________________________40 7.6 Public Funding Trends by objective ________________________________________41 7.7 Matrix of science & technology funding sources ____________________________44 7.8 Transfer payments between Departments/Agencies__________________________44
8. EU Support for Science and Technology ________________________________________48
8.1 EU Support by Objective __________________________________________________48
Appendix 1: Community Support Framework initiatives in support of S&T____________53
Appendix 2: Methodology and Definitions ________________________________________59
Introduction
The ‘Science and Technology Budget’ – the annual Forfás publication on State expenditure on science and technology – provides details of the allocations made by Government to scientific and technological (S&T) activities. In all, 43 government departments/agencies are included in the 1999 S&T Budget.
The total value of the S&T Budget in 1999 amounts to £932m (e1,183m), an increase of £46.5m (e59.0m) or 5.2% over the 1998 level. All of the increase is accounted for by public funds, which rose from £729m (e926m) outturn in 1998 to an allocation of £776m (e985m) this year; the balance of £156m (e198m) arises from income earned from the activities of the departments and agencies.
While the total figure is large, the coverage of the S&T Budget is very wide and includes S&T-based activities such as those of Met Eireann, Geological Survey and some elements of the Office of Public Works. The ‘real science’ element of the S&T Budget is considerably smaller than the total, and this year a clearer overall picture is presented by focusing sections of the report on different activities within the overall total.
Research and Development
The levels of R&D performed in the various Government Departments and their agencies is not the same as the total amounts they fund. An individual Department or its agencies might perform little or no R&D themselves while providing funding to other performers in either the public or private sectors.
The allocation for performance of R&D in 1999 is £61.8m (e78.5m), up from £58.2m (e73.9m) last year. Nearly £13m (e17m) of this is earned income so that the public funds invested amount to £49m (e62m) in 1999.
In terms of funding, the Departments and their agencies are allocating £176m (e224m) to R&D in 1999, up from £155m (e196m) in 1998. A significant proportion of this increase represents additional support for R&D in enterprises via the Department of Enterprise, Trade and Employment.
S&T for the Productive Sectors
This section details the support from government departments and agencies for scientific and technological activities other than research and development. These include
information and advisory services, scientific and technical services, education and training, and technology transfer. These activities are to support the productive sectors of the economy – industry, agriculture, environment, marine and forestry, energy and transportation.
Education and Health
Educational activities, which include all third level education in the field of science and technology, account for 61% of the total S&T Budget in 1999. S&T courses in the Universities and Institutes of Technology are the major performers.
General Public Service
Activities concerned with science and technology undertaken by the Government in support of regulatory and statutory activities are included in this section. They account for 6.0% of the total budget.
Economic and Social Activities
Government expenditure on economic and social activities (2% of total budget) includes economic forecasting and modelling, social policy, policies for rural development, and the analysis of poverty and its causes.
Total S&T Budget
The funding matrix for the total S&T Budget overleaf illustrates the funding sources for all S&T activities included in the budget.
EU Support for S&T
Indicative Distribution of Government Funds for Science and Technology, 1999, £m
Research & Development S&T Tech. S&T Ed. Tech. Other Total Info Services & Train. Transfer S&T Business Third PATS(2) Extra- Govern- Total
Level (1) mural ment
Sources of Funds: £m £m £m £m £m £m £m £m £m £m £m
Direct 3.2 23.6 2.0 7.2 40.0 76.0 25.4 68.1 350.5 1.3 65.0 586.3
Exchequer
Indirect 21.7 21.7 21.7
CSF funds 48.7 14.6 5.9 0.0 9.2 78.4 7.8 5.7 72.7 2.8 0.6 167.9
EU contracts 0.0 17.0 3.6 0.0 3.6 24.1 10.3 1.3 0.0 0.0 0.1 26.0
Business 0.0 7.0 4.2 0.0 5.6 16.9 0.3 12.1 0.1 0.0 0.3 39.5
Other earned income 0.0 12.0 3.7 0.0 3.4 19.1 10.7 20.2 36.7 0.0 3.4 90.2
Total 52.0 95.9 19.3 7.2 61.8 236.2 54.5 107.5 460.0 4.1 69.4 931.6
(1) Science and Technology departments only
(2) AMT Ireland is classified under S&T information and technical services
Indicative Distribution of Government Funds for Science and Technology, 1999,
e
m
Research & Development S&T Tech. S&T Ed. Tech. Other Total Info Services & Train. Transfer S&T Business Third PATS(2) Extra- Govern- Total
Level (1) mural ment
Sources of Funds: em em em em em em em em em em em
Direct 4.1 30.0 2.5 9.1 50.8 96.5 32.2 86.5 445.0 1.6 82.6 744.4
Exchequer
Indirect 27.5 27.5 27.5
CSF funds 61.9 18.6 7.5 0.0 11.7 99.6 9.8 7.2 92.3 3.5 0.7 213.2
EU contracts 0.0 21.5 4.6 0.0 4.5 30.6 13.1 1.7 0.0 0.0 0.1 33.0
Business 0.0 8.9 5.3 0.0 7.2 21.4 0.3 15.3 0.1 0.0 0.4 50.2
Other earned income 0.0 15.2 4.7 0.0 4.3 24.2 13.6 25.7 46.6 0.0 4.4 114.5
Total 66.0 121.8 24.5 9.1 78.5 299.9 69.2 136.5 584.0 5.2 88.2 1182.9
(1) Science and Technology departments only
1. Introduction
The purpose of the ‘Science and Technology (S&T) Budget’ is to monitor the public spend on science and technology and to provide details about the performance of the many public sector organisations which are involved in scientific and technological activities in some way.
The total S&T Budget increased from an outturn of £885m (e1124m) in 1998 to an allocation of £931.6m (e1182.1m) in 1999, an increase of 5.2%. Above average increases were recorded for research and development activities (+11.5%) and for other supports to industry in terms of information and technical services (+25.3%).
Once again this year the major emphasis in this report is placed on research and development, it being a vital element of the total S&T spend. The R&D element is important because it is the most discretionary component of the ‘S&T Budget’ compared to other Government expenditures in support of regulatory and statutory functions. Although only accounting for approximately 25% of the overall budget, it is capable of exerting an influence disproportionate to its size.
In addition to this, the role of research has become increasingly relevant in modern society where the complexity and technology-content of most activities offers significant
opportunities for innovation based solutions to complex problems. This is reinforced by the findings of the Technology Foresight Exercise which recommends that priority be given to making Ireland a centre for research excellence in certain niche areas.
2. Research and Development
Total public funding of research and development in the economy increased from an outturn of £154.5m (e196.2m) in 1998 to an allocation of £176.1m (e223.6m) in 1999. This net increase of £21.6m (e27.4m) is composed of a gross increase in a number of areas totalling £32.0m (e40.7m) and a reduction of £9m (e11m) in the Department of Education and Science allocation to research.
The increased allocations to R&D (£32.0m) (e40.7m) consists mainly of additional funding for the research and technological innovation (RTI) scheme operated by Enterprise Ireland on behalf of the Department of Enterprise, Trade and Employment. All of this is EU money, from the Community Support Framework, and matched by funds from the companies being grant aided to undertake R&D or technology transfer activities. The total allocation in this RTI scheme in 1999 is £29.0m (e36.8m), up from £11.2m (e14.2m) in 1998. This scheme finishes with the end of the current CSF programme in 1999.
The explanation for the reduction is derived from the Department of Education and Science’s scheduling of its spending of the £45m (e57m) for research contained in the £280m (e356m) Scientific and Technological Education (Investment) Fund. The draw down was £21m(e27m) in 1998, £13m(e17m) in 1999 and the balance in 2000. All of this funding is for capital purposes and is a first step in addressing the equipment and facilities deficit in the research capabilities of the third level colleges. The new £180m(e229m) programme for research in third level colleges announced in November 1998 incorporates this £45m(e57m).
3. Other S&T Activities
Outside the area of research and development there were increased allocations to science and technology this year in four main areas:
■ Industry related activities: +£13.8m(e17.5m) or 25.3%. These were accounted for by increased allocations to training activities in FAS (+£9.2m)(e11.7m) and by the Department of Enterprise, Trade and Employment’s subscription to the European Space Agency (+£3.4m)(e4.3m) which is paid every second year.
■ Agriculture related activities: +£3.8m(e4.8m) or 7.3%. Most of the increase (£3m)(e4m) relates to the functions of the Department of Agriculture and Food.
■ General Public Service activities: +£8.3m(e10.5m) or 18%. The biggest increase here was for the Central Statistics Office (+£3.5m(e4.4m) or 21%).
■ Economic and Social activities: +£4.7m(e6.0m) or 146%. This was accounted for totally by spending by the Department of Social, Community and Family Affairs on the planning and development of new computer systems for the administration of social welfare services.
4. Funding of Irish Science and Technology
Between 1990 and 1999 the total value of the ‘Science and Technology Budget’ increased from £348m(e442m) to £931.6m(e1182.9m). In that period the percentage of the total which is funded by the Exchequer remained broadly constant around 65%, while the EU contribution increased from 8% to 18% at the expense of private (earned) funds which declined from 27% to 17%. Nearly two thirds (64%) of the increase over this period was accounted for by additional expenditures on education and training for science and engineering. A further 17% increase occurred in industry-related S&T and there were lesser percentage increases for agriculture, marine, environment, health, and general public service S&T activities. The decline in private funding of public sector science and technology activities over the period mainly reflects the recent changes in the way third level education is funded and the abolition of tuition fees. Public funding of R&D increased from £51.9m(e65.9m) in 1990 to £176.1m(e223.6m) in 1999, an increase of 240%.
The EU contribution to public sector S&T in Ireland grew again in 1999, from
The 1990s have seen an unprecedented reappraisal of Irish science, technology and education policies. New arrangements for policy advice and co-ordination, including Inter-departmental and Cabinet Committees on Science, Technology and Innovation and new funding mechanisms for Higher Education (HE) college-based research activities, have been established. The Government has also established the Irish Council for Science, Technology and Innovation (ICSTI) to advise it on the strategic direction of science and technology policy, embracing all aspects including scientific research, third-level
education, technology and R&D in industry, financing for innovation, public awareness of S&T, and prioritisation of state spending on S&T.
Recent significant developments that will affect the S&T landscape are:
■ The Department of Education and Science have establishing a £180m(e229m) Programme for Research in Third Level Institutions 1999-2001. The aim of this programme is to put in place formal mechanisms to develop a high quality research environment in Ireland
■ The ICSTI Technology Foresight Exercise has urged the strategic investments in research, science and technology to effectively underpin Ireland’s development as a knowledge society.
As a result changes have been made to the ‘Science & Technology Budget’ – the annual Forfás publication on State Expenditure on Science and Technology – to reflect the new situation. The changes are not radical ones but they have been made in response to some of the work of ICSTI on public expenditure priorities. For the most part the changes are to the way in which the data are presented, giving greater prominence and emphasis than in the past to research and development. Arising from the greater visibility of, and interest in, the S&T Budget a number of government departments have requested changes in the coverage of the data relating to their activities. As far as possible, without too great an impact on the long-established time series of S&T Budget data, those requests have been complied with.
This document provides details of the allocations made by Government to scientific and technological (S&T) activities. In all, 43 government departments/agencies are included in the 1999 S&T Budget. The information on which the analysis is based was supplied by government departments, offices, agencies and other recipient institutions following finalisation of the overall government estimates for the public services for 1999, and after the operating institutions had decided on the distribution of their allocations over their programmes.
Figure 1 indicates the public sector organisations funding and performing S&T activities in 1999.
FIGURE 1. GOVERNMENT DEPARTMENTS/AGENCIES FUNDING S&T, 1999
DEPARTMENTS AGENCY DEPARTMENTS AGENCY
Agriculture & Food Teagasc Education & Science HEA
DIAS
Enterprise, Trade & Forfás Environment & Local EPA
Employment Enterprise Ireland Government NRA
IDA Ireland Social, Community and
NMRC Family Affairs
Patents Office
NMAC Arts, Heritage,
FÁS Gaeltacht and the Islands Údarás na
Innovation Centre Gaeltachta
NSAI Museum
Public Enterprise GSI Health & Children HRB
RPII Postgraduate
Met Eireann Medical & Dental
Board
Marine & Natural Marine Institute Taoiseach NESC
Resources BIM
Central Fisheries Board COFORD
OFFICES CSO OPW Central Bank State Laboratory Ordnance Survey
INCORPORATED
COMPANIES ESRI Shannon Development SRAI
See appendix 3 for explanation of acronyms.
Section 2 of this report examines research and development for the public sector in 1999. Section 3 considers other public sector activities related to the productive sectors of the economy. Section 4 covers S&T education, training and health, while Section 5 include a range of other public sector S&T activities. Section 6 is concerned with science and technology activities undertaken by the Government in support of economic and social activities.
Research and development (R&D) in all countries is performed in three distinct sectors of the economy – the business sector, the universities and technological institutes of the third level sector, and the government sector. The State both funds R&D activities performed in all three sectors and also arranges for R&D to be performed within the state sector in order to promote its own strategic objectives. This section examines both performance and funding of R&D by the State.
2.1 Performance of R&D in the Government Sector
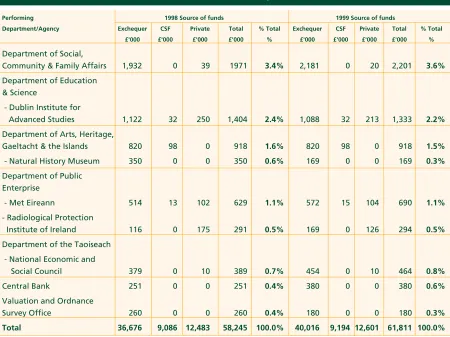
Table 1 gives the profile of R&D performance in the government sector. The total 1999 allocation is £61.8m(e78.5m), representing about 0.4% of total government budget allocations of over £14 billion (e18 billion). Indeed, nearly £12.6m(e16.0m) of the total comes from earned income, so that the public investment in R&D, which is performed in the state sector, is only £49.2m(e62.5m). There was an increase in total R&D spend in 1999 of £3.5m(e4.4m) (7.5%) over the 1998 outturn.
2. RESEARCH AND DEVELOPMENT
Table 1 Performance of Research and Development in the Government Sector
Performing 1998 Source of funds 1999 Source of funds
Department/Agency Exchequer CSF Private Total % Total Exchequer CSF Private Total % Total
£'000 £'000 £'000 £'000 % £'000 £'000 £'000 £'000 %
Department of
Agriculture & Food 1,412 132 395 1,939 3.3% 2,616 345 493 3,454 5.6%
- Teagasc 12,579 4,872 5,929 23,380 40.1% 12,042 4,888 5,747 22,677 36.7%
Department of the Marine
& Natural Resources 430 0 6 436 0.7% 400 0 6 406 0.7%
- COFORD 36 110 0 146 0.3% 40 120 0 160 0.3%
- Marine Institute 5,859 2,004 1,362 9,225 15.8% 7,835 1,340 1,245 10,419 16.9%
- Salmon Research
Agency of Ireland 492 63 69 624 1.1% 558 118 53 728 1.2%
Department of Health
and Children 509 0 0 509 0.9% 643 0 0 643 1.0%
- Health Research Board 4,851 0 370 5,221 9.0% 4,935 0 665 5,600 9.1%
Department of Enterprise,
Trade & Employment 0 0 0 0 0.0% 125 375 0 500 0.8%
- FÁS 703 493 0 1,196 2.1% 741 521 0 1,262 2.0%
- Enterprise Ireland 557 416 608 1,580 2.7% 544 429 607 1,580 2.6%
- Innovation Centre 247 110 0 357 0.6% 252 105 0 357 0.6%
- National Microelectronics
Applications Centre 0 32 486 518 0.9% 0 35 425 460 0.7%
Department of Environment & Local
Government 124 0 0 124 0.2% 94 0 0 94 0.2%
- Environmental Protection
Agency 949 712 1,097 2,758 4.7% 952 773 1,107 2,832 4.6%
- National Roads Authority 573 0 101 674 1.2% 545 0 77 622 1.0%
Department of Finance
Table 1 Performance of Research and Development in the Government Sector
Performing 1998 Source of funds 1999 Source of funds
Department/Agency Exchequer CSF Private Total % Total Exchequer CSF Private Total % Total
£'000 £'000 £'000 £'000 % £'000 £'000 £'000 £'000 %
Department of Social,
Community & Family Affairs 1,932 0 39 1971 3.4% 2,181 0 20 2,201 3.6%
Department of Education & Science
- Dublin Institute for
Advanced Studies 1,122 32 250 1,404 2.4% 1,088 32 213 1,333 2.2%
Department of Arts, Heritage,
Gaeltacht & the Islands 820 98 0 918 1.6% 820 98 0 918 1.5%
- Natural History Museum 350 0 0 350 0.6% 169 0 0 169 0.3%
Department of Public Enterprise
- Met Eireann 514 13 102 629 1.1% 572 15 104 690 1.1%
- Radiological Protection
Institute of Ireland 116 0 175 291 0.5% 169 0 126 294 0.5%
Department of the Taoiseach
- National Economic and
Social Council 379 0 10 389 0.7% 454 0 10 464 0.8%
Central Bank 251 0 0 251 0.4% 380 0 0 380 0.6%
Valuation and Ordnance
Survey Office 260 0 0 260 0.4% 180 0 0 180 0.3%
Total 36,676 9,086 12,483 58,245 100.0% 40,016 9,194 12,601 61,811 100.0%
[image:16.595.67.517.143.480.2]* Where there are transfers from one S&T agency/department to another the funds are accounted for in the performing agency
Table 1A Performance of Research and Development in the Government Sector
Performing 1998 Source of funds 1999 Source of funds
Department/Agency Exchequer CSF Private Total % Total Exchequer CSF Private Total % Total
e'000 e'000 e'000 e'000 % e'000 e'000 e'000 e'000 %
Department of Agriculture
& Food 1,793 168 501 2,462 3.3% 3,322 438 626 4,385 5.6%
- Teagasc 15,972 6,186 7,528 29,686 40.1% 15,290 6,206 7,297 28,793 36.7%
Department of the Marine
& Natural Resources 546 0 8 554 0.7% 508 0 8 515 0.7%
- COFORD 46 140 0 185 0.3% 51 152 0 203 0.3%
- Marine Institute 7,439 2,544 1,729 11,713 15.8% 9,948 1,701 1,581 13,229 16.9%
- Salmon Research Agency
of Ireland 625 80 88 792 1.1% 708 150 67 924 1.2%
Department of Health
and Children 646 0 0 646 0.9% 816 0 0 816 1.0%
Table 1A Performance of Research and Development in the Government Sector
Performing 1998 Source of funds 1999 Source of funds
Department/Agency Exchequer CSF Private Total % Total Exchequer CSF Private Total % Total
e'000 e'000 e'000 e'000 % e'000 e'000 e'000 e'000 %
Department of Enterprise,
Trade & Employment 0 0 0 0 0.0% 159 476 0 635 0.8%
- FÁS 893 626 0 1,519 2.1% 941 661 0 1,602 2.0%
- Enterprise Ireland 707 528 772 2,006 2.7% 691 545 771 2,006 2.6%
- Innovation Centre 314 140 0 453 0.6% 320 133 0 453 0.6%
- National Microelectronics
Applications Centre 0 41 617 658 0.9% 0 44 540 584 0.7%
Department of Environment and
Local Government 157 0 0 157 0.2% 119 0 0 119 0.2%
- Environmental Protection
Agency 1,205 904 1,393 3,502 4.7% 1,209 981 1,406 3,596 4.6%
- National Roads Authority 728 0 128 856 1.2% 692 0 98 790 1.0%
Department of Finance
- Economic and Social
Research Institute 2,044 0 1,885 3,930 5.3% 2,137 0 2,162 4,299 5.5%
Department of Social,
Community& Family Affairs 2,453 0 49 2,503 3.4% 2,769 0 25 2,795 3.6%
Department of Education & Science
- Dublin Institute for
Advanced Studies 1,425 41 317 1,783 2.4% 1,381 41 270 1,692 2.2%
Department of Arts, Heritage,
Gaeltacht & the Islands 1,041 124 0 1,166 1.6% 1,041 124 0 1,166 1.5%
- Natural History Museum 444 0 0 444 0.6% 215 0 0 215 0.3%
Department of Public Enterprise
- Met Eireann 653 16 129 799 1.1% 726 19 132 876 1.1%
- Radiological Protection
Institute of Ireland 147 0 222 370 0.5% 215 0 160 373 0.5%
Department of the Taoiseach
- National Economic and
Social Council 481 0 13 494 0.7% 576 0 13 589 0.8%
Central Bank 319 0 0 319 0.4% 482 0 0 482 0.6%
Valuation and Ordnance
Survey Office 330 0 0 330 0.4% 228 0 0 228 0.3%
Total 46,569 11,537 15,850 73,956 100.0% 50,810 11,674 16,000 78,484 100.0%
* Where there are transfers from one S&T agency/department to another the funds are accounted for in the performing agency
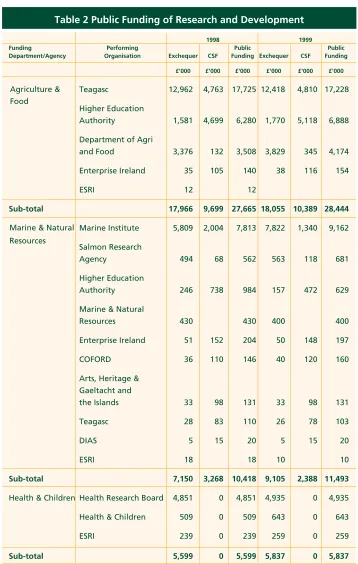
2.2 Funding of R&D by the State
Table 2 shows the Government funding of R&D, which can be performed either in the Government sector itself, in the business sector or in third level education colleges. The total allocation is £176.1m(e223.6m), up from £154.5m(e196.2m) in 1998 (an increase of 14.0%). This increase is mainly accounted for by an additional £19m(e24m) for R&D grants for enterprises via the Department of Enterprise, Trade and Employment. The source of this funding comes from a revised EU scheme, Research, Technology and Innovation Measure (RTI) which was approved by the EU in 1997. This was to ensure availability of additional money, as funds allocated by the EU for Measure 1 of the Research and Development Sub Programme and Measure 3 of the Food Programme were fully allocated by the middle of 1997.
Table 2 Public Funding of Research and Development
1998 1999
Funding Performing Public Public
Department/Agency Organisation Exchequer CSF Funding Exchequer CSF Funding
£'000 £'000 £'000 £'000 £'000 £'000
Enterprise Ireland 2,595 18,492 21,087 2,309 39,662 41,971
PAT's 2,032 6,102 8,134 1,959 5,881 7,840
Higher Education
Authority 1,710 5,131 6,841 1,705 5,115 6,820
IDA Ireland 112 6,232 6,344 50 6,000 6,050
Shannon
Development 629 3,139 3,768 1,095 4,000 5,095
NMRC 707 2,122 2,829 645 1,933 2,578
FAS 703 493 1,196 741 521 1,262
Údarás na Gaeltachta 791 791 900 900
Dept. of Enterprise,
Trade & Employment 13 13 149 375 524
Innovation Centre 247 110 357 252 105 357
ESRI 132 132 52 52
NMAC 7 54 61 5 51 55
DIAS 6 17 23 6 17 23
Sub-total 8,893 42,683 51,576 8,967 64,560 73,527
Higher Education
Authority 21,055 21,055 22,196 22,196
Education & Science 27,078 27,078 18,093 18,093
DIAS 1,111 1,111 1,077 1,077
ESRI 71 71 38 38
Sub-total 49,315 0 49,315 41,404 0 41,404
Enterprise, Trade & Employment
Table 2 Public Funding of Research and Development
1998 1999
Funding Performing Public Public
Department/Agency Organisation Exchequer CSF Funding Exchequer CSF Funding
£'000 £'000 £'000 £'000 £'000 £'000
Teagasc 12,962 4,763 17,725 12,418 4,810 17,228
Higher Education
Authority 1,581 4,699 6,280 1,770 5,118 6,888
Department of Agri
and Food 3,376 132 3,508 3,829 345 4,174
Enterprise Ireland 35 105 140 38 116 154
ESRI 12 12
Sub-total 17,966 9,699 27,665 18,055 10,389 28,444
Marine Institute 5,809 2,004 7,813 7,822 1,340 9,162
Salmon Research
Agency 494 68 562 563 118 681
Higher Education
Authority 246 738 984 157 472 629
Marine & Natural
Resources 430 430 400 400
Enterprise Ireland 51 152 204 50 148 197
COFORD 36 110 146 40 120 160
Arts, Heritage & Gaeltacht and
the Islands 33 98 131 33 98 131
Teagasc 28 83 110 26 78 103
DIAS 5 15 20 5 15 20
ESRI 18 18 10 10
Sub-total 7,150 3,268 10,418 9,105 2,388 11,493
Health & Children Health Research Board 4,851 0 4,851 4,935 0 4,935
Health & Children 509 0 509 643 0 643
ESRI 239 0 239 259 0 259
Sub-total 5,599 0 5,599 5,837 0 5,837
Table 2 Public Funding of Research and Development
1998 1999
Funding Performing Public Public
Department/Agency Organisation Exchequer CSF Funding Exchequer CSF Funding
£'000 £'000 £'000 £'000 £'000 £'000
Environment & Environmental
Local Protection Agency 981 712 1,693 982 773 1,755 Government
National Roads
Authority 573 573 545 545
Higher Education
Authority 162 162 300 300
Environment &
Local Gov 155 155 136 136
Met Eireann 10 10 57 57
Marine Institute 50 50 13 13
ESRI 11 11 7 7
Teagasc 26 26 0
Sub-total 1,780 874 2,654 1,740 1,073 2,813
Arts, Heritage, Údarás na Gaeltachta 927 927 1,000 1,000 Gaeltacht &
the Islands Dept. of Arts,
Heritage, etc 841 841 833 833
Natural History
Museum 350 350 169 169
Sub-total 2,118 0 2,118 2,002 0 2,002
Public Enterprise Met Eireann 504 13 517 514 15 529
R.P.I.I. 116 116 169 0 169
Sub-total 620 13 632 683 15 698
Social, Community etc 2,505 2,505 7,554 7,554
ESRI 102 102 89 89
Sub-total 2,608 0 2,608 7,643 0 7,643
Finance E. S. R. I. 1,025 0 1,025 1,229 0 1,229
Taoiseach N. E. S. C. 379 0 379 454 0 454
Central Bank Central Bank 251 0 251 380 0 380
Ordnance Survey Ordnance Survey 260 0 260 180 0 180
Total 97,964 56,537 154,501 97,678 78,425 176,103
%Total 63% 37% 100% 55% 45% 100%
* Public funds are exchequer & CSF funds Social,
Table 2A Public Funding of Research and Development
1998 1999
Funding Performing Public Public
Department/Agency Organisation Exchequer CSF Funding Exchequer CSF Funding
e'000 e'000 e'000 e'000 e'000 e'000
Enterprise Ireland 3,295 23,480 26,775 2,932 50,360 53,292
PAT's 2,580 7,748 10,328 2,487 7,467 9,955
Higher Education
Authority 2,171 6,515 8,686 2,165 6,495 8,660
IDA Ireland 142 7,913 8,055 63 7,618 7,682
Shannon
Development 799 3,986 4,784 1,390 5,079 6,469
NMRC 897 2,694 3,592 819 2,454 3,273
FAS 893 626 1,519 941 661 1,602
Údarás na Gaeltachta 1,004 1,004 1,143 1,142
Dept. of Enterprise,
Trade & Employment 16 16 189 476 665
Innovation Centre 314 140 453 320 133 453
ESRI 168 168 66 66
NMAC 9 69 77 6 65 70
DIAS 8 22 29 8 21 29
Sub-total 11,292 54,196 65,488 11,386 81,974 93,360
Higher Education
Authority 26,734 26,734 28,183 28,183
Education & Science 34,382 34,382 22,973 22,973
DIAS 1,411 1,411 1,367 1,367
ESRI 90 90 48 48
Sub-total 62,617 0 62,617 52,572 0 52,572
Teagasc 16,458 6,048 22,506 15,768 6,107 21,875
Higher Education
Authority 2,007 5,966 7,974 2,247 6,498 8,746
Department of Agri
& Food 4,287 168 4,454 4,862 438 5,300
Enterprise Ireland 44 133 178 48 147 195
ESRI 15 15
Sub-total 22,812 12,315 35,127 22,925 13,191 36,116
Enterprise, Trade
& Employment
Education & Science
Table 2A Public Funding of Research and Development
1998 1999
Funding Performing Public Public
Department/Agency Organisation Exchequer CSF Funding Exchequer CSF Funding
e'000 e'000 e'000 e'000 e'000 e'000
Marine Institute 7,376 2,544 9,920 9,932 1,701 11,633
Salmon Research
Agency 627 86 714 715 150 865
Higher Education
Authority 312 937 1,249 199 599 799
Marine & Natural
Resources 546 546 508 508
Enterprise Ireland 65 193 259 63 188 250
COFORD 46 140 185 51 152 203
Arts, Heritage &
Gaeltacht etc. 42 124 166 42 124 166
Teagasc 35 105 140 33 99 131
DIAS 6 19 25 6 19 25
ESRI 23 23 13 13
Sub-total 9,079 4,149 13,228 11,561 3,032 14,593
Health & Children Health Research Board 6,159 0 6,159 6,266 0 6,266
Health & Children 646 0 646 816 0 816
ESRI 303 0 303 329 0 329
Sub-total 7,109 0 7,109 7,411 0 7,411
Environmental
Protection Agency 1,246 904 2,150 1,247 981 2,228
National Roads
Authority 727 727 692 692
Higher Education
Authority 206 206 381 381
Environment &
Local Gov 197 197 173 173
Met Eireann 13 13 72 72
Marine Institute 63 63 16 16
ESRI 14 14 9 9
Teagasc 33 33 0
Sub-total 2,260 1,110 3,370 2,209 1,362 3,572
Marine & Natural Resources
Table 2A Public Funding of Research and Development
1998 1999
Funding Performing Public Public
Department/Agency Organisation Exchequer CSF Funding Exchequer CSF Funding
e'000 e'000 e'000 e'000 e'000 e'000
Údarás na Gaeltachta 1,177 1,177 1,270 1,270
Dept. of Arts,
Heritage, etc 1,068 1,068 1,058 1,058
Natural History
Museum 444 444 215 215
Sub-total 2,689 0 2,689 2,542 0 2,542
Public Enterprise Met Eireann 640 16 656 653 19 672
R.P.I.I. 147 147 215 0 215
Sub-total 787 16 802 867 19 886
Social, Community etc 3,181 3,181 9,592 9,592
ESRI 129 129 113 113
Sub-total 3,311 0 3,311 9,705 0 9,705
Finance E. S. R. I. 1,301 0 1,301 1,560 0 1,560
Taoiseach N. E. S. C. 481 0 481 576 0 576
Central Bank Central Bank 318 0 319 482 0 482
Ordnance Survey Ordnance Survey 330 0 330 228 0 228
Total 124,389 71,787 196,176 124,025 99,579 223,605
%Total 63% 37% 100% 55% 45% 100%
* Public funds are exchequer & CSF funds
Of the total of £176.1m(e223.6m) some £78m(e99m), or 45%, comes from the EU via the Community Support Framework initiative. In some areas this reliance on EU support is even more critical; for example, the R&D activities funded by the Department of Enterprise, Trade and Employment are 88% funded by the CSF. A major proportion of that Department’s activities are in the form of grants to industry - £51m(e65m) out of £74m(e94m) total - which are heavily EU-dependent.
2.3 International Comparisons on Public Sector R&D
It is generally useful to compare the performance of a country in any major area of activity with what is happening in that area in other countries of a similar size and stage of
development. In the case of Ireland it is difficult to identify any exact comparator economies. As recently as ten years ago the whole of Ireland was classified with Greece, Portugal and parts of Spain and Italy, as an underdeveloped region of Europe. This has changed today, mainly due to the performance of a number of high growth, high technology industrial sectors. Again, there are relatively few countries with a similar industrial profile to Ireland. Nevertheless, international comparisons should be made and it would be unwise to discount
Arts, Heritage, Gaeltacht and the Islands
different form elsewhere. Such international comparisons are now common in relation to national competitiveness indicators, and research and development is a widely accepted measure of competitiveness.
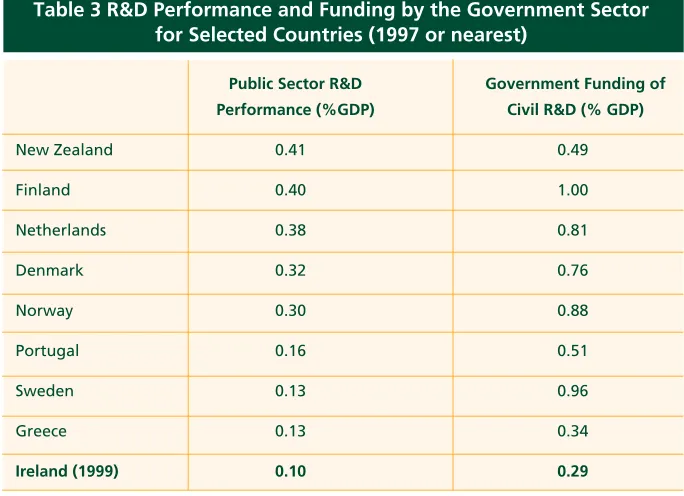
Table 3 shows both the performance of R&D in the public sector (excluding the higher education sector) and the funding of R&D by the Government (this would fund R&D performed not only in the public sector but also in the business sector and in the higher education sector).
Table 3 R&D Performance and Funding by the Government Sector
for Selected Countries (1997 or nearest)
Public Sector R&D Government Funding of Performance (%GDP) Civil R&D (% GDP)
New Zealand 0.41 0.49
Finland 0.40 1.00
Netherlands 0.38 0.81
Denmark 0.32 0.76
Norway 0.30 0.88
Portugal 0.16 0.51
Sweden 0.13 0.96
Greece 0.13 0.34
Ireland (1999) 0.10 0.29
Source: OECD
There is a wide variation in approaches and results between the different countries. Most of the countries except Sweden have a similar profile, performing a significant level of R&D in the public sector and funding still more in other sectors. Sweden has a tradition, as has Ireland, of having very little R&D performed in the public sector; however, in
[image:24.595.118.460.233.481.2]Table 4 1999 Science & Technology Allocations (including earned income)
by Industry Objective
Information Scientific Education Technology Other Total 1998 & Specialist & Technical & Transfer Activities Outturn Advisory Services Services Training
Agency/ £'000 £'000 £'000 £'000 £'000 £'000 £'000
Department % activity % activity % activity % activity % activity % activity % change
FÁS 0 0 24,655 0 0 24,655 15,414
0% 0% 100% 0% 0% 100% 60%
Enterprise Ireland 2,462 8,873 1,157 3,810 964 17,266 16,654
14% 51% 7% 22% 6% 100% 4%
NSAI 0 11,515 0 0 0 11,515 10,057
0% 100% 0% 0% 0% 100% 14%
440 200 0 0 5,366 6,006 2,625
7% 3% 0% 0% 89% 100% 129%
Patents Office 2,797 0 0 0 270 3,067 3,260
91% 0% 0% 0% 9% 100% -6%
Teagasc 1,067 738 0 0 0 1,805 2,785
59% 41% 0% 0% 0% 100% -35%
Shannon 0 0 1,740 0 0 1,740 1,501
Development 0% 0% 100% 0% 0% 100% 16%
National
Microelectronics 0 0 0 0 970 970 969
Research Centre 0% 0% 0% 0% 100% 100% 0%
Forfás (inc. NAB) 0 482 0 0 0 482 459
0% 100% 0% 0% 0% 100% 5%
National
Microelectronics 84 42 42 31 31 230 214
Section 2 presented data on R&D across the whole public sector. In this section we look at other science and technology (S&T) activities, apart from R&D, which are performed in support of the productive sectors of the economy. The sectors considered are industry, agriculture,
environment, energy, transport and the marine & forestry areas.
3.1 Industry
Table 4 shows the S&T allocations (including earned income) to various government departments and agencies to support industrial activity. FÁS accounts for over a third of the total, providing industrial training programmes. The substantial increase in training expenditure by FÁS, 60% increase over 1998, reflects the Government’s commitment of investing in people to secure the economy’s future.
The necessity for such investment is emphasised, in the National Competitiveness Council report - ‘Annual Competitiveness Report 1998’, to ensure that human resources are sufficient to sustain competitiveness in the years ahead.
Enterprise Ireland accounts for about one quarter of the total, providing a range of services in industrial technologies for enterprises as well as aids to technology transfer through its Technology Transfer and Partnerships programme and the Technology Placements programmes (Techstart and Techman).
3. SCIENCE AND TECHNOLOGY FOR THE
PRODUCTIVE SECTORS
Table 4A 1999 Science & Technology Allocations (including earned income)
by Industry Objective
Information Scientific Education Technology Other Total 1998 and Specialist and Technical and Transfer Activities Outturn
Advisory Services Training Services
Agency/ e'000 e'000 e'000 e'000 e'000 e'000 e'000
Department % activity % activity % activity % activity % activity % activity % change
FÁS 0 0 31,305 0 0 31,305 19,572
0% 0% 100% 0% 0% 100% 60%
Enterprise Ireland 3,126 11,266 1,469 4,838 1,224 21,923 21,146
14% 51% 7% 22% 6% 100% 4%
NSAI 0 14,621 0 0 0 14,621 1,270
0% 100% 0% 0% 0% 100% 14%
559 254 0 0 6,813 7,626 3,333
7% 3% 0% 0% 89% 100% 129%
Patents Office 3,551 0 0 0 343 3,894 4,139
91% 0% 0% 0% 9% 100% -6%
Teagasc 1,355 937 0 0 0 2,292 3536
59% 41% 0% 0% 0% 100% -35%
0 0 2,209 0 0 2,209 1,906
0% 0% 100% 0% 0% 100% 16%
National
Microelectronics 0 0 0 0 1,232 1,232 1,230
Research Centre 0% 0% 0% 0% 100% 100% 0%
Forfás (inc. NAB) 0 612 0 0 0 612 583
0% 100% 0% 0% 0% 100% 5%
National
Microelectronics 107 53 53 39 39 292 272
Applications Centre 36% 18% 18% 14% 14% 100% 7%
Total 9,425 27,744 35,037 4,877 9,651 86,734 69,151
11% 32% 40% 6% 11% 100% 25%
Dept. of Enterprise, Trade &
Employment
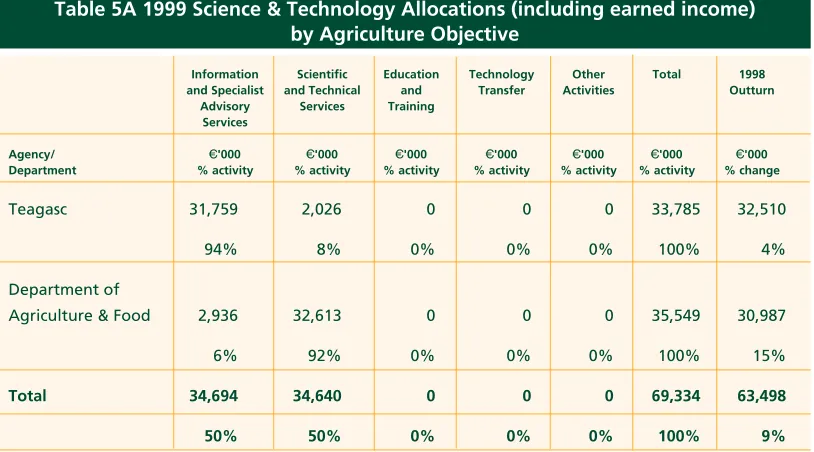
3.2 Agriculture
Table 5 shows the S&T allocations (including earned income) to government departments and agencies to support activities in the agriculture area. The major players here are the Department of Agriculture and Food (51%) and Teagasc (49%). The Department operates a number of veterinary laboratories, three dairy science laboratories, as well as
classification, testing and certification schemes in relation to meat and crop production. The major activity in Teagasc is an advice service to farmers at enterprise level.
Table 5 1999 Science & Technology Allocations (including earned income)
by Agriculture Objective
Information Scientific Education Technology Other Total 1998 and Specialist and Technical and Transfer Activities Outturn
Advisory Services Training Services
Agency/ £'000 £'000 £'000 £'000 £'000 £'000 £'000
Department % activity % activity % activity % activity % activity % activity % change
Teagasc 25,012 1,596 0 0 0 26,608 25,604
94% 6% 0% 0% 0% 100% 4%
Department of
Agriculture & Food 2,312 25,685 0 0 0 27,997 24,404
6% 94% 0% 0% 0% 100% 15%
Total 27,324 27,281 0 0 0 54,605 50,009
[image:27.595.62.469.525.751.2]50% 50% 0% 0% 0% 100% 9%
Table 5A 1999 Science & Technology Allocations (including earned income)
by Agriculture Objective
Information Scientific Education Technology Other Total 1998 and Specialist and Technical and Transfer Activities Outturn
Advisory Services Training Services
Agency/ e'000 e'000 e'000 e'000 e'000 e'000 e'000
Department % activity % activity % activity % activity % activity % activity % change
Teagasc 31,759 2,026 0 0 0 33,785 32,510
94% 8% 0% 0% 0% 100% 4%
Department of
Agriculture & Food 2,936 32,613 0 0 0 35,549 30,987
6% 92% 0% 0% 0% 100% 15%
Total 34,694 34,640 0 0 0 69,334 63,498
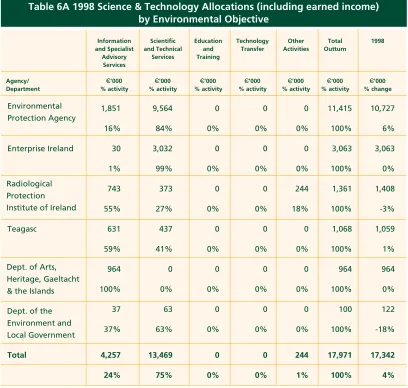
3.3 Environment
[image:28.595.87.495.226.600.2]Table 6 shows the science and technology allocations (including earned income) for activities broadly categorised as environment-related. The major components are the specialist advice, monitoring and laboratory services and other activities of the Environmental Protection Agency, as well as the technical services in environment management of Enterprise Ireland and Teagasc.
Table 6 1999 Science & Technology Allocations (including earned income)
by Environmental Objective
Information Scientific Education Technology Other Total 1998 and Specialist and Technical and Transfer Activities Outturn
Advisory Services Training Services
Agency/ £'000 £'000 £'000 £'000 £'000 £'000 £'000
Department % activity % activity % activity % activity % activity % activity % change
1,458 7,532 0 0 0 8,990 8,448
16% 84% 0% 0% 0% 100% 6%
Enterprise Ireland 24 2,388 0 0 0 2,412 2,412
1% 99% 0% 0% 0% 100% 0%
585 294 0 0 192 1,072 1,109
55% 27% 0% 0% 18% 100% -3%
Teagasc 497 344 0 0 0 841 834
59% 41% 0% 0% 0% 100% 1%
759 0 0 0 0 759 759
100% 0% 0% 0% 0% 100% 0%
29 50 0 0 0 79 96
37% 63% 0% 0% 0% 100% -18%
Total 3,353 10,608 0 0 192 14,153 13,658
24% 75% 0% 0% 1% 100% 4%
Environmental Protection Agency
Dept. of Arts, Heritage, Gaeltacht & the Islands
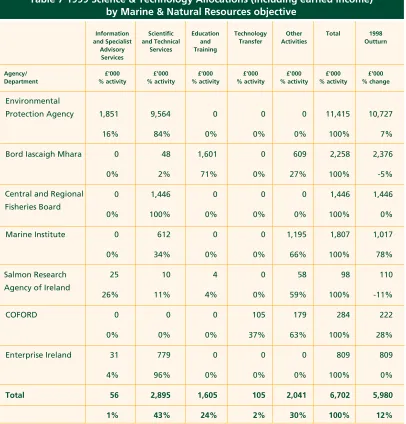
3.4 Marine and Forestry
Table 7 shows the science and technology allocations (including earned income) for activities in the marine, fisheries and forestry areas.
Education and training now accounts for 24% of the expenditure with the majority of the spending undertaken by An Bord Iascaigh Mhara. The Board's training programmes are geared to developing practical skills with respect to efficiency, safety, and management functions in order to support the maintenance and expansion of sustainable employment in sea fishing, aquaculture, processing and distribution. The Marine Institute are engaged in formulating a National Marine STI Policy and preparing a strategy to implement this policy.
Enterprise Ireland, in the forestry section, provides technical advice, consultancy services, training and assistance with new product and process development was provided to the Irish timber industry to identify opportunities for Irish timber and develop new
applications and standards. Environmental
Protection Agency
Dept. of Arts, Heritage, Gaeltacht & the Islands
[image:29.595.84.492.119.507.2]Dept. of the Environment and Local Government Radiological Protection Institute of Ireland
Table 6A 1998 Science & Technology Allocations (including earned income)
by Environmental Objective
Information Scientific Education Technology Other Total 1998 and Specialist and Technical and Transfer Activities Outturn
Advisory Services Training Services
Agency/ e'000 e'000 e'000 e'000 e'000 e'000 e'000
Department % activity % activity % activity % activity % activity % activity % change
1,851 9,564 0 0 0 11,415 10,727
16% 84% 0% 0% 0% 100% 6%
Enterprise Ireland 30 3,032 0 0 0 3,063 3,063
1% 99% 0% 0% 0% 100% 0%
743 373 0 0 244 1,361 1,408
55% 27% 0% 0% 18% 100% -3%
Teagasc 631 437 0 0 0 1,068 1,059
59% 41% 0% 0% 0% 100% 1%
964 0 0 0 0 964 964
100% 0% 0% 0% 0% 100% 0%
37 63 0 0 0 100 122
37% 63% 0% 0% 0% 100% -18%
Total 4,257 13,469 0 0 244 17,971 17,342
Central and Regional Fisheries Board
[image:30.595.124.530.159.583.2]Salmon Research Agency of Ireland
Table 7 1999 Science & Technology Allocations (including earned income)
by Marine & Natural Resources objective
Information Scientific Education Technology Other Total 1998 and Specialist and Technical and Transfer Activities Outturn
Advisory Services Training Services
Agency/ £'000 £'000 £'000 £'000 £'000 £'000 £'000
Department % activity % activity % activity % activity % activity % activity % change
Environmental
Protection Agency 1,851 9,564 0 0 0 11,415 10,727
16% 84% 0% 0% 0% 100% 7%
Bord Iascaigh Mhara 0 48 1,601 0 609 2,258 2,376
0% 2% 71% 0% 27% 100% -5%
0 1,446 0 0 0 1,446 1,446
0% 100% 0% 0% 0% 100% 0%
Marine Institute 0 612 0 0 1,195 1,807 1,017
0% 34% 0% 0% 66% 100% 78%
25 10 4 0 58 98 110
26% 11% 4% 0% 59% 100% -11%
COFORD 0 0 0 105 179 284 222
0% 0% 0% 37% 63% 100% 28%
Enterprise Ireland 31 779 0 0 0 809 809
4% 96% 0% 0% 0% 100% 0%
Total 56 2,895 1,605 105 2,041 6,702 5,980
3.5 Energy
Table 8 shows science and technology allocations (including earned income) for activities related to energy. The major element here is the energy technology promotion activities of the Irish Energy Centre in Enterprise Ireland. The Department of Marine and Natural Resources operate an Exploration and Mining Division and a Petroleum Affairs Division, which provides the technical expertise necessary for promotion, monitoring and controlling of petroleum exploration and development activities by private enterprise under licence to the Department.
Central and Regional Fisheries Board
[image:31.595.88.495.150.527.2]Salmon Research Agency of Ireland
Table 7A 1999 Science & Technology Allocations (including earned income)
by Marine & Natural Resources objective
Information Scientific Education Technology Other Total 1998 and Specialist and Technical and Transfer Activities Outturn
Advisory Services Training Services
Agency/ e'000 e'000 e'000 e'000 e'000 e'000 e'000
Department % activity % activity % activity % activity % activity % activity % change
Bord Iascaigh Mhara 0 61 2,033 0 773 2,867 3,017
0% 2% 71% 0% 27% 100% -5%
0 1,836 0 0 0 1,836 1,836
0% 100% 0% 0% 0% 100% 0%
Marine Institute 0 777 0 0 1517 2,294 1,291
0% 34% 0% 0% 66% 100% 78%
32 13 5 0 74 124 140
26% 11% 4% 0% 59% 100% -11%
COFORD 0 0 0 133 227 361 282
0% 0% 0% 37% 63% 100% 28%
Enterprise Ireland 39 989 0 0 0 1027 1,027
4% 96% 0% 0% 0% 100% 0%
Total 71 3,676 2,038 133 2,591 8,510 7,593
Department of Marine and Natural Resources
Department of Marine and Natural Resources
Table 8 1999 Science & Technology Allocations (including earned income)
by Energy objective
Information Scientific Education Technology Other Total 1998 and Specialist and Technical and Transfer Activities Outturn
Advisory Services Training Services
Agency/ £'000 £'000 £'000 £'000 £'000 £'000 £'000
Department % activity % activity % activity % activity % activity % activity % change
Enterprise Ireland 4,287 102 0 0 0 4,389 4,025
98% 2% 0% 0% 0% 100% 9%
822 166 0 0 18 1,006 568
82% 17% 0% 0% 2% 100% 77%
Total 5,109 268 0 0 18 5,395 4,593
[image:32.595.88.493.118.336.2]95% 5% 0% 0% 0% 100% 17%
Table 8A 1999 Science & Technology Allocations (including earned income)
by Energy objective
Information Scientific Education Technology Other Total 1998 and Specialist and Technical and Transfer Activities Outturn
Advisory Services Training Services
Agency/ e'000 e'000 e'000 e'000 e'000 e'000 e'000
Department % activity % activity % activity % activity % activity % activity % change
Enterprise Ireland 5,443 129 0 0 0 5,573 5,110
98% 2% 0% 0% 0% 100% 9%
1,044 211 0 0 23 1,277 721
82% 17% 0% 0% 2% 100% 77%
Total 6,487 340 0 0 23 6,850 5,832
3.6 Transportation
Table 9 shows science and technology allocations (including earned income) in support of national transportation objectives. The activity relates to the work of the National Roads Authority in planning and supervising the construction, improvement and maintenance of network of national roads. It amounts to £1.2m(e1.5m) overall.
National Roads Authority
National Roads Authority
Table 9 1999 Science & Technology Allocations (including earned income)
by Transportation
Information Scientific Education Technology Other Total 1998 and Specialist And Technical and Transfer Activities Outturn
Advisory Services Training Services
Agency/ £'000 £'000 £'000 £'000 £'000 £'000 £'000
Department % activity % activity % activity % activity % activity % activity % change
225 863 52 62 0 1,202 1,255
19% 72% 4% 5% 0% 100% -4%
Table 9A 1999 Science & Technology Allocations (including earned income)
by Transportation
Information Scientific Education Technology Other Total 1998 and Specialist And Technical and Transfer Activities Outturn
Advisory Services Training Services
Agency/ e'000 e'000 e'000 e'000 e'000 e'000 e'000
Department % activity % activity % activity % activity % activity % activity % change
286 1,096 66 79 0 1,526 1,594
The S&T Budget incorporates data relating to scientific and technological activities undertaken in a broader social context. The major components of this relate to educational and health activities.
Table 10 shows the science and technology allocations (including earned income) for education and training activities. S&T courses in the universities and institutes of technology are the major performers.
[image:34.595.85.492.361.637.2]The passing of the Scientific and Technological Education (Investment) Fund Bill 1997 has resulted in the establishment of a £250m(e317m) fund over 3 years, which will be used to develop technology education at all levels ranging from primary schools to advanced research. This Fund has led to significant increases in the level of education and training activity in both the Department of Education and Science (accounting for 22% of total 1999 allocation) and the Higher Education Authority (accounting for 7.5% of total 1999 allocation).
Table 10 1999 Science and Technology Allocations (including earned income) by
Education & Training objective
Information Scientific Education Technology Other Total 1998 and Specialist and Technical and Transfer Activities Outturn
Advisory Services Training Services
Agency/ £'000 £'000 £'000 £'000 £'000 £'000 £'000
Department % activity % activity % activity % activity % activity % activity % change
0 0 247,009 0 97 247,106 290,337
0% 0% 100% 0% 0% 100% -15%
0 0 179,450 0 47,544 226,994 194,144
0% 0% 79% 0% 21% 100% 17%
0 0 3,840 0 0 3,840 2,076
0% 0% 100% 0% 0% 100% 85%
50 30 0 0 471 551 480
9% 5% 0% 0% 85% 100% 15%
Total 50 30 430,299 0 48,112 478,491 487,037
0% 0% 90% 0% 10% 100% -2%
Dublin Institute for Advanced Studies Postgraduate Medical & Dental Board Higher Education Authority Department of Education & Science
Activities in the area of health are shown in Table 11. Science and technology activities in the Health sector are dominated by the activities of the Department of Health and Children. In the Department of Health and Children, the scientific and technical services of £4.6m(e5.8m) relates mainly to the activities of the Irish Medicines Board, which is self-funding from earned income and receives no public funds. The other departmental activities relate to the various health advisory functions it operates and to the National Cancer Registry Board.
Department of Education & Science
Higher Education Authority
[image:35.595.88.496.125.420.2]Postgraduate Medical and Dental Board
Table 10A 1999 Science and Technology Allocations (including earned income) by
Education & Training Objective
Information Scientific Education Technology Other Total 1998 and Specialist and Technical and Transfer Activities Outturn
Advisory Services Training Services
Agency/ e'000 e'000 e'000 e'000 e'000 e'000 £'000
Department % activity % activity % activity % activity % activity % activity % change
0 0 313,637 0 123 313,760 368,652
0% 0% 100% 0% 0% 100% -15%
0 0 227,854 0 60,368 288,223 246,512
0% 0% 79% 0% 21% 100% 17%
0 0 4,876 0 0 4,876 2,636
0% 0% 100% 0% 0% 100% 85%
63 38 0 0 598 700 609
9% 5% 0% 0% 85% 100% 15%
Total 63 38 546,367 0 61,090 607,558 618,409
0% 0% 90% 0% 10% 100% -2%
Radiological Protection Institute of Ireland Radiological Protection Institute of Ireland
Table 11 1999 Science & Technology Allocations (including earned income)
by Health Objective
Information Scientific Education Technology Other Total 1998 and Specialist and Technical and Transfer Activities Outturn
Advisory Services Training Services
Agency/ £'000 £'000 £'000 £'000 £'000 £'000 £'000
Department % activity % activity % activity % activity % activity % activity % change
Health Research 0 220 83 0 0 303 232
Board 0% 73% 27% 0% 0% 100% 31%
Dept. of Health & 4,001 4,580 0 0 14 8,595 7,602
Children 47% 53% 0% 0% 0% 100% 13%
332 332 0 0 112 775 694
43% 43% 0% 0% 14% 100% 12%
Total 4,333 5,132 83 0 126 9,673 8,528
[image:36.595.87.493.410.629.2]45% 53% 1% 0% 1% 100% 13%
Table 11A 1999 Science & Technology Allocations (including earned income)
by Health Objective
Information Scientific Education Technology Other Total 1998 and Specialist and Technical and Transfer Activities Outturn
Advisory Services Training Services
Agency/ e'000 e'000 e'000 e'000 e'000 e'000 e'000
Department % activity % activity % activity % activity % activity % activity % change
Health Research 0 279 105 0 0 385 295
Board 0% 73% 27% 0% 0% 100% 31%
Dept. of Health 5,080 5,815 0 0 18 10,913 9,652
& Children 47% 53% 0% 0% 0% 100% 13%
422 422 0 0 142 984 881
43% 43% 0% 0% 14% 100% 12%
Total 5,502 6,516 105 0 160 12,282 10,828
This area is concerned with science and technology activities undertaken by the
Government in support of regulatory and statutory activities. These are listed in Table 12.
The Office of Public Work’s capital allocations to buildings for S&T activities are also included. In line with the objective of the institutes classified in this area, almost 80% of the area’s activities are devoted to the provision of S&T services and technical information.
Table 12 1999 Science & Technology Allocations (including earned income) by
General Public Services Objective
Information Scientific Education Technology Other Total 1998 and Specialist and Technical and Transfer Activities Outturn
Advisory Services Training Services
Agency/ £'000 £'000 £'000 £'000 £'000 £'000 £'000
Department % activity % activity % activity % activity % activity % activity % change
Central Statistics 0 15,161 0 0 4,671 19,832 16,350
Office 0% 76% 0% 0% 24% 100% 21%
Ordnance Survey 0 10,206 0 0 1,015 11,221 9,764
0% 91% 0% 0% 9% 100% 15%
Met Eireann 4,991 4,599 240 95 633 10,559 9,888
47% 44% 2% 1% 6% 100% 7%
Office of Public Works 0 0 0 0 4,070 4,070 2,589
0% 0% 0% 0% 100% 100% 57%
State Laboratory 0 3,782 39 0 0 3,821 3,305
0% 99% 1% 0% 0% 100% 16%
0 2,836 0 0 0 2,836 2,390
0% 100% 0% 0% 0% 100% 19%
Forfás 973 0 0 0 0 973 866
100% 0% 0% 0% 0% 100% 12%
0 741 4 0 0 745 625
0% 99% 1% 0% 0% 100% 19%
100 100 0 0 34 233 181
43% 43% 0% 0% 15% 100% 29%
Total 6,064 37,424 283 95 10,424 54,290 45,958
11% 69% 1% 0% 19% 100% 18%
Geological Survey of Ireland
Dept. of the Environment & Local Government
Radiological Protection Institute ofIreland