Journal of Chemical and Pharmaceutical Research, 2013, 5(12):548-552
Research Article
CODEN(USA) : JCPRC5
ISSN : 0975-7384
Evaluation of the groundwater active recharge trend in the coastal plain of
Dar es Salaam (Tanzania)
Giuseppe Sappa*, Flavia Ferranti, Sibel Ergul and Giancarlo Ioanni
Department of Civil, Building and Environmental Engineering, Sapienza - University of Rome,
Via Eudossiana, Rome, Italy
_____________________________________________________________________________________________
ABSTRACT
This paper deals with a part of the preliminary results of three years investigation activity, carried in Dar es Salaam coastal plain (Tanzania), ACC-DAR project, supported by the European Union, in cooperation with Sapienza University of Rome and Ardhi University of Dar es Salaam. Here, they are presented the effects of rainfall data evolution in the last 50 years on the groundwater active recharge, due to land cover evolution. As a matter of fact, in the last fifteen years the Dar es Salaam coastal plan has been involved in a hard increasing of groundwater exploitation, due to increased population. On the on the hand, the groundwater active recharge has been decreased, due to the evolution of land cover. In the framework of the project, the rainfall data have been collected referred to 50 years of observations in the three urban stations of Dar es Salaam. Starting from the data collection of the continuous historical rainfall series, it has been evaluated the groundwater active recharge for different land cover scenarios from remote sensing data. The results have been compared to water demand evolution values, referred to the same temporal range, and it has been outlined that in the last few years the water demand, in this area, has overpassed the groundwater active recharge.
Keywords: Tanzania, groundwater recharge, climate changes, water demand
_____________________________________________________________________________________________
INTRODUCTION
The present study is related to the application of the reverse water balance technique (P = ET + R + I) [1] in order to determine the active average recharge (I) of the aquifer in the coastal plain of Dar es Salaam (Tanzania). The management of the large available quantity of figures asked the application of a Geographical Information System (ESRI ArcGIS10), to set up a distributed parameters mathematical model.
The United Republic of Tanzania is a country in Sub-Saharan Africa and Eastern Europe. It borders the Kenya to the North and the Uganda, Rwanda, Burundi and the Democratic Republic of the Congo to the West while the Zambia, Malawi and Mozambique to the South. The area under study covers all the urban and the periurban zones of Dar es Salaam and it is selected starting from the natural hydrogeological boundaries. The geological setting of the study area comprises unconsolidated sediments, which are classified by their geological age into two major periods: Quaternary and Neogene deposits [2]. The Quaternary deposits consist of three geological layers: alluvial, coastal plain and coral reef limestone deposits (Fig. 1).
elaboration of the rainfall data (from 1960 – 2010) in order to assess the active recharge of the aquifer system in coastal plain of Dar es Salaam (Tanzania).
Fig. 1: The study area ([3] modified)
EXPERIMENTAL SECTION
They were available 50 years of rainfall observation (1960 - 2010), related to three different stations (Jnia, Wazohill, Ocean Road), and so all these data have been adapted to certain probability distributions (Fig. 2).
Fig. 2: Rainfall data for the three different urban stations of Dar es Salaam
0 2 4 6 8 10 12 14
0
100200300400 500600 700800 9001000110012001300140015001600170018001900200021002200 Frequency Classes
0 0,05 0,1 0,15 0,2 0,25
0 500 1000 1500 2000 2500
Precipitations (mm)
f(
x
)
[image:3.595.183.431.555.749.2]JNIA OCEAN WAZO
Fig. 3: Gaussian distribution
Consequently, they have been chosen the rain values, referring to one with 70% of probability of happening (Tab. 1).
Tab. 1: 70% probable annual rainfall data
Jnia µ+σ 1410,6 mm
µ−σ 854,2 mm
Ocean Road µ+σ 1249,9 mm
µ−σ 801,2 mm
Wazohill µ+σ 1091,9 mm
µ−σ 727,8 mm
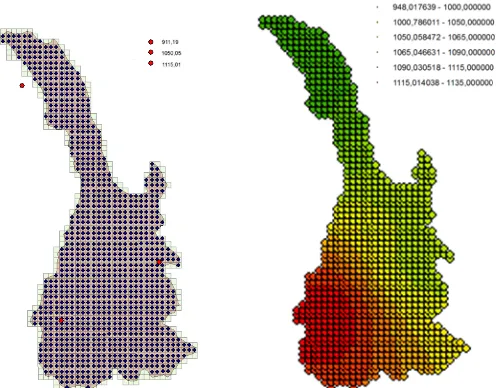
The Inverse Distance Weighting (IDW) method, which is a deterministic one for multivariate interpolation, starts from a known scattered set of point data, in order to spread them on an area (Fig. 4). In this aim the area under study has been divided in meshes of 500 mt of dimension.
RESULTS AND DISCUSSION
Over the last ten years, the changes of the area have seen a significant growth of discontinuous and continuous urban land [5]. In the course of time, the consequences of this transformation have influenced the recharge areas extension, and groundwater active recharge have been decreased (Fig. 5).
2002 2011
Fig. 5: Land cover distribution in 2002 and 2011
The graph shows (Fig. 6) the changes concerning the land cover between the 2002 and the 2011. It is important to underline that the percentage of continuous urban soil doubled over less than ten years.
Class Land Cover 2002
Soil 48%
Vegetation 10% Continuous
Urban 27%
Discontinuous Urban
15%
Class Land Cover 2007
Soil 29%
Vegetation 13% Continuous
Urban 35% Discontinuous
Urban 23%
Class Land Cover 2011
Soil 29%
Vegetation 6% Continuous
Urban 43% Discontinuous
Urban 22%
Fig. 6: Land cover distribution from 2002 to 2011
The assignment of the potential infiltration factor χχχχs let us to separate the infiltration from rainfall, taking in account
runoff and evapotranspiration, which do not contribute to the active recharge (Tab. 2).
Tab. 2: Potential Infiltration Factor referred to the different land cover class
Land Cover Class Potential Infiltration Factor ((((χχχχs)
Continuous Urban 0,1 Discontinuous Urban 0,2
Vegetative 0,3
By this way for each mesh it has been calculated the volume of recharge, through the multiplication of the rainfall
(mm) by the factor χs (-) and the area (m2). Adding up all the mesh values, the resulting volume has been compared
[image:5.595.197.420.118.273.2]with the annual water demand (Fig. 7).
Fig. 7: Annual recharge compared with water demand
According to land cover changing the volume of water is decreased from 2002 to 2011. The bar graph (Fig. 8) shows that the volume of groundwater active recharge in Dar Es Salam coastal plan has decreased by almost 5% for each year.
Fig. 8: Volume trend from 2002 to 2011
It true, on the other hand that part of groundwater active recharge in the coastal plan comes form Pugu Hills, but it will be necessary, all the same, to stop the groundwater exploitation, due to new building construction, to reverse the nowadays trend of budget between demand and recharge.
REFERENCES
[1] M Civita; M De Maio. Average ground water recharge in carbonatic aquifers: a GIS processed numerical model, 7th Conf. on Limestone Hydrology and Fissured Media, Besançon, 20-23 sept.2001, 2001, 93-100
[2] IC Mjemah. Hydrogeological and Hydrogeochemical Investigation of a Coastal Aquifer in Dar es Salaam, Tanzania. Ph.D. Thesis, Ghent University, Ghent, 2007.
[3] P Temple. Aspects of the geomorphology of the Dar es Salaam area. Tanzania Notes and Records 71, 1970, 21-54.
[4] K Msindai. Engineering geological aspects of soils and rocks in the Dar es Salaam region, Tanzania. Publications of the University of Turku, Academic Press, Helsinki, 1988.
[image:5.595.166.448.325.440.2]