Journal of Chemical and Pharmaceutical Research
__________________________________________________
ISSN No: 0975-7384 CODEN(USA): JCPRC5
J. Chem. Pharm. Res., 2010, 2(3):467-472
UV-Spectrophotometric estimation of Diacerein in pharmaceutical formulation
Krishna R Gupta*, Varun E Samrit, Vivek S Thakur and A. T. Hemke
Department of Pharmaceutical Chemistry, S.K.B. College of Pharmacy, Nagpur, M.S. India
______________________________________________________________________________
ABSTRACT
Three simple, precise and economical UV methods have been developed for the estimation of Diacerein in Pharmaceutical Formulations. Diacerein has the maximum absorbance at 256.2 nm in zero order spectra formed the basis for method A while first order derivative spectrum showed peak at 250.0 nm when n = 1 for method b and method C applied was Area under Curve
(AUC) in wavelength range of 262.0-250.0 nm.. Method A utilises A1%, 1cm value at λmax for
its analysis. Calibration curve (Regression equation) was used for method B and C for analysis of Diacerein respectively. Drug was found to obey the Beer-Lambert’s law in the concentration range of 5-30µg/mL in all three proposed methods. Results of the analysis were validated statistically and by recovery studies. Results were found to be satisfactory and can be adopted for routine analysis of the drug.
Keywords: Diacerein, UV spectroscopy, Derivative spectroscopy and Area under Curve.
______________________________________________________________________________
INTRODUCTION
attempt has been made to develop new UV methods for its estimation in pharmaceutical formulation with good accuracy, simplicity, precision and economy.
EXPERIMENTAL SECTION
Materials and Methods
A Shimadzu UV 1700 series Spectrophotometer was used with 1 cm matched quartz cells.
Preparation of Standard Solution
An accurately weighed quantity of diacerein (~25mg) was dissolved in appropriate quantity of N,N-dimethylacetamide (DMA) and transferred in a 50.0 mL volumetric flask, then volume was made up with methanol up to the mark to get standard stock solution of concentration 500µg/mL. A standard stock solution was further diluted with methanol to get final solution of concentration 20µ g/mL.
Spectral Scanning and Wavelength Selection
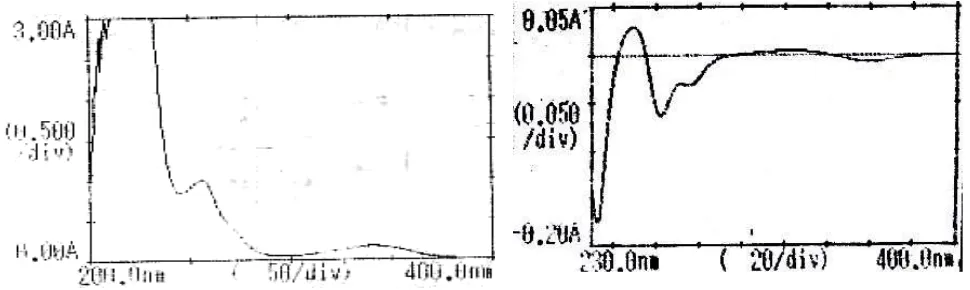
The standard solution of diacerein (20µg/mL) was scanned in the range of 400-200nm (Method A) in 1.0 cm cell against solvent blank and spectra was recorded, the absorbance maximum was observed at 256.2.0 nm (Figure 1). The First derivative spectra at n = 1 (method B) showed a sharp peak at 250.0 nm (Figure 2). The absorbance difference calculated at n=1 (dA/dλ) is
calculated by the inbuilt software of the instrument which was directly proportional to the concentration of the standard solutions. The calibration curve of dA/dλ against concentration of
the drug showed linearity, which are used for the estimation of the drug. The AUC (Area under Curve) method (method C) involves the calculation of integrated value of absorbance with respect to the wavelength λ1 and λ2. Area calculation processing item calculates the area bound
[image:2.595.42.527.508.653.2]by the curve and the horizontal axis. The horizontal axis was selected by entering the wavelength range over which the area has to be calculated. The wavelength range from 262.0- 250.0 nm was selected which showed good linearity between area under curve and concentration.
Figure 1 Spectrum of Diacerein Figure 2 Derivative first order Spectrum
Construction of Calibration Curve
absorbance vs concentration (method A), differential absorbance vs concentration (method B) and area under curve against concentration (Method C). The optical characteristics are recorded in Table I
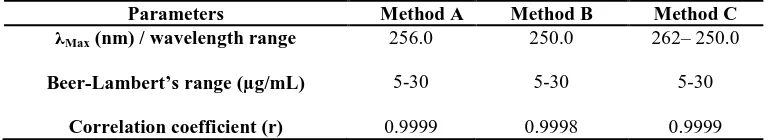
Table I: Optical Characteristics
Parameters Method A Method B Method C λMax (nm) / wavelength range
Beer-Lambert’s range (µg/mL)
Correlation coefficient (r)
256.0
5-30
0.9999
250.0
5-30
0.9998
262– 250.0
5-30
0.9999
Assay
An accurately weighed quantity of tablet powder equivalent to about 25 mg diacerein was transferred to 50.0 mL volumetric flask. To it appropriate quantitiy of DMA and methanol was added, sonicated for 15 min and diluted up to the mark with methanol. The contents of the flask was then filtered through Whatmann filter paper (no. 41) & was further diluted with methanol to get final solution of concentration 20µ g/mL (on label claim basis). The absorbance of the resultant solution was read and the amount of diacerein was calculated by taking A (1%, 1cm) at 256.2.0 nm (method A), by first order derivative absorbance at 250.0 nm (method B) and by Area under Curve (AUC) (method C). Calculation was done by using following formulae for method A and for method B and C were done by using calibration curve and regression equation.
Method A
Absorbance × Dilution factor × Avg wt
% of labelled = --- × 100 Claim A (1%, 1cm) × wt.taken × Label claim
The results of estimation of diacerein are shown in Table II
Table II: Results of estimation in tablet formulation
Method Tablet Formulation % Label Claim (±)S. D.* C.V.*
A D1
D2
100.16 ±0.86 100.97 ±0.42 100.88 ±0.17 100.59 ±0.05 99.22 ±0.42 101.55 ±0.23
0.86 0.41
B D1
D2
0.17 0.05
C D1
D2
0.42 0.22
Where, A is zero order derivative spectrum method, B is first order derivative method with n = 1, C is the AUC method , D1 and D2 are two different brands of tablet formulations.
* The results are the mean of five readings (n = 5).
Validation [6,7]
i) Accuracy (Recovery Studies)
[image:4.595.101.496.234.292.2]Accuracy was ascertained on the basis of recovery studies by standard addition method. Recovery studies were carried out at four different levels by adding the pure drug (5.04, 10.08, 15.12 and 20.16 mg) to previously analyzed tablet powder sample. From the amount of drug found, percentage recovery was calculated. The recoveries of the drug were observed to be very close to 100 % representing the accuracy of the method and also show that excipients have no interference in the estimation. Results are recorded in Table III.
Table III: Recovery Study Data
Statistical Parameter Method A Method B Method C
Mean ±SD CV 99.15 0.78 0.79 99.55 1.38 1.38 98.98 0.45 0.45
Where,A is zero order derivative spectrum method with n = 0, B is first order derivative method with n = 1, C is the AUC method. The results are the mean of triplicate at each level of recovery
ii) Precision
Precision of analytical method is expressed in terms of SD, % RSD of series of measurements. Study was carried out by replicate analysis of homogeneous samples of tablet powder. Results were recorded in Table II.
iii) Intraday Precision and Inter-day precision
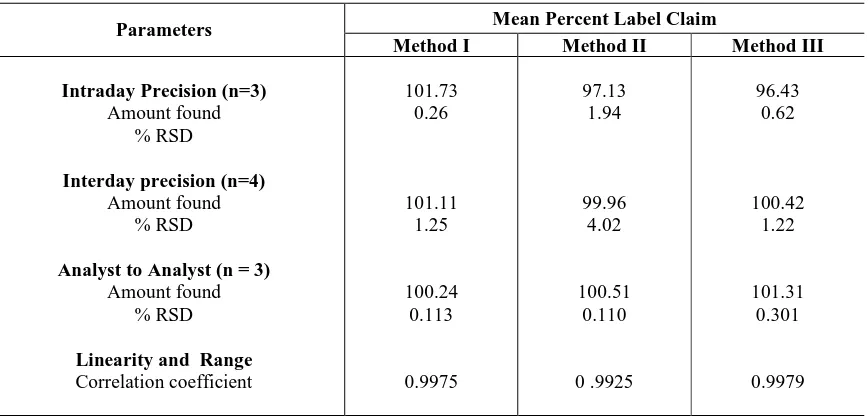
An accurately weighed quantity of tablet powder equivalent to about 25 mg was diluted to get the final concentration 10 µg/mL on label claim basis. The absorbencies and area of the solutions were taken at an interval of 3h within the day at selected wavelengths for intraday study for all the three methods. Similarly the same solution was measured on 1th, 4th, 7th and 14th day. Percent label claim was calculated. The results are recorded in Table IV.
Table IV: Summary of validation parameters
Parameters Mean Percent Label Claim
Method I Method II Method III
Intraday Precision (n=3)
Amount found % RSD
Interday precision (n=4)
Amount found % RSD
Analyst to Analyst (n = 3)
Amount found % RSD
Linearity and Range
[image:4.595.86.520.520.730.2]iv) Linearity and Range
Accurately weighed quantity of tablet powder equivalent to 80, 90, 100, 110, 120% of label claim of diacerein were taken and dilutions were made as described under assay. The absorbance and area of the resulting solutions were measured at selected wavelengths respectively against blank. The graphs of concentration Vs absorbance were plotted and were found to be linear.
v) Ruggedness
The studies were carried out for analyst to analyst variation. The tablet samples were analyzed by proposed method by three different analysts and results were recorded in Table IV.
vi) Stability studies:
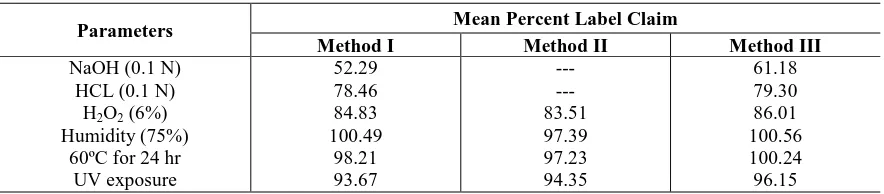
The forced degradation studies of diacerein were carried out for the following conditions:
-Acidic hydrolysis (0.1N HCL) -Alkaline hydrolysis (0.1N NaOH)
-H2O2 (6%) -Humidity (75%) -60ºC for 24 hr -UV exposure
[image:5.595.78.520.382.479.2]After the specified period of exposure the samples were diluted as described under assay procedure and the percent label claim was analysed by all the proposed methods. The results of estimation are shown in Table V
Table V: Results of estimation for stability studies
Parameters Mean Percent Label Claim
Method I Method II Method III
NaOH (0.1 N) HCL (0.1 N)
H2O2 (6%)
Humidity (75%) 60ºC for 24 hr
UV exposure
52.29 78.46 84.83 100.49
98.21 93.67
--- --- 83.51 97.39 97.23 94.35
61.18 79.30 86.01 100.56 100.24 96.15
RESULTS AND DISCUSSION
CONCLUSION
From the above studies it can be concluded that the UV spectrophotometric methods for quantitative estimation of Diacerein in marketed formulation are quite reliable, accurate and precise and can be adopted for routine analysis of the drug.
Acknowledgements
The authors are thankful to Alkem Pharmaceutical Ltd. for providing standard drug samples and also to S.K.B.College of Pharmacy, Kamptee for providing the facilities to carry out the work.
REFERENCES
[1] The Merck Index, 13th ed., 2001 published by Merck research Lab, Whitehouse, NJ; monograph no. 9398, 2979
[2] Martindale “The Extra Pharmacopoeia” 32ndEdn. 1999, ed. by Kathleen Parfeet, Pharmaceutical Press, London, UK, 29.3,1210.3
[3] V Giannellini, F Salvatore, G Bartlucci SA Coran and M Bambagiotti-Alberti, J. Pharm
Biomed Anal, 2005, 39(3-4):776-780
[4] N Kannappan, A Madhukar, R Srinivasan, RLA Srinivas, CH Naveen Kumar, R Mannavalan
International Journal of ChemTech Research, 2010, 2:143-148.
[5] SH Borgmann., LM Parciananello, MZ Arend and SG Cardoso , Pharmazie, 2007, 62(7): 483-485.
[6] James F/F R, Martindale, “The Extra Pharmacopoeia”, 33thed, Pharmaceutical Press, London, UK, 1229.