Serum Calcium Levels in Correlation with Glycated
Hemoglobin in Type 2 Diabetic Sudanese Patients
Safaa Abed ELRahman Hassan
1, Wigdan Abdel Rahman Elsheikh
2, Nazik Ibrahim Abdel Rahman
3,
Nabiela M. ElBagir
4,*1College of Science, University of Khartoum, Sudan
2Department of Internal Medicine, Faculty of Medicine, AlzaeemAlazhary University, Sudan 3Department of Family Medicine, Faculty of Medicine, AlzaeemAlazhary University, Sudan 4Department of Biochemistry, Faculty of Veterinary Medicine, University of Khartoum, Sudan
Copyright©2016 by authors, all rights reserved. Authors agree that this article remains permanently open access under the terms of the Creative Commons Attribution License 4.0 International License
Abstract
The present work is a cross-sectional study aimed to evaluate the serum levels of calcium and Glycated Hemoglobin (HbA1c) of (40) patients with type 2 diabetes mellitus, attending Center clinic in Khartoum North- Sudan, and (40) apparently healthy (non-diabetic) volunteers as control group. Age and sex of the test group were matched with the control group. Serum levels of calcium were measured by auto analyzer Bs-200 (instruments and reagents from Mindray Company) and HbA1c amount was measured by CERA-STAT TM 4000 Analyzer (reagents and instruments from Ceragem Medisys Company). Data was analyzed using SPSS. The results showed a significant reduction in the mean of serum calcium level of the diabetic group when compared with the control group (p value <0.05), whereas HbA1c was increased in diabetic patients (type 2) compared to the control group (p. value <0.05). However there was a good negative correlation between the serum calcium levels and HbA1c in diabetic patients. The results revealed that the increase in HbA1c, in diabetics of type 2 diabetes mellitus, is accompanied by a significant decrease in calcium serum levels, so uncontrolled diabetic patients are at risk of hypocalcaemia compared to controlled patients. This effect was not influenced by gender or duration of diabetes in the studied group.Keywords Diabetes Mellitus, Calcium, Glycated
Hemoglobin1. Introduction
Diabetes mellitus is a global epidemic disease that affects more than 150 million people worldwide. It is estimated that global number of adults suffering from all forms of diabetes will reach 439 million in 2030; most of them type 2 diabetes mellitus cases. Diabetes mellitus is a major cause of morbidity and mortality [1].The term diabetes mellitus
describes a metabolic disorder of multiple etiologies characterized by chronic hyperglycemia with disturbances of carbohydrate, fat and protein metabolism resulting from defects in insulin secretion, insulin action, or both. The long-term effects of diabetes mellitus include progressive development of the specific complications of retinopathy, nephropathy, and neuropathy [2]. The complications of diabetes mellitus are far less common and less severe in people who have well- controlled blood sugar levels [3].The Diabetes Control and Complications Trials (DCCT) and the United Kingdom Prospective Diabetes Studies (UKPDS) demonstrated conclusively that risks for complications are related directly to glycemic control, as measured by glycated hemoglobin (HbA1c).
Hemoglobin A1c (HbA1c) is used routinely to monitor long-term glycemic control in people with diabetes mellitus, as HbA1c is related directly to risks for diabetic complications [4]. It is an indicator of average blood glucose concentration over the period of 2-3 months [5]. The test HbA1c does not change with any recent changes in diet, exercise, or medicines [6].
Hough [7] stated that involvement of the skeletal system must be regarded as yet another complication of diabetes. Diabetes may influence the bone in multiple pathways, some with contradictory effects. These mechanisms include changes in insulin and insulin-like growth factors levels, hyper calciuria associated with glycosuria, obesity, higher concentrations of advanced glycation end-products in collagen etc. Along these lines, many cohort studies undeniably indicated that diabetes itself is associated with increased risk of osteoporosis [8].
controlled by the parathyroid hormone (PTH) and vitamin D at the expense of the skeleton when dietary calcium intake are inadequate [9]. PTH secretion in blood is stimulated by a decrease in ionized Ca2+ and conversely PTH secretion is stopped by an increase in ionized Ca2+. In the bone, PTH activates a process known as bone resorption, in which activated osteoclasts break down bone and subsequently release Ca2+ into the serum [10]. Sultan et al [11] have shown that the reduction in serum calcium level in type2 diabetes mellitus is most probably due to hyperglycemia which increases calcium and phosphorus excretion in urine which is proportional to the degree of glucosuria, hypercalciuria by osmotic diuresis caused stimulation of bone resorption caused by secondary hyperparathyroidism. In response to urinary calcium loss, PTH secretion is mildly but significantly stimulated to maintain serum calcium concentrations. Excess urinary calcium seems to be derived from bone [12].
This study aimed to evaluate the levels of serum calcium and HbA1c in Sudanese patients with type2 diabetes mellitus and to investigate the correlation between the two parameters. This is to demonstrate how the control of diabetes can influence calcium levels in diabetic Sudanese patients.
2. Materials and Methods
2.1. Research Design
This is a cross-sectional study. It was carried out in Khartoum North clinic center, during the period from April to December 2015.
Study Population
The main target population of this study is Sudanese patients with type2 diabetes mellitus. The whole study size was eighty individuals, forty diabetic patients as test group 20 females and 20 males, attending the clinic center for routine checkup and other 40 normal healthy (non- diabetic) as control group, they were also 20 females and 20 male subjects. All subjects employed in this work were adults and their age ranged between (36 -77) years. Age was matched in all groups.
Inclusion /exclusion criteria
Sudanese diabetic patients, with type 2 diabetes mellitus attending the clinic center for routine checkup and with disease duration of about 10 years, were included as test group. Diabetic Patients were excluded if they have renal impairment, coronary heart diseases, parathyroid gland diseases and gestation. For exclusion criteria clinical data was obtained from patients’ medical records confirmed by a specialized physician. Healthy Sudanese volunteers were included in the study as control group.
Ethical Consideration
Ethical clearance was obtained from the Sudanese Ministry of Health. The objectives of the study were explained to all individuals participating in the study, and all participants gave informed consent.
2.2. Data Collection and Clinical Assessment Interview and a Questionnaire
Interviews with the test group and the control group were done to obtain data, which was used for matching the groups. Questionnaire designed specifically to obtain information which help in either including or excluding certain individuals in or from the study. The clinical data was obtained from patients medical records which were confirmed by a specialized physician.
Blood Sampling
After informed consent, about 5 ml of venous blood were collected from each participant; the blood withdrawal was followed national requirements. Then was divided into two portions, the first one was placed in EDTA container and used for HbA1c analysis. The other portion was cleared by speed centrifugation, after separation the serum samples were used for calcium analysis. Blood samples were collected from all patients at the early morning.
Biochemical Measurements
Serum calcium level was measured using commercial reagent kits from Mindray Company, HbA1c percentage was measured using commercial reagent kits from Ceragem Medisys Company. Auto analyzer (Bs-200 from Midray-China) was used in this study for serum calcium measurement. CERA-STAT ™ 4000 analyzer was used to measure HbA1c.
3. Methodology
Serum calcium estimation
Reaction Principle: Calcium + Arsenazo III a blue colored complex
By using 8-hydroxyquinoline-5-sulfonic acid to eliminate the interference of magnesium, calcium ions combine with Arsenazo III to produce a blue colored complex at a neutral solution. The absorbency increase is directly proportional to the concentration of calcium.
Procedure
Blank Sample
Reagent 1ml 1ml
D. W 0.01ml
Sample 0.01ml
Standard curve of calcium measurement
Calculations
The analyzer calculated the Ca concentration of each sample automatically after calibration.
Linearity
This method is linear up to 15 mg/dl. Measurement of HbA1c
Principle
The CERA-STAT TM 4000 is a boronate affinity assay. The CERA- STATTM HbA1c Test Kit consists of the test device, the R1/Reagent and the R2/Reagent. The R1/Reagent contains the agents that lyse erythrocytes and precipitate hemoglobin specifically, as well as a blue boronic acid conjugate that binds cis-diol of glycated hemoglobin. When blood is added to the R1/Reagent, the erythrocytes are lysed and all hemoglobin precipitates, as well as the boronic acid conjugate binds to the cis-diol configuration of glycated hemoglobin. An aliquot of the reaction mixture was added to the test device and all the precipitated hemoglobin, conjugate-bound and unbound, remained on top of the filter. Any unbound boronate was removed with the R2/Reagent. The precipitate was evaluated by measuring the blue (glycated hemoglobin) and the red (total hemoglobin) color intensity respectively with the CERA-STAT TM 4000 Analyzer, the ratio between them being proportional to the percentage of glycated hemoglobin in the sample.
Procedures
First the sample was prepared by adding 5µl whole blood to the test tube with R1/Reagent. The contents of the tube were mixed well and left standing for 2 minutes. The test tube was then shaken once again, and 25µl of the mixture
was applied to the cartridge of the test device, left for 10 seconds to allow the applied sample to soak enough into the membrane. When the sample was absorbed completely, 25µl of the R2/Reagent was applied to the test device and the sample was allowed to soak into the membrane for about 10 seconds. After complete absorption, the test device was placed on the tray, and “Analyze” was selected on the display of the CERA-STAT ™ 4000 Analyzer. Then the tray was inserted into the CERA-STAT ™ 4000 Analyzer. The test result was read within 7 seconds.
Calculation
The test result was obtained immediately within 7 seconds Linearity
This method is linear up to 15%. Quality Controls
The precision and accuracy of all methods used in this study were checked using commercially prepared control sera.
StatisticalAnalysis
The statistical analysis was performed with a personal computer using the statistical package for social science (SPSS), (t-test for mean and p. value for significance).
4. Results
0.001 as shown in table (1).
Table 1. Comparison between the mean of serum calcium levels in diabetic group and control group.
Variable
Diabetic Control group
p. value
No = 40 No =40
Mean ± S.E.M Mean ± S.E.M Serum Ca (mg/dL) 8.87 ± 0.08 9.51 ± 0.07
***
Range (7.5 – 10.6) (9 – 11.5)
The table shows the mean± S.E.M, range in brackets and probability (p.). T-test was used for comparison.
P. value ≤ 0.05 is considered to be significant. *** p<0.001
[image:4.595.311.555.98.174.2]HbA1c level was found to be higher in test group compared to control group with p. value < 0.001 as shown in table (2).
Table 2. Comparison between the mean of HbA1c levels in diabetic group and control group.
Variable
Diabetic Control group
p. value
No = 40 No = 40
Mean ± S.E.M Mean ± S.E.M HbA1c (%) 7.48 ± 0.27 4.88 ± 0.09
***
Range (3.5 – 10.9) (3.7 – 6.4)
The table shows the mean± S.E.M, range in brackets and probability (p.). T-test was used for comparison.
P. value ≤ 0.05 is considered to be significant. *** p<0.001
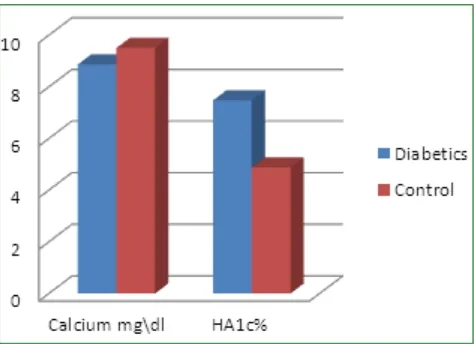
[image:4.595.58.299.119.194.2]Figure 1. represents the effect of diabetes mellitus type2 on serum calcium levels and the HbA1c% in forty Sudanese patients compared to their matched control. The figure showed the lower level of serum calcium and the higher HbA1c% in the diabetic patients.
Figure 1. The effect of type2 diabetes on Calcium level and Hb1c% in Sudanese patients.
Within males serum calcium level was found to be lower in test group compared to control group with p. value < 0.001, whereas HbA1c level was found to be higher in male patients compared to their control group with p. value < 0.001 as shown in table (3).
Table 3. Comparison of serum calcium levels and HbA1c between diabetic group and control group in males.
Variables
Diabetic Control group
p. value
No = 20 No = 20
Mean ± S.E.M Mean ± S.E.M Serum Ca (mg/dL) 8.71 ± 0.19 9.69 ± 0.11 ***
HbA1c (%) 7.39 ± 0.42 4.85 ± 0.10 ***
The table shows the mean ± S.E.M and probability (p.). T-test was used for comparison.
P. value ≤ 0.05 is considered to be significant.*** p<0.001.
In females also serum calcium level was found to be lower in the patients compared to their control group with p. value < 0.01, whereas, HbA1c level was found to be higher in the diabetic female group compared to their control group with p. value < 0.001 as shown in table (4).
Table 4. Comparison of serum calcium levels and HbA1c between diabetic group and control group in females.
Variables
Diabetic Control group
p. value
No = 20 No = 20
Mean ± S.E.M Mean ± S.E.M Serum Ca (mg/dL) 8.91 ± 0.12 9.34 ± 0.07 **
HbA1c (%) 7.43 ± 0.37 4.93 ± 0.16 ***
The table shows the mean ± S.E.M and probability (p.). T-test was used for comparison.
P. value ≤ 0.05 is considered to be significant. ** p<0.01 and *** p<0.001.
[image:4.595.312.551.303.378.2]When patients were compared as males and females, no significant difference in serum calcium levels was seen between males and females in diabetic groups, (p. value > 0.05=0.70) as shown in table 5
Table 5. Comparison between the mean of serum calcium levels in males and females in diabetic group.
Variable
Males Females
p. value
No = 20 No = 20
Mean ± S.E.M Mean ± S.E.M Serum Ca (mg/dL) 8.84 ± 0.11 8.91 ± 0.12 0.70 The table shows the mean ± S.E.M and probability (p.).
T-test was used for comparison.
P. value ≤ 0.05 is considered to be significant.
There are no significant difference in HbA1c levels between males and females as diabetic groups (p. value > 0.05 =0.88) as shown in table 6
Table 6. Comparison between the mean of HbA1c levels in males and females in diabetic group.
Variable
Males Females
p. value
No = 20 No =20
Mean ± S.EM Mean ± S.E.M
HbA1c (%) 7.39 ± 0.42 7.48 ± 0.37 0.88
The table shows the mean ± S.E.Mand probability (p.). T-test was used for comparison.
[image:4.595.57.298.303.370.2] [image:4.595.59.296.477.649.2] [image:4.595.311.554.494.557.2] [image:4.595.314.554.660.722.2]Serum calcium level showed significantly (p. value <0.05) lower level in females compared to males in the control group, as shown in table (7).
Table 7. Comparison between the mean of serum calcium levels in males and females in control group.
Variable
Males Females
p. value
No = 20 No = 20
Mean ± S.E.M Mean ± S.E.M Serum Ca (mg/dL) 9.69 ± 0.11 9.34 ± 0.01 * The table shows the mean ± S.E.M and probability (p.).
T-test was used for comparison.
P. value ≤ 0.05 is considered to be significant.*p<0.05
[image:5.595.57.298.308.370.2]Whereas, no significant difference in HbA1c levels between males and females in control group was seen (p. value > 0.05 =0.68) as shown in table 8
Table 8. Comparison between the mean of HbA1c levels in males and females in control group.
Variable
Males Females
p. value
No = 20 No =20
Mean ± S.E.M Mean ± S.E.M
HbA1c (%) 4.85 ± 0.10 4.93 ± 0.16 0.68
The table shows the mean ± S.E.M and probability (p.). T-test was used for comparison.
P. value ≤ 0.05 is considered to be significant.
Serum calcium levels have a good negative correlation with HbA1c levels in diabetic group. (r = - 0.56, p. value = 0.00) as shown in table (9).
Table 9. Correlation between the serum calcium levels and HbA1c levels in diabetic group.
Variable Statistics HbA1c %
Calcium mg/dL Person correlation -0.56
**
p. value 0.00
**Correlation is significant at the 0.01 level.
Whereas, serum calcium levels have (no significant) negative correlation with the duration of diabetes in diabetic group. (r= -0.18, p. value = 0.27) as shown in table (10). Table 10. Correlation between the serum calcium levels and duration of diabetes in diabetic group.
Variable Statistics Duration of disease (years)
Calcium mg/dL Person correlation -0.18
p. value 0.27
5. Discussion
This study aimed to evaluate the serum calcium levels and HbA1c in Sudanese patients with type 2 diabetes mellitus.
The study included 40 Sudanese patients with type 2 diabetes mellitus, their serum calcium and HbA1c levels were measured and compared with 40 non-diabetic subjects
as control.
Many studies from countries other than Sudan showed that the mean of serum calcium level is lower in patients with type2 diabetes mellitus than in general population [7] and [8].
In Sudan very few data is available concerning the serum calcium levels in diabetic patients and it is in conflict with data abroad [13] and [14].
From the analysis of the data, in the present work, it was found clearly that patients with diabetes mellitus showed an increased ratios of HbA1c and decreased levels of serum calcium in contrast to non-diabetic subjects (Fig. 1).
In the present study, the mean serum calcium level in diabetic patients was (8.8±0.5) mg/dL and it was significantly (P<0.01) lower than that of the non-diabetic control group, which recorded (9.5±0.4) mg/dL. The mean level of HbA1c in diabetic patients was (7.4±1.7)% and it was significantly (P<0.01) higher than that of the non-diabetic subjects of (4.8±0.6)% tables (1) and (2). These findings agrees with previous study reported by Najeeb et al
[5] who found that the mean serum levels of calcium and HbA1c were, 9.61± 0.84 and 4.68 ± 0.47 in controls and 8.09 ± 0.18 and 8.94 ± 2.38 in cases of type 2 diabetes mellitus respectively, with significance of (P<0.001) and they showed that, there was decrease in serum calcium, magnesium and phosphate levels, all play an important role in the regulation of glucose level in the blood. Hence they suggested that oral supplementation of all these ions other than diet is recommended in type2 diabetes. Another study, Sultan et al [11], also reported that in type2 diabetes patients the mean serum calcium levels were significantly lower than the control group, and suggested that, the reduction in serum calcium levels were most probably due to several factors: reduction in insulin level which impairs bone formation due to its stimulatory action on osteoblast proliferation and impairment of calcium homeostasis, and hyperglycemia which increases calcium and phosphorus excretion in urine being proportional to the degree of glucosuria. However, in contrast to our study, Mohammed and Abdrabo [8] reported that Sudanese diabetic type2 patients have higher serum calcium levels, and mentioned that the increased levels of serum calcium in type2 diabetic patients may play an important role in the vascular complications, such as hypertension, atherosclerosis, and microangiopathy.
Statistically significant negative correlation was found in the present study between the HbA1c level and serum calcium level (table 5). This result agrees with the study done by Gandhi et al [6] who reported that, good correlation was observed among comparison of Glycosylated hemoglobin to calcium. In other study Nagasaka et al [12] found that hyperglycemia caused excess urinary calcium and Phosphorus excretion in patients with NIDDM. In response to urinary calcium loss, PTH secretion is mildly stimulated. Bone formation seems to be suppressed in the hyperglycemic state in spite of increased PTH secretion.
gender (p. value > 0.05) table (3) and (4). This result is in agreement with Emam and Ahmed [13] who stated that in Sudanese patients with type 2 diabetes mellitus, the plasma levels of calcium and glycated hemoglobin are not affected by gender. However, in the present study the level of serum calcium in normal non-diabetic Sudanese individuals showed significantly (P<0.05) lower levels in females compared to male subjects (table7).
The present work showed no significant correlation between duration of diabetes and serum calcium levels table (6), this result agrees with a previous study [14] which stated that in Sudanese patients with type 2 diabetes mellitus, no association was found between calcium and duration of diabetes.
In conclusion the findings in the present work supported previous studies abroad, that in Sudanese type2 diabetic patients, calcium levels are very much affected by diabetes mellitus and there is a good negative correlation between the control of glycemia, as high HbA1c percentage, and reduction in serum calcium levels and this is not influenced by the gender or duration of diabetes.
REFERENCES
[1] Ali, A.;Iqbal, F.; Taj, a.; Iqbal, Z.; Amin, M. J. ; Iqbal, Q. Z. Prevalence of Microvascular Complications in Newly Diagnosed Patients with Type2 Diabetes. Pakistan Journal of Medical Sciences. 4: 899-902. 2013.
[2] Alberti, K.; Aschner, A.; Javerlana. Definition, Diagnosis and Classification of Diabetes Mellitus and its Complications. World Health Organization WHO Department of Noncommunicable Disease Surveillance Geneva.1: (1). Online available from https://www.staff.ncl.a c.uk/philip.home/who_dmc.htm. 1999.
[3] Litwack, G. Human Biochemistry and Disease. Elsevier's science and technology, London. P: 131-146. 2008.
[4] Randie, R.; William, L. A Review of Variant Hemoglobins
Interfering with Hemoglobin A1c Measurement. Journal of Diabetes Science and Technology.3: 446-450. 2009.
[5] Najeeb, Q.; Aziz, R.; Hamid, S. To evaluate the levels of glycated hemoglobin, serum calcium, magnesium, phosphate, uric acid and microalbuminuria in patients with newly diagnosed type 2 diabetes mellitus. International Journal of Research in Medical Sciences. Nov; 2(4):1462-1465. 2014. [6] Gandhi, M.; Venkateshwari, R.; Swaminathan, S. A Study
on the association between plasma glucose, glycosylated hemoglobin and macro metals Calcium and Magnesium in Diabetes mellitus. Experimental Sciences. 4. (1): 16-21. 2013.
[7] Hough, F. S. Alterations metabolism of bone in diabetes and mineral mellitus. Samt Journal. 72: 116-119. 1987.
[8] Mohammed, M. K.; Abdrabo, A. A. Evaluation of Serum Bone Minerals Level in Diabetic Type 2 Sudanese Patients. Sudanese Journal of Public Health. 8:25-28. 2013.
[9] Delage, B., Calcium, Online available from http://lpi.oregonstate.edu/mic/minerals/calcium.
[10] Michael, L.; Edward, P.; Larry, E. Clinical Chemistry: Techniques, principles, correlations. Wolters Kluwer, Philadelphia. 2010.
[11] Sultan, E.; Taha, I.; Saber, L. M. Altered Bone Metabolic Markers In Type 2 Diabetes Mellitus: Impact of Glycemic Control. Journal of Taibah University Medical Sciences.2: 104 - 116. 2008.
[12] Nagasaka, S.; Murakami, T.; Uchikawa, T.; Ishikawa, S. E. ; Saito T. Effect of glycemic control on calcium and phosphorus handling and parathyroid hormone level in patients with non-insulin-dependent diabetes mellitus. Endocrine Journal. 42(3):377-383. 1995.
[13] Emam. ; Ahmed, A. A. Assement of Plasma Levels of Calcium, Phosphate and Glycated Haemoglobin in Sudanese Patients with Type2 Diabetes Mellitus in Reference to Gender and Duration of Diabetes. Sudan University of Science and Technology (M.Sc. Thesis). 2011.