2018 2nd International Conference on Applied Mathematics, Modeling and Simulation (AMMS 2018) ISBN: 978-1-60595-580-3
Selection of the Optimal Segmentation Scale in High-resolution
Remote Sensing Image
Yi-xian CHENG
1and Feng MAO
2,*1
Beijing Institute of Technology Beijing, China
2
School of Management Hangzhou Dianzi University Hangzhou, China
*Corresponding author
Keywords: Object oriented, Image segmentation, The optimal segmentation scale, Calculation model.
Abstract. The selection of the optimal segmentation scale is of great significance in high-resolution remote sensing image multiple scale segmentation, which directly influences the information extraction precision from image. In order to find the optimal segmentation scale, a calculation model of the optimal segmentation scale in terms of several factors have been suggested. This method firstly calculates the best segmentation scale on the consideration of multi-band information, therefore, avoiding the potential subjectivity of human visual. Secondly, the quality evaluation function is put forward using the method of samples controlling which considering area and perimeter as factor s to evaluate consistency between segmented objects and samples. This method of the optimal segmentation scale based on multiple scale and the evaluation of the consistency between the sample and the segmented object in terms of the spectral band is proposed and verified. Results show that the method can obtain the optimal segmentation scale of remote sensing image quickly and efficiently. The algorithm of the model is simple, and is easy to realize, and it is a practical algorithm model.
Introduction
High spatial resolution remote sensing images have been significantly applied in environment monitoring recently. The obtained images provide a lot of details about surface, which are useful for mapping, environmental monitoring, resource investigation, disaster management, and so on. Remote sensing images need to be converted into tangible information which can be utilized in conjunction with other data sets [1]. The traditional pixel-based classification method does not make use of spatial concepts and contextual information, which is a limitation [2].
The traditional classification method based on pixels is easy to cause a large amount of spatial data redundancy and low classification accuracy. The traditional method is more suitable for multispectral and hyper spectral remote sensing images [3]. For high spatial resolution remote sensing images with few bands, the traditional classification methods only consider the spectral information, topological relations between spatial features and objects, causing analysis of graphics processing qualitative difficulties.
On the other hand, the Object-Based Image Analysis (OBIA) is developed to replicate human interpretation of remote sensing images in automated/semi-automated ways [4]. As for the object-Based Image Analysis method, the size of the composition of the different pixels of the object, from the two aspects of spectral bands and shape characterization, can effectively overcome the lack of pixel level classification [5].
Object oriented classification method can effectively improve the classification accuracy of remote sensing image, and the spatial resolution has an important impact on the classification accuracy of the object. The quality of image segmentation directly determines the accuracy of the results based on object processing.
difficult to obtain the ideal result. With different optimal segmentation scales, the existing optimal segmentation scale is computed based on the homogeneity and heterogeneity between objects. This paper presents a new method to extract the target of different information using the method of sample control and calculate the best segmentation scale on the consideration of multi-band information, therefore, avoiding the potential subjectivity of human visual. The method can improve the object oriented optimal segmentation scale by integrating the multi-band and target information.
Integrated Multi-band and Segmentation Objects
The optimal scale can be divided into two categories: 1) when the information extraction is a ground object type or several object types, the optimal scale is defined as: a specific object type can be expressed by one or several objects, and the object size is close to the object size; 2) when the information is extracted for whole picture, the optimal scale which refers to the internal heterogeneity of the image after segmentation is small. Homogeneity guarantees the purity of image objects, and the heterogeneity between objects ensure the separability of the image object.
Because different band weight can be set before the segmentation of multi-band image, the information of the band should be considered more in the process of segmentation. Therefore, when measuring the homogeneity and heterogeneity of segmentation results, the band of larger weight should be given the larger weight, to reflect the standard consistency of segmentation process and segmentation evaluation, so as to establish the evaluation of quality of segmentation and segmentation process. After considering the reference [8] and the multi-band information and the weight, the specific process of the calculation model based on multiband is as follows:
n i i i n i ib
a
v
a
V
1
1
N b b bv t V
1 (1)
Vb is used to indicate the internal heterogeneity of the subject on the spectral band b, as shown in
the first equation, where v is the standard deviation of the subject, a is the area, n is the number of the segmented subjects. In order to avoid the instability of small objects, the factor of area is added to make subjects of big area weighs much. If v is set small, the internal heterogeneity is low. Thus, the homogeneity is high.
In the second equation, V is used to indicate the internal heterogeneity of the subject of different spectral bands, as shown in the equation, where N is the number of spectral bands, t is the weight of a spectral band, v is the homogeneity index of the corresponding spectral band.
j i ij n i ni i j
n j ij b
w
y
y
y
y
w
i y y n I 1 2 1 1 (2)
N b b bi t I1 (3)
Ib indicates the heterogeneity between subjects on the spectral band b. w is the adjacent relationship
and y is the average of subject i or the whole image. If subject i and j are adjacent, w is 1. If subject i and j are not adjacent, w is 0. If Ib is small, the heterogeneity between subjects is high. The I is used to
indicate the correlation between subjects. N is the number of spectral bands. t is the weight of the corresponding spectral band. i is the heterogeneity index of the corresponding spectral band. The lower the I, the better the divisibility between the subjects.
necessary. The calculation formula of the consistency of object sample is proposed based on the two factors of area and perimeter [9]:
m p m p L S L L S S p p p p p p N 1 2 2 1 2 2 0 0 0 0 ) ( (4) This equation indicates the consistency between the actual sample and the segmented subjects in terms of area and perimeter. m is the total amount of the selected samples. S0pis the actual area of thesubject. L0p is the actual perimeter of the subject. Sp is the area of the segmented subject and Lp is the
its perimeter.
v I N
F
v F
I F
NF , , (5)
v
v
v
v
v
F max max min(6)
I
I
I
I
I
F max max min(7)
N
N
N
N
N
F max max min(8)
F(v,I,N) is the evaluation function of the segmentation scale. F(v) is the evaluation function of the internal homogeneity. F(I) is the evaluation function of the heterogeneity between subjects. F(N) is the evaluation function of the consistency between the segmented subjects.
Data and Analysis
Data
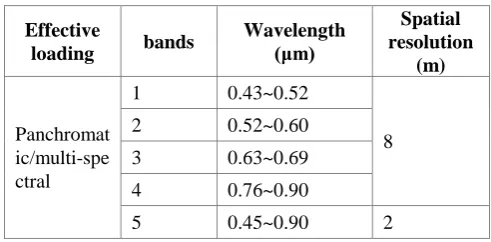
[image:3.595.174.420.517.638.2]The Gao Fen (GF) 1 satellites was successfully launched in April 2013 by China, and this paper mainly uses the data of panchromatic and 8meter of multi-spectral image of August 9, 2013 of GF-1 satellite, covering Hangzhou bay Wetland.
Table 1. The index of effective loading of GF-1 satellite.
Effective
loading bands
Wavelength (μm) Spatial resolution (m) Panchromat ic/multi-spe ctral
1 0.43~0.52
8 2 0.52~0.60
3 0.63~0.69 4 0.76~0.90
5 0.45~0.90 2 The Experiment of Multiple Segmentation Scale
The selection of the segmentation scale is of great importance, which impose direct influence on the accuracy of the area, amount, shape, classification information of the obtained subject [10, 11]. A segmentation scale must be chosen first. The range of the segmentation scale is from 0 to 100%. The bigger the scale, the more detailed the segmentation. Thus, the image is more likely to be broken after segmentation. Second, the combination scale must be set. The range of it is from 0 to 100%. The bigger the scale, the amount of obtained subjects is smaller. Thus, the internal homogeneity is low.
After these parameters are determined, image segmentation is performed by step 5. Compared with the standard false color synthetic image of Fig. 1,when the scale is less than 45, the segmentation results are quite "broken", the spectral heterogeneity between adjacent objects is reduced, and the class divisibility is reduced. When the scale is larger than 100, the over-segmentation is serious, resulting in more merging objects, such as houses, roads and vegetation in the figure, no effective segmentation of the objects, which is also not conducive to improve the accuracy of information extraction. After repeated test, the segmentation scale of 8 m resolution of August 9 of GF-1 image is 65 %, which shows that the segmentation scale is between 0 and 100 %. Under the setting of this parameter, the image segmentation is reasonable, the object internal homogeneity is high, the boundary contour is clear, and has good divisibility and representativeness.
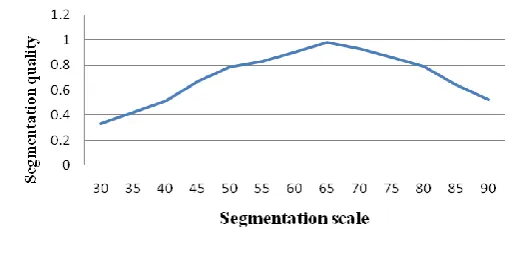
The segmentation quality index is the weighted sum of the heterogeneity index and the homogeneity index. The weight must be appropriate so to best reflect the actual segmentation quality. First, when the set was o.5 and obtain segmentation quality (Fig.1). In the experiment, the segmentation quality of the experimental segmentation results can be obtained by tracking the program running. Considering the continuity of the segmentation quality with the change of segmentation scale, we can conclude that there is a peak between 45 and 75, which serves as the best segmentation scale. To be more accurate, that scale is 65.
[image:4.595.66.526.320.472.2]Segmentation scale 45 Segmentation scale 55 Segmentation scale 65 Segmentation scale 75
Figure 1. Different segmentation scale.
Optimal Scale Segmentation of Mixed Target Extraction
In order to test the model, we choose vegetation and architecture as objects. Select 20 samples, among which there are 10 vegetations and 10 architectures. Use the model to obtain the best segmentation scale, which is 65, Fig.2. In Fig.2, the consistency between the segmented subjects and the sample is quite high.
The optimal segmentation scale of the extraction target is different, and the optimal segmentation scale is the single object type. If the extraction target should take into account multiple types, the best segmentation scale calculated by the model is the relative best segmentation scale after multiple object types.
Figure 2. Segmentation quality withed varied segmentation scale.
[image:4.595.167.431.619.748.2]the number of objects is reduced, and the homogeneity of objects is corresponding decrease, and the heterogeneity between objects increases correspondingly. When the optimal segmentation scale and homogeneity are considered, the weight of homogeneity of the object should be reduced. When we want to emphasize the heterogeneity between objects, we should appropriately increase the weight of heterogeneity. Experiments show that the model based on the choice of the optimal scale is the heterogeneity of the object and the heterogeneity between the objects of balance of contradictions.
Results and Discussion
Multi scale image segmentation is a key technology of an object oriented remote sensing image information extraction, and the segmentation results are directly related the accuracy of the information extraction. The choice of the segmentation scale is especially important.
The purity of the object and the heterogeneity between objects can be guaranteed between objects. Good segmentation result is a balance between these two properties. The optimal segmentation scale model can be obtained from the initial segmentation experiment. This model calculates the optimal segmentation scale for the whole image more convenient and more.
The method is based on multiband automatic selection of the optimal segmentation scale according to the principle of high heterogeneity among the objects. By adjusting the weight factor of homogeneity index and heterogeneity index, a series of optimal scale values can be obtained. Under a weight factor, the choice of the global optimal scale is the balance of the heterogeneity between the homogeneity and the object. The optimal scale value algorithm calculated by the model has good segmentation quality. The model has a certain scientific and practical value, and the algorithm is simple and easy to implement.
The evaluation of the consistency between the sample and the segmented object proposed in the paper considers the area and perimeter of the sample automatically based on multiband; in order to extract information, other sample factors (such as shape, texture, etc.) should be considered, and this method is more suitable for the specific extraction target. How to construct function to embody these factors to measure the consistency of segmentation objects and samples need to be further discussed.
Acknowledgement
This research was supported by Zhejiang Provincial Natural Science Foundation of China under Grant No. LQ17D010005.
References
[1] T. Blaschke, T, “Object based image analysis for remote sensing,” ISPRS Journal of Photogrammetry and Remote Sensing, vol. 65, Jan. 2010, pp: 2–16.
[2] T. Blaschke and J. Strobl, “What’s wrong with pixels? Some recent developments interfacing remote sensing and GIS,” GIS-Zeitschrift für Geoinformations system, vol. 14, Jun. 2001, pp: 12–17.
[3] Z. Fu, J. Hu and Q. Tan, et al., “The methods of image segmentation on application and analysis of remote sensing images,” Remote Sensing Technology and Application, vol., 21, May. 2006, pp: 456-462.
[4] G. Hay, and G. Castilla, “Object-based image analysis: strengths, weaknesses, opportunities and threats (SWOT). International archives of photogrammetry,” Remote Sensing and Spatial Information Sciences, Vol. 36.
[6] W. Hu, P. Zhao and Z. Dong, “An Improved Calculation Model of Object Oriented for the Optimal Segmentation Scale of Remote Sensing Image,” Geography and Geo- Information Science, vol. 26, Jun. 2010, pp: 15-18.
[7] L. Mo, Y. Cao, Y. Hu, et al. “Object-oriented classification for satellite remote sensing of wetland: A case study in southern Hangzhou bay area,” Wetland Science, vol. 10, Feb. 2012, pp: 206-213.