2019 2nd International Conference on Informatics, Control and Automation (ICA 2019) ISBN: 978-1-60595-637-4
Energy Recovery Simulation Research of Demolition Robot Rotation
Hydraulic System
Peng CHAI
*, Yu-wan CEN, Xiao-hua YE, Jian-zhong HUANG
and Li-hua WANG
College of Mechanical Engineering, Anhui University of Technology, Ma’anshan, Anhui, China
*Corresponding author
Keywords: Demolition robot, Hydraulic System, Energy Recovery, Joint Simulation.
Abstract. When the robot rotates to brake, the oil circuit of the system will produce greater pressure impact due to the large moment of inertia. High pressure oil overflows through the relief valve, then the overflow back pressure provides negative torque to brake the turntable. The rotational kinetic energy is finally dissipated in the form of heat energy, resulting in the waste of energy and the increase of oil temperature as well as the decline of system performance. Therefore, a scheme of recovery and utilization of rotary kinetic energy is proposed, that is, to recover the kinetic energy of the turntable during the rotary braking and to use the recovered energy as auxiliary energy during the rotary start-up. Virtual.Lab-Motion and AMESim are used to establish the joint simulation model of the electromechanical and hydraulic system of the demolition robot. The simulation results show that the energy recovery efficiency of the scheme can reach over 65%, and the comprehensive energy saving efficiency can reach about 10%.
Introduction
the skin type hydraulic accumulator and the output torque of the motor is reduced through driving the auxiliary motor. The reversing of the reversing valve, the opening and closing of the switching valve and the displacement regulation of the auxiliary motor can be controlled according to the recognition of the rotary motion state by the controller, and the function of using the energy recovered during braking as the auxiliary energy can be realized. Virtual.Lab-Motion and AMESim are used to establish the simulation model. Based on the it, the energy recovery efficiency and its influencing factors are analyzed.
The Mechanical Structure of the Demolition Robot and the Design of Energy Recovery and Utilization Rotary System
Introduction to the Structure of the Demolition Robot
The structure of the robot is shown in figure 1.
2 4 5
6 7 8 9 10
11 12 13
1 3
[image:2.595.175.423.262.394.2]1.breaking hammer 2. universal quick connect 3.the third arm 4. hammer oil cylinder 5.the third arm oil cylinder 6. telescopic boom 7.the second arm 8.the second arm oil cylinder 9.the first arm 10. turntable 11. running gear 12. gyroscopic support 13. outrigger
Figure 1. Structure diagram of the demolition robot.
As can be seen from figure 1, the demolition robot can be divided into rotary device, walking device, mechanical arm working device and chassis. The rotary device consists of a mechanical part and a hydraulic part. The mechanical part includes a slewing drive and a slewing support. The rotary drive consists of a rotary motor and a reducer, which are usually integrated. Since the mechanical arm, core components and counterweight are all arranged on the rotary platform, a large inertia moment will be generated in the rotary process. And the rotary braking contains a considerable amount of recoverable kinetic energy.
Structure Design and Working Principle of the Energy Recovery and Utilization System
1
2
4
3
5 6 7
8
9 10
11 12
13 15 14
20 18
19 21
22
Load Sensitive Control Valve Set
C
on
tr
ol
le
r
Turntable
M
16 17
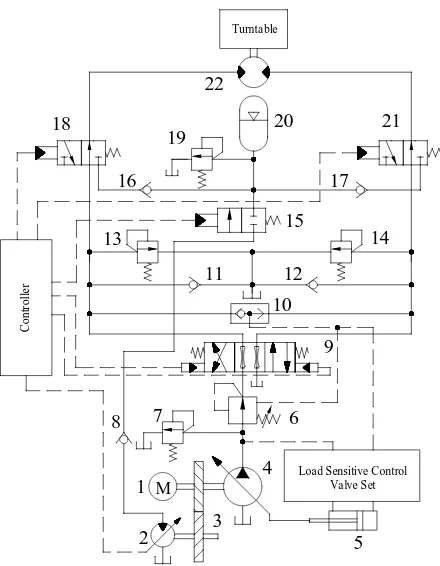
1. motor 2.the auxiliary motor 3. torque coupler 4. the main pump 5. the variable cylinder 6. the pressure compensation valve 7. the relief valve 8, 11, 12, 16, 17. the check valve 9. the proportional valve 10. 13, 14. the shuttle valve 15. the switch valve 18, 21. the
[image:3.595.187.407.75.358.2]reversing valve 19. the relief valve 20. the accumulator 22. the rotary motor
Figure 2. Schematic diagram of energy recovery and utilization rotary system structure.
It is assumed that the direction of rotation is positive when the oil is fed into the left cavity of the rotary motor. When the turntable starts forward, the proportional valve 9 and the reversing valve18 and 21 all work in the right position, and the right chamber of the motor exhibits low pressure. When the pilot signal issued the brake command, the proportional valve 9 back to the middle, the reversing valve 21 gets power, the switch valve 15 close, and the reversing valve 18 is still working in the right position. The rotary table still rotates in the positive direction under the action of inertia. The pressure oil in the right chamber no longer flow through the safety valve 14, but through the accumulator 20. Under the back pressure of accumulator, the rotating speed of the turntable decreases from the maximum value to zero value. The rotational kinetic energy is eventually converted into hydraulic energy, which stored in the accumulator. In order to prevent air suction, the oil flows into the motor through the check valve 11 and the right position of reversing valve 18 in the process of braking. Under the action of the accumulator, the auxiliary motor and the electromotor drive the main pump jointly.
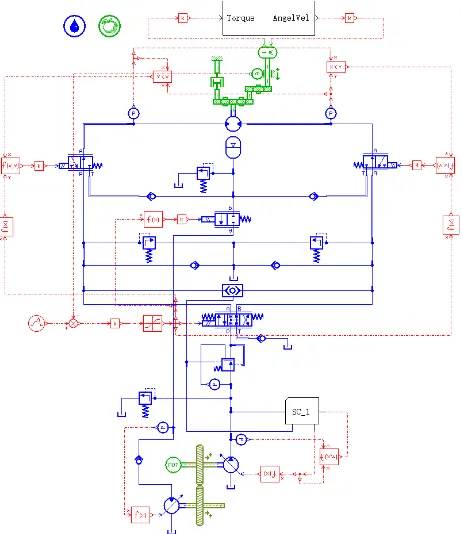
Establishment of the Energy Recovery and Utilization Rotary System Simulation Model
Figure 3. Joint simulation model of energy recovery and utilization rotary system.
Analysis and Calculation of the Energy Recovery Efficiency
"The demolition robot rotates at an angular speed of 9.76r/min under a certain attitude and braking at 7.5s" is selected as the simulation condition to analyze the energy consumption during braking of the original system and the energy recovery rate of the energy recovery system. Figure 4-6 show the angular velocity curve of the turntable, the chamber pressure curve of the rotary motor and the power consumption curve of the safety valve of the original system.
0 2 4 6 8 10
-2 0 2 4 6 8 10 12
w
/
(
r
min
-1)
t/s angular velocity
0 2 4 6 8 10
0 5 10 15 20 25 30 35 40
p
/MPa
t/s
inlet chamber pressure oil-return chamber pressure
Figure 4. Angular velocity curve of the original system turntable.
Figure 5. Pressure curve of two cavities of original system rotary moto.
6.5 7.0 7.5 8.0 8.5 9.0
0 20 40
P
/kW
t/s
power loss in the safety valve
0 5 10
energy loss in the
[image:4.595.67.538.433.736.2]safety valve W/kJ
Figure 6. Loss power and it's integral curve of the safety valve of the original system.
As can be seen from figure 5, the pressure level of the two chambers of the motor changes during braking, and the pressure of the oil return chamber instantly reaches the opening value of the safety valve. With the swing of the turntable, the pressure of the two cavities gradually attenuates and finally stabilizes.
As can be seen from figure 6, the overflow of the safety valve causes a large amount of energy dissipation on its valve opening. Higher peak power indicates greater hydraulic impact on the system. The empirical formula method can be used to preliminarily match the parameters of the accumulator, but the error and complexity of this method is large and there is no unique criterion. In this paper, the electromechanical and hydraulic combined simulation model of the rotary system has been established. On this basis, the parameters of the accumulator are preliminarily determined by means of simulation test. By integrating the relief valve overflow flow curve, it can be obtained that the overflow volume is about 0.5L. In order to fully absorb the oil volume during braking, the initial volume of the accumulator can be set to 3L primarily, and then the initial pressure can be selected according to the desired braking effect. Through multiple simulations, the initial pressure is temporarily set at 6MPa.
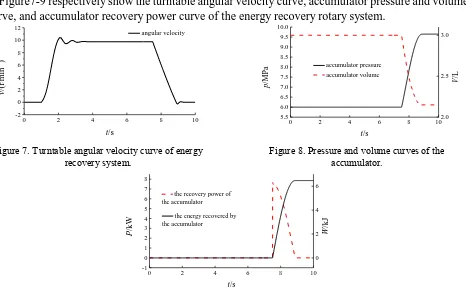
Figure7-9 respectively show the turntable angular velocity curve, accumulator pressure and volume curve, and accumulator recovery power curve of the energy recovery rotary system.
0 2 4 6 8 10
-2 0 2 4 6 8 10 12
v
/(
r
min
-1 )
t/s
angular velocity
0 2 4 6 8 10
5.5 6.0 6.5 7.0 7.5 8.0 8.5 9.0 9.5 10.0
p
/MPa
t/s accumulator pressure
2.0 2.5 3.0
accumulator volume
V
/L
Figure 7. Turntable angular velocity curve of energy recovery system.
Figure 8. Pressure and volume curves of the accumulator.
0 2 4 6 8 10
-1 0 1 2 3 4 5 6 7 8
P
/kW
t/s
the recovery power of the accumulator
0 2 4 6
the energy recovered by the accumulator
W
[image:5.595.70.536.289.588.2]/kJ
Figure 9. Recovery power and its integral curve of the accumulator.
As can be seen from figure 7, the angular velocity fluctuation of the demolition robot with the energy recovery system is obviously reduced, and the braking process is more stable.
As can be seen from figure 8, the pressure of the accumulator increases from 60bar to 96bar, and the volume decreases from 3L to 2.15L. Energy recovery and storage are realized.
According to figure 9, the energy recovered by the accumulator reach 6.47Kj.
During the braking process of the rotary device, all the kinetic energy of the turntable is dissipated in the form of heat energy Q.
Q=1/2(Jω12-Jω22). (1)
Which J is the moment of inertia of the rotary mechanism, which is 22000kg·m2 under this working condition. ω1 is the angular velocity before braking of the rotary mechanism, which is 9.76 r·min-1. ω2
Which η is the energy recovery efficiency, E is the energy recovered by accumulator. Then, getting the result as follows.
Q= 11.48kJ, E= 6.47kJ, η=56.4%.
Analysis of the Influencing Factors of Energy Recovery Efficiency
Influence of the Different Initial Pressure of Accumulator
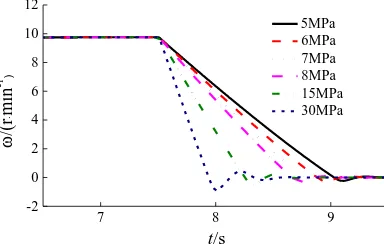
Using the control variable method, the initial volume of the accumulator is set to 3L, and the initial pressure is set to 5MPa, 6MPa, 7MPa, 8MPa, 15MPa and 30MPa, respectively. The influence of the initial pressure of the accumulator on the energy recovery rate and the angular velocity of the turntable are shown in Figure 10-12.
7 8 9
0 5 10 15 20 25 30 35 40 P /kW t/s 5MPa 6MPa 7MPa 8MPa 15MPa 30MPa 0 2 4 6 8 10 5MPa 6MPa 7MPa 8MPa 15MPa 30MPa W /kJ
4 6 8 10 12 14 16 18 20 22 24 26 28 30 32
0.50 0.55 0.60 0.65 0.70 0.75 η(100% )
p0/MPa
[image:6.595.97.524.225.537.2]energy recovery efficiency
Figure 10. Comparison curves of accumulator recovery power and energy under different initial pressures.
Figure 11. Energy recovery rate at different initial pressures.
7 8 9
-2 0 2 4 6 8 10 12 ω /( r min -1 ) t/s 5MPa 6MPa 7MPa 8MPa 15MPa 30MPa
Figure 12. Angular velocity comparison curves of the turntable under different initial pressures.
As can be seen from figure 10, with the increase of the initial pressure of the accumulator, the energy recovered increases, but the increase rate slow down. In addition, the peak value of the recovery power increases with the increase of the initial pressure of the accumulator, but the recovery time will be shorter.
It can be seen more intuitively from figure 11 that with the increase of initial pressure, the energy recovery rate also increases and the increase rate gradually decreases. When the initial pressure is too high, the energy recovery rate increases more slowly.
As can be seen from figure 12, the greater the initial pressure is, the more obvious the swing phenomenon of the turntable is during braking.
Based on the above analysis, the higher energy recovery rate and gentler braking effect can be achieved at the initial pressure within the range of 8~15MPa.
Influence of the Different Initial Volume of Accumulators
[image:6.595.202.394.407.531.2]7 8 9 0 2 4 6 8 10 12 14 16 18 P /kW t/s 1L 2L 3L 5L 10L 20L 0 1 2 3 4 5 6 7 8 9 1L 2L 3L 5L 10L 20L W /kJ
0 2 4 6 8 10 12 14 16 18 20 22
0.650 0.655 0.660 0.665 0.670 0.675 0.680 0.685 0.690 0.695 (1 00 %) V/L
[image:7.595.61.277.68.201.2]energy recovery efficiency
Figure 13. Comparison curves of accumulator recovery
power and energy under different initial volumes. Figure 14. Energy recovery rate at different initial volumes.
7.0 7.5 8.0 8.5 9.0 9.5
-2 0 2 4 6 8 10 12 ω /( r min -1 ) t/s 1L 2L 3L 5L 10L 20L
Figure 15. Angular velocity comparison curves of the turntable under different initial volumes.
As can be seen from figure 13, with the increase of the initial volume of the accumulator, the recovered energy decreases, but the decrease rate slow down.
It can be seen more intuitively from figure 14 that with the increase of the initial volume, the energy recovery rate gradually decreases, and the decrease rate gradually slow down. The energy recovery rate displayed in the figure is within the range of 65.33%~68.92%. Since 12MPa is the initial pressure match with a high energy recovery rate, the energy recovery rate is high and the change range is small. As can be seen from figure 15, the smaller the initial volume is, the more obvious the shaking of the angular velocity of the turntable is.
According to the above analysis, increasing the initial pressure or decreasing the initial volume can improve the energy recovery rate of the accumulator, but the swing of the turntable increased. Therefore, it is a better matching result to choose a parameter combination that takes both performance into consideration. The paper finally set the initial pressure as 10MPa and the initial volume as 3L.
The Releasing of the Recycled Energy
The recovery and utilization of rotary braking energy are analyzed by taking a positive and negative turning period of the turntable as the simulation condition. Figure 16-18 show the angular velocity curve of the turntable, the pressure and volume curve of the accumulator, and the torque coupling curve.
0 5 10 15
-15 -10 -5 0 5 10 15 ω /( r min -1 ) t/s angular velocity
0 2 4 6 8 10 12 14 16 18
[image:7.595.195.405.243.364.2] [image:7.595.318.528.662.768.2] [image:7.595.66.273.662.768.2]required torque ofthe pump
output torque ofthe motor
coupling torque of the motor
0 3 6 9 12 15 18
-15 0 15 30 45 60 75 90 105 120 135
M
/N
[image:8.595.195.406.74.202.2]t/s
Figure 18. Torque coupling curve.
As can be seen from figure 16, the energy recovery and utilization system does not affect the original rotary angular velocity characteristics of the demolition robot.
It can be seen from figure 17 that the accumulator effectively recovers energy during braking and releases energy during start-up.
Figure18 shows that when the turntable is started, the accumulator drives the auxiliary motor, which is coupled with the motor in torque. Thereby, the output torque of the motor is reduced.
Summary
In order to solve the problem of the waste of rotary kinetic energy in the rotary braking of demolition robot, a scheme of energy recovery and utilization is designed. Through simulation research, it can be concluded that:
1. The energy recovery scheme is feasible in energy saving. The simulation results show that the energy recovery efficiency of the scheme can reach over 65%, and the comprehensive energy saving efficiency can reach about 10%.
2. With the increase of initial pressure, the energy recovery rate increases, but the increase rate decreases gradually. With the increase of the initial volume, the energy recovery rate decreases, and the reduction amplitude decreases gradually.
3. The parameter matching and optimization of accumulator and motor in energy recovery unit can be further studied.
Acknowledgements
This research was financially supported by the National Science-technology Support Plan Project of China (2015BAK06B02) and the Key Project of Natural Science Foundation for Colleges and Universities in Anhui (KJ2017A049, KJ2016A812).
References
[1] Peng-zhou Tang, Ming Luo, Development and application of engineering robot technology, J. Construction machinery. 2015(09) 12+14-17.
[2] Xi-hua Xie, Liang Zhou, Da-qing Zhang, Development Status of Hydraulic Excavator Technology Research, J. Construction Machinery. 2015 (09) 12+14-17.
[3] Chang-sheng Liu, Qing-hua He, Jun Gong, et al, Modeling and Experimental Research on Rotary Braking Energy Recovery System of Hybrid Excavator, J. Journal of Central South University (Science and Technology). 2016, 47(05)1533-1542.
[5] Wei Liu, Yue-hu Jia, Xiao-ning Ding, et al, Research on Swing Braking Energy Recovering Strategy of Hydraulic Excavator, J. Hydraulics Pneumatics & Seals. 2015, 35(09)72-74.