R E S E A R C H A R T I C L E
Open Access
Imaging methods for quantifying glenoid
and Hill-Sachs bone loss in traumatic
instability of the shoulder: a scoping review
David J. Saliken
1, Troy D. Bornes
1, Martin J. Bouliane
1, David M. Sheps
1and Lauren A. Beaupre
2*Abstract
Background:Glenohumeral instability is a common problem following traumatic anterior shoulder dislocation.
Two major risk factors of recurrent instability are glenoid and Hill-Sachs bone loss. Higher failure rates of arthroscopic Bankart repairs are associated with larger degrees of bone loss; therefore it is important to accurately and reliably quantify glenohumeral bone loss pre-operatively. This may be done with radiography, CT, or MRI; however no gold standard modality or method has been determined. A scoping review of the literature was performed to identify imaging methods for quantifying glenohumeral bone loss.
Methods:The scoping review was systematic in approach using a comprehensive search strategy and standardized
study selection and evaluation. MEDLINE, EMBASE, Scopus, and Web of Science were searched. Initial selection included articles from January 2000 until July 2013, and was based on the review of titles and abstracts. Articles were carried forward if either reviewer thought that the study was appropriate. Final study selection was based on full text review based on pre-specified criteria. Consensus was reached for final article inclusion through discussion amongst the investigators. One reviewer extracted data while a second reviewer independently assessed data extraction for discrepancies.
Results:Forty-one studies evaluating glenoid and/or Hill-Sachs bone loss were included: 32 studies evaluated
glenoid bone loss while 11 studies evaluated humeral head bone loss. Radiography was useful as a screening tool but not to quantify glenoid bone loss. CT was most accurate but necessitates radiation exposure. The Pico Method and Glenoid Index method were the most accurate and reliable methods for quantifying glenoid bone loss, particularly when using three-dimensional CT (3DCT). Radiography and CT have been used to quantify Hill-Sachs bone loss, but have not been studied as extensively as glenoid bone loss.
Conclusions:Radiography can be used for screening patients for significant glenoid bone loss. CT imaging, using the
Glenoid Index or Pico Method, has good evidence for accurate quantification of glenoid bone loss. There is limited evidence to guide imaging of Hill-Sachs bone loss. As a consensus has not been reached, further study will help to clarify the best imaging modality and method for quantifying glenohumeral bone loss.
Keywords:Shoulder instability, Diagnostic imaging, Specificity, Sensitivity
* Correspondence:[email protected]
2
2-50 Corbett Hall, Department of Physical Therapy, University of Alberta, Edmonton, AB T6G 2G4, Canada
Full list of author information is available at the end of the article
© 2015 Saliken et al. This is an Open Access article distributed under the terms of the Creative Commons Attribution License (http://creativecommons.org/licenses/by/4.0), which permits unrestricted use, distribution, and reproduction in any medium, provided the original work is properly credited. The Creative Commons Public Domain Dedication waiver (http:// creativecommons.org/publicdomain/zero/1.0/) applies to the data made available in this article, unless otherwise stated. Salikenet al. BMC Musculoskeletal Disorders (2015) 16:164
Background
Glenohumeral instability (GHI) has been associated with a
recurrence rate ranging from 30-90 % [1–3]. Currently,
arthroscopic Bankart repair using modern suture anchor techniques have failure rates ranging from 4-17 % [4–6]. A number of risk factors have been proposed to predict recur-rence of GHI following arthroscopic Bankart repair includ-ing: age, humeral head and glenoid bone loss, shoulder
hyperlaxity, and contact activity [1, 7–10]. Glenoid bone
loss occurs in up to 90 % of patients with recurrent GHI [11] and, on average, occurs nearly parallel to the long axis of the glenoid (03:01–03:20 on a clock face) [12, 13].
Bur-khart et al.showed that significant glenoid bone loss,
ap-proximately 25-45 % of glenoid width loss, was associated with higher failure rates of arthroscopic Bankart repairs [14, 15]. The critical defect size for predicting failure of arthroscopic Bankart repairs has been explored
biomechan-ically [16–18]. Yamamoto et al. found that glenoid loss
greater than 20 % glenoid length and 26 % of glenoid width, destabilized the shoulder [19]. The threshold of glenoid bone loss above which arthroscopic Bankart repairs may fail
has generally been accepted as glenoid width loss ≥25 %,
which is equivalent to ≥19 % of the glenoid length and
≥20 % of the surface area created by a best-fit circle on the inferior surface of the glenoid [14–20]. Width loss of 25 % may be expressed as a millimeter defect, varying based on individual glenoid anatomy but is approximately 6-8 mm given that the average glenoid width at the level of the bare area is 24-26 mm [19, 21]. It is important to keep in mind how one calculates glenoid bone loss, as the threshold for surface area is different than for glenoid width.
Humeral head bone loss, also known as a Hill-Sachs lesion, occurs in up to 93 % of patients with recurrent GHI [22]. Hill-Sachs lesions are oriented in the axial plane approximately at 07:58+/−00:48 or at an angle of
239.1+/−24.3 ° from 12 o’clock [23]. In a biomechanical
study, Kaar et al. showed that defects created at an
orientation of 209 ° significantly decreased resistance to dislocation when they were greater than 5/8 the depth of the radius of the humeral head in the axial plane [24].
Sekiya et al. demonstrated that Hill-Sachs lesions
cre-ated in a posterolateral orientation benefited from allo-graft transplantation when greater than 37.5 % of the humeral head diameter [25]. In a later cadaveric study,
Sekiyaet al. showed that defects of 25 % of the humeral
head diameter in isolation did not increase risk of dis-location following a capsulolabral repair [26]. There is a relationship between recurrent dislocations and failure of arthroscopic Bankart repair with increasing size of the Hill-Sachs lesion, although an accepted threshold value for Hill-Sachs bone loss has not yet been determined [9, 27, 28]. Hill-Sachs bone loss occurs simultaneously with glenoid bone loss in up to 62 % of GHI patients [29]. The way in which the glenoid and Hill-Sachs
lesions interact and contribute to GHI is complex but does appear to be synergistic [30].
The degree of glenohumeral bone loss plays a role in sur-gical decision-making. The glenoid lesion may be treated successfully with an arthroscopic Bankart repair if it is smaller than the previously mentioned values. Larger glenoid bone lesions may require a bone augmentation cedure such as a Latarjet coracoid transfer or a J-graft pro-cedure (bone graft harvested from iliac crest) [31]. A large Hill-Sachs defect can be addressed via a remplissage pro-cedure (posterior capsulodesis and infraspinatus tenodesis), allograft, resurfacing arthroplasty, or rotational osteotomy. Ideally, the surgeon would be able to accurately quantify bone loss preoperatively to best ensure a successful post-operative outcome with the lowest rate of recurrent in-stability and the least amount of post-surgical morbidity.
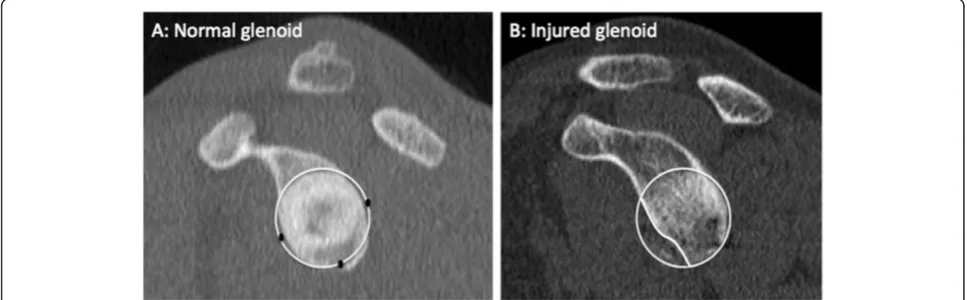
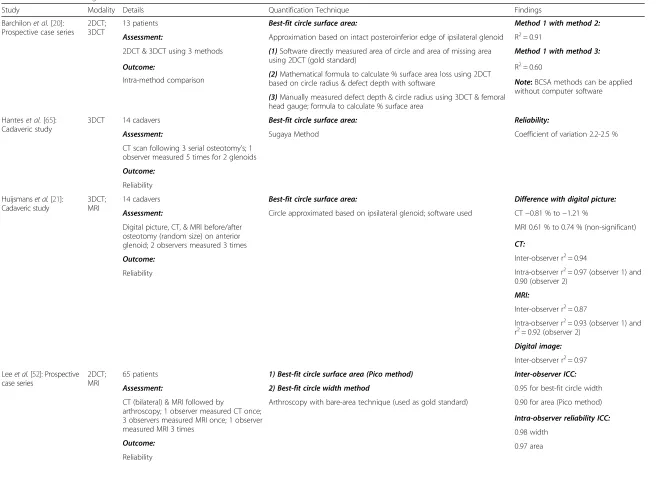
Multiple imaging methods exist for quantifying glen-oid and Hill-Sachs bone loss including radiography, computerized tomography (CT), and magnetic reson-ance imaging (MRI). Radiography is inexpensive and easy to obtain but may be less accurate in detecting the presence of bone lesions compared to CT. Radiographic methods have been proposed using both basic views (true AP, axillary) and special views (Bernageau profile) to measure glenoid and Hill-Sachs bone loss. CT is easy to obtain and accurate with respect to bony detail, but necessitates radiation exposure. MRI is expensive and more difficult to obtain in public health care systems but has no radiation exposure, and may provide information on associated soft tissue lesions involving the labrum, rotator cuff, and capsule. However, assessment of bone lesions may be inferior to that of CT. Two common methods of calculating glenoid bone loss using CT and MRI are width measurements such as the Griffiths Index (Fig. 1) and best-fit circle surface area measurements such as the Pico Method (Fig. 2) [32, 33]. These methods in-volve reformatting to subtract the humeral head and get an en face view of the glenoid. The inferior 2/3 of the glenoid approximates a true circle, the size of which can be estimated based on either the contralateral glenoid or intact posteroinferior margins of the injured glenoid [11, 34, 35]. Bone loss can then be expressed as the area lost from the circle or the anterior-to-posterior width loss. De-termination for Hill-Sachs bone loss has included, among others, depth, width, and length measurements [36–39].
The degree of glenohumeral bone loss affects the suc-cess of arthroscopic Bankart repair and, at present, there is no consensus on a gold standard imaging method or modality for the quantification of glenohumeral bone loss. We performed a scoping review of the literature to identify current published imaging methods for quantify-ing glenoid and humeral head bone loss in GHI and to evaluate if there was a gold standard method and modal-ity supported by evidence.
Methods Study design
A scoping review was performed to evaluate the litera-ture based on established guidelines [40, 41]. Scoping re-views are designed to assess the extent of a body of literature and identify knowledge gaps. Although qualita-tive in nature, the review can be systematic in approach through a comprehensive search strategy and standard-ized study selection and evaluation, as in our study. Due to heterogeneity in the articles reviewed, no meta-analyses were performed in this study.
Selection criteria
Studies were included if the following conditions were met: (1) publication after the year 2000 (following a pre-liminary review of the literature, the majority of relevant imaging methods were published after this time point; publications prior to 2000 are included in our introduction
and discussion when historically relevant); (2) use of human or cadaveric human subjects; (3) evaluation of imaging methods including radiography, CT, and/or MRI; and (4) quantification of glenoid or Hill-Sachs bone loss using these imaging modalities. Criteria for exclusion were: (1) non-English language; and (2) publication in the form of an ab-stract, letter, or review article.
Search strategies
MEDLINE, EMBASE, Scopus, and Web of Science were searched from January 2000 until July 2013. A search al-gorithm was created with the guidance of a medical li-brarian (see Additional file 1).
Study selection
Article selection was performed over two rounds, by two orthopaedic surgery residents with the assistance of two upper extremity fellowship-trained orthopaedic surgeons. Fig. 1Griffith Index. Width measurements are made perpendicular to a line through the vertical axis of the glenoid and compared to the uninjured glenoid (B/A x 100) to determine percent width loss (adapted from Griffithet al.[33])
Fig. 2Pico Method. The original description of Pico Method involved determining the circumference of the contralateral, normal inferior glenoid circle based on the intact 3–9 o’clock margin, transferring the circle to the injured glenoid, and manually tracing out the glenoid defect and using software to calculate surface area bone loss. Note that the Pico Method has also been used with the intact 6 o’clock-9 o’clock postero-inferior margin of the injured glenoid to determine the pre-injury glenoid circle (adapted from Boiset al.[63])
[image:3.595.57.540.89.249.2] [image:3.595.56.540.534.684.2]During the first round, selection was based on the review of titles and abstracts. To be as inclusive as possible, an article was carried forward to the next stage if either re-viewer thought that the study was appropriate. Final study selection was based on full text review using the afore-mentioned inclusion and exclusion criteria. Duplicate studies were kept until the final article selection. Consen-sus was reached for final article inclusion through discus-sion amongst the investigators.
Data extraction
One reviewer extracted study design, imaging modality evaluated, patient characteristics, quantification method used, and findings. A second reviewer independently assessed data extraction for any discrepancies. When provided by the authors, the reliability, accuracy, sensi-tivity, and specificity are presented in the results section with accompanying tables.
Results Article selection
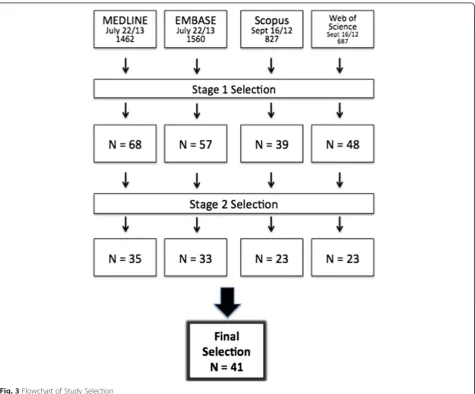
Initial literature search retrieved 4536 total articles: 1462 from MEDLINE, 1560 from EMBASE, 827 from Scopus, and 687 from Web of Science (Fig. 3). After the initial review of titles and abstracts, 212 articles were retained. Following review of the full text, 114 articles remained. After the removal of duplicates, 41 articles were included.
Article summary
Tables 1, 2, 3, 4, 5 and 6 summarize the selected articles. We retained 11 articles focusing on Hill-Sachs bone loss, 32 for glenoid bone loss, and 2 articles evaluated both. There were a significantly higher number of articles evaluating CT imaging (38) compared to radiography (11) and MRI (10). For glenoid bone loss, radiography
was evaluated in 7 studies [18, 42–47], MRI in 8 studies
[21, 42, 44, 48–53], and CT in 32 studies [11, 18, 20, 21,
Fig. 3Flowchart of Study Selection
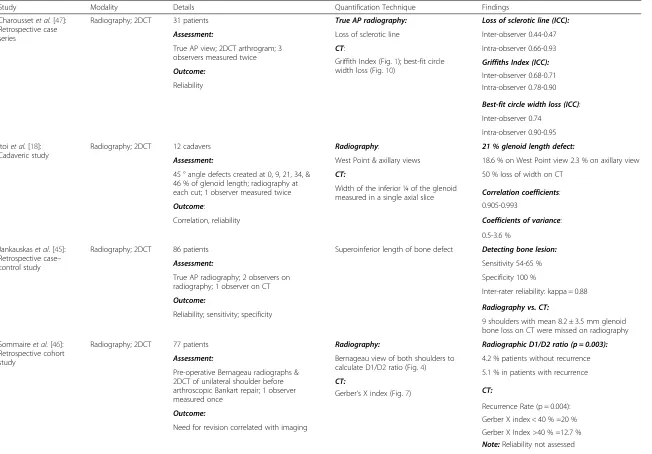
[image:4.595.63.539.333.727.2]Table 1Studies Assessing Glenoid Bone Loss with Radiography
Study Modality Details Quantification Technique Findings
Charoussetet al.[47]: Retrospective case series
Radiography; 2DCT 31 patients True AP radiography: Loss of sclerotic line (ICC):
Assessment: Loss of sclerotic line Inter-observer 0.44-0.47
True AP view; 2DCT arthrogram; 3 observers measured twice
CT: Intra-observer 0.66-0.93
Outcome:
Griffith Index (Fig.1); best-fit circle width loss (Fig.10)
Griffiths Index (ICC):
Reliability
Inter-observer 0.68-0.71 Intra-observer 0.78-0.90
Best-fit circle width loss (ICC):
Inter-observer 0.74
Intra-observer 0.90-0.95
Itoiet al.[18]: Cadaveric study
Radiography; 2DCT 12 cadavers Radiography: 21 % glenoid length defect:
Assessment: West Point & axillary views 18.6 % on West Point view 2.3 % on axillary view
45 ° angle defects created at 0, 9, 21, 34, & 46 % of glenoid length; radiography at each cut; 1 observer measured twice
CT: 50 % loss of width on CT
Outcome:
Width of the inferior ¼ of the glenoid measured in a single axial slice
Correlation, reliability
Correlation coefficients:
0.905-0.993
Coefficients of variance:
0.5-3.6 %
Jankauskaset al.[45]: Retrospective case– control study
Radiography; 2DCT 86 patients Superoinferior length of bone defect Detecting bone lesion:
Assessment: Sensitivity 54-65 %
True AP radiography; 2 observers on radiography; 1 observer on CT
Specificity 100 %
Outcome:
Inter-rater reliability: kappa = 0.88
Reliability; sensitivity; specificity Radiography vs. CT:
9 shoulders with mean 8.2 ± 3.5 mm glenoid bone loss on CT were missed on radiography
Sommaireet al.[46]: Retrospective cohort study
Radiography; 2DCT 77 patients Radiography: Radiographic D1/D2 ratio (p = 0.003):
Assessment: Bernageau view of both shoulders to calculate D1/D2 ratio (Fig.4)
4.2 % patients without recurrence
Pre-operative Bernageau radiographs & 2DCT of unilateral shoulder before arthroscopic Bankart repair; 1 observer measured once
CT:
Outcome:
Gerber‘s X index (Fig.7)
5.1 % in patients with recurrence
CT:
Recurrence Rate (p = 0.004):
Gerber X index < 40 % =20 % Need for revision correlated with imaging
Gerber X Index >40 % =12.7 % Note:Reliability not assessed
Saliken
et
al.
BMC
Musculosk
eletal
Disorders
(2015) 16:164
Page
5
of
Table 1Studies Assessing Glenoid Bone Loss with Radiography(Continued)
Murachovskyet al. [43]: Prospective case–control study
Radiography; 3DCT 10 patients; 50 healthy subjects Radiography: Reliability:
Assessment: Bernageau view (D1/D2) ratio (Fig.4) Intra-observer ICC 0.897-0.965
Bilateral radiography (all subjects) & CT (instability subjects); 1 radiologist measured CT; 3 orthopaedic surgeons measured 3 times each
3DCT: Inter-observer ICC 0.76-0.81
Outcome:
Glenoid AP width measured bilaterally to calculate % bone loss
Difference between radiography & CT non-significant (2.28 %)
Reliability
List of Abbreviations: ICCintraclass correlation coefficient;PEpercent error
Saliken
et
al.
BMC
Musculosk
eletal
Disorders
(2015) 16:164
Page
6
of
Table 2Studies Assessing Glenoid Surface Area Loss with CT and MRI
Study Modality Details Quantification Technique Findings
Barchilonet al.[20]: Prospective case series
2DCT; 3DCT
13 patients Best-fit circle surface area: Method 1 with method 2:
Assessment: Approximation based on intact posteroinferior edge of ipsilateral glenoid R2= 0.91
2DCT & 3DCT using 3 methods (1)Software directly measured area of circle and area of missing area using 2DCT (gold standard)
Method 1 with method 3:
Outcome:
(2)Mathematical formula to calculate % surface area loss using 2DCT based on circle radius & defect depth with software
R2= 0.60
Intra-method comparison
(3)Manually measured defect depth & circle radius using 3DCT & femoral head gauge; formula to calculate % surface area
Note:BCSA methods can be applied without computer software
Hanteset al.[65]: Cadaveric study
3DCT 14 cadavers Best-fit circle surface area: Reliability:
Assessment: Sugaya Method Coefficient of variation 2.2-2.5 %
CT scan following 3 serial osteotomy’s; 1 observer measured 5 times for 2 glenoids
Outcome:
Reliability
Huijsmanset al.[21]: Cadaveric study
3DCT; MRI
14 cadavers Best-fit circle surface area: Difference with digital picture:
Assessment: Circle approximated based on ipsilateral glenoid; software used CT−0.81 % to−1.21 %
Digital picture, CT, & MRI before/after osteotomy (random size) on anterior glenoid; 2 observers measured 3 times
MRI 0.61 % to 0.74 % (non-significant)
Outcome:
CT:
Reliability
Inter-observer r2= 0.94
Intra-observer r2= 0.97 (observer 1) and 0.90 (observer 2)
MRI:
Inter-observer r2= 0.87
Intra-observer r2= 0.93 (observer 1) and
r2= 0.92 (observer 2) Digital image:
Inter-observer r2= 0.97 Leeet al.[52]: Prospective
case series
2DCT; MRI
65 patients 1) Best-fit circle surface area (Pico method) Inter-observer ICC:
Assessment: 2) Best-fit circle width method 0.95 for best-fit circle width
CT (bilateral) & MRI followed by
arthroscopy; 1 observer measured CT once; 3 observers measured MRI once; 1 observer measured MRI 3 times
Arthroscopy with bare-area technique (used as gold standard) 0.90 for area (Pico method)
Outcome:
Intra-observer reliability ICC:
Reliability
0.98 width
0.97 area
Saliken
et
al.
BMC
Musculosk
eletal
Disorders
(2015) 16:164
Page
7
of
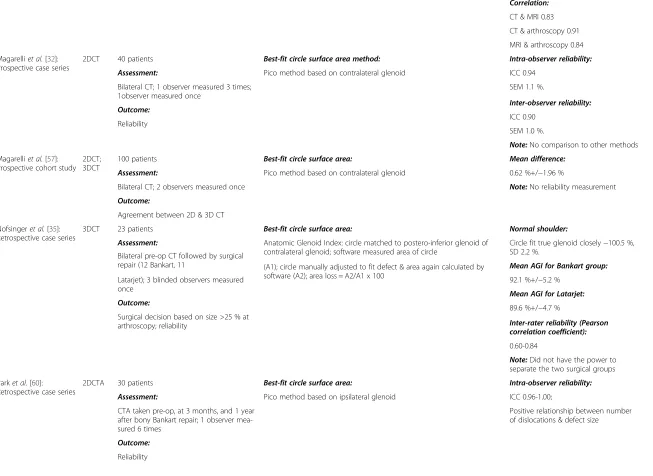
Table 2Studies Assessing Glenoid Surface Area Loss with CT and MRI(Continued)
Correlation:
CT & MRI 0.83
CT & arthroscopy 0.91
MRI & arthroscopy 0.84
Magarelliet al.[32]: Prospective case series
2DCT 40 patients Best-fit circle surface area method: Intra-observer reliability:
Assessment: Pico method based on contralateral glenoid ICC 0.94
Bilateral CT; 1 observer measured 3 times; 1observer measured once
SEM 1.1 %.
Outcome: Inter-observer reliability:
Reliability ICC 0.90
SEM 1.0 %.
Note:No comparison to other methods
Magarelliet al.[57]: Prospective cohort study
2DCT; 3DCT
100 patients Best-fit circle surface area: Mean difference:
Assessment: Pico method based on contralateral glenoid 0.62 %+/−1.96 %
Bilateral CT; 2 observers measured once Note:No reliability measurement
Outcome:
Agreement between 2D & 3D CT
Nofsingeret al.[35]: Retrospective case series
3DCT 23 patients Best-fit circle surface area: Normal shoulder:
Assessment: Anatomic Glenoid Index: circle matched to postero-inferior glenoid of contralateral glenoid; software measured area of circle
Circle fit true glenoid closely−100.5 %, SD 2.2 %.
Bilateral pre-op CT followed by surgical
repair (12 Bankart, 11 Mean AGI for Bankart group:
Latarjet); 3 blinded observers measured once
(A1); circle manually adjusted to fit defect & area again calculated by
software (A2); area loss = A2/A1 x 100 92.1 %+/−5.2 %
Outcome:
Mean AGI for Latarjet:
Surgical decision based on size >25 % at arthroscopy; reliability
89.6 %+/−4.7 %
Inter-rater reliability (Pearson correlation coefficient):
0.60-0.84
Note:Did not have the power to separate the two surgical groups
Parket al.[60]: Retrospective case series
2DCTA 30 patients Best-fit circle surface area: Intra-observer reliability:
Assessment: Pico method based on ipsilateral glenoid ICC 0.96-1.00;
CTA taken pre-op, at 3 months, and 1 year after bony Bankart repair; 1 observer mea-sured 6 times
Positive relationship between number of dislocations & defect size
Outcome:
Reliability
Saliken
et
al.
BMC
Musculosk
eletal
Disorders
(2015) 16:164
Page
8
of
Table 2Studies Assessing Glenoid Surface Area Loss with CT and MRI(Continued)
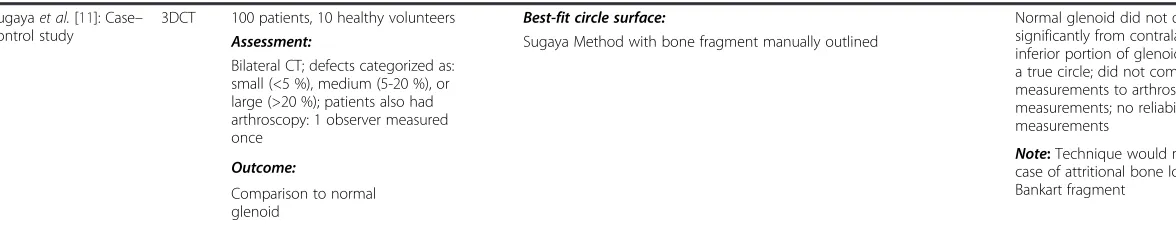
Sugayaet al.[11]: Case– control study
3DCT 100 patients, 10 healthy volunteers Best-fit circle surface: Normal glenoid did not differ significantly from contralateral glenoid; inferior portion of glenoid approximates a true circle; did not compare
measurements to arthroscopic measurements; no reliability measurements
Assessment: Sugaya Method with bone fragment manually outlined
Note:Technique would not work in case of attritional bone loss without a Bankart fragment
Bilateral CT; defects categorized as: small (<5 %), medium (5-20 %), or large (>20 %); patients also had arthroscopy: 1 observer measured once
Outcome:
Comparison to normal glenoid
List of Abbreviations:ICC: intraclass correlation coefficient; PE: percent error; SEM: standard error of measurement; R2
: coefficient of determination; AGI: anatomic glenoid index
Saliken
et
al.
BMC
Musculosk
eletal
Disorders
(2015) 16:164
Page
9
of
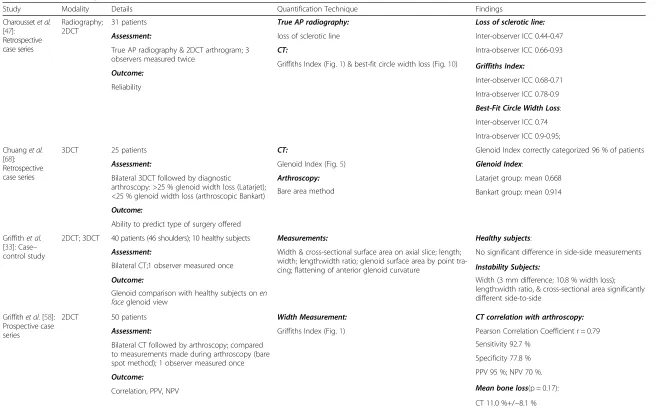
Table 3Studies Assessing Glenoid Width Loss with CT and MRI
Study Modality Details Quantification Technique Findings
Charoussetet al. [47]:
Retrospective case series
Radiography; 2DCT
31 patients True AP radiography: Loss of sclerotic line:
Assessment: loss of sclerotic line Inter-observer ICC 0.44-0.47
True AP radiography & 2DCT arthrogram; 3 observers measured twice
CT: Intra-observer ICC 0.66-0.93
Outcome:
Griffiths Index (Fig.1) & best-fit circle width loss (Fig.10) Griffiths Index:
Reliability Inter-observer ICC 0.68-0.71
Intra-observer ICC 0.78-0.9
Best-Fit Circle Width Loss:
Inter-observer ICC 0.74
Intra-observer ICC 0.9-0.95;
Chuanget al. [68]: Retrospective case series
3DCT 25 patients CT: Glenoid Index correctly categorized 96 % of patients
Assessment: Glenoid Index (Fig.5) Glenoid Index:
Bilateral 3DCT followed by diagnostic
arthroscopy: >25 % glenoid width loss (Latarjet); <25 % glenoid width loss (arthroscopic Bankart)
Arthroscopy: Latarjet group: mean 0.668
Outcome:
Bare area method Bankart group: mean 0.914
Ability to predict type of surgery offered
Griffithet al. [33]: Case– control study
2DCT; 3DCT 40 patients (46 shoulders); 10 healthy subjects Measurements: Healthy subjects:
Assessment: Width & cross-sectional surface area on axial slice; length; width; length:width ratio; glenoid surface area by point tra-cing; flattening of anterior glenoid curvature
No significant difference in side-side measurements
Bilateral CT;1 observer measured once Instability Subjects:
Outcome: Width (3 mm difference; 10.8 % width loss);
length:width ratio, & cross-sectional area significantly different side-to-side
Glenoid comparison with healthy subjects onen faceglenoid view
Griffithet al.[58]: Prospective case series
2DCT 50 patients Width Measurement: CT correlation with arthroscopy:
Assessment: Griffiths Index (Fig.1) Pearson Correlation Coefficient r = 0.79
Bilateral CT followed by arthroscopy; compared to measurements made during arthroscopy (bare spot method); 1 observer measured once
Outcome:
Sensitivity 92.7 %
Correlation, PPV, NPV
Specificity 77.8 %
PPV 95 %; NPV 70 %.
Mean bone loss(p = 0.17):
CT 11.0 %+/−8.1 %
Arthroscopy 12.3 %+/−8.8 %
Saliken
et
al.
BMC
Musculosk
eletal
Disorders
(2015) 16:164
Page
10
of
Table 3Studies Assessing Glenoid Width Loss with CT and MRI(Continued)
Griffithet al. [62]: Case– control study
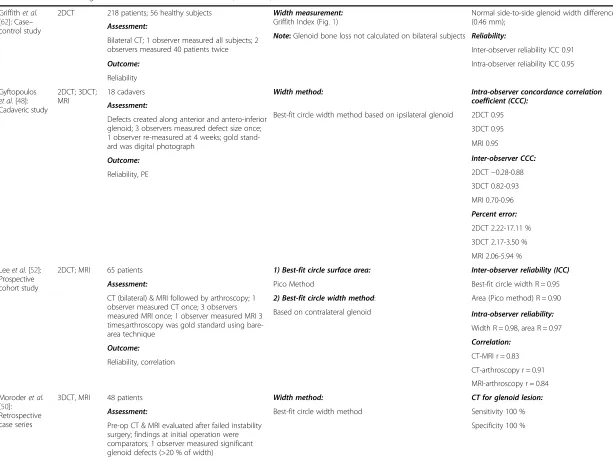
2DCT 218 patients; 56 healthy subjects Width measurement: Griffith Index (Fig.1)
Normal side-to-side glenoid width difference small (0.46 mm);
Assessment:
Note:Glenoid bone loss not calculated on bilateral subjects Reliability: Bilateral CT; 1 observer measured all subjects; 2
observers measured 40 patients twice Inter-observer reliability ICC 0.91
Outcome: Intra-observer reliability ICC 0.95
Reliability
Gyftopoulos et al.[48]: Cadaveric study
2DCT; 3DCT; MRI
18 cadavers Width method: Intra-observer concordance correlation
coefficient (CCC): Assessment:
Best-fit circle width method based on ipsilateral glenoid 2DCT 0.95 Defects created along anterior and antero-inferior
glenoid; 3 observers measured defect size once; 1 observer re-measured at 4 weeks; gold stand-ard was digital photograph
3DCT 0.95
Outcome:
MRI 0.95
Reliability, PE
Inter-observer CCC:
2DCT−0.28-0.88
3DCT 0.82-0.93
MRI 0.70-0.96
Percent error:
2DCT 2.22-17.11 %
3DCT 2.17-3.50 %
MRI 2.06-5.94 %
Leeet al.[52]: Prospective cohort study
2DCT; MRI 65 patients 1) Best-fit circle surface area: Inter-observer reliability (ICC)
Assessment: Pico Method Best-fit circle width R = 0.95
CT (bilateral) & MRI followed by arthroscopy; 1 observer measured CT once; 3 observers measured MRI once; 1 observer measured MRI 3 times;arthroscopy was gold standard using bare-area technique
2) Best-fit circle width method: Area (Pico method) R = 0.90
Outcome:
Based on contralateral glenoid Intra-observer reliability:
Reliability, correlation
Width R = 0.98, area R = 0.97
Correlation:
CT-MRI r = 0.83
CT-arthroscopy r = 0.91
MRI-arthroscopy r = 0.84
Moroderet al. [50]: Retrospective case series
3DCT, MRI 48 patients Width method: CT for glenoid lesion:
Assessment: Best-fit circle width method Sensitivity 100 %
Pre-op CT & MRI evaluated after failed instability surgery; findings at initial operation were comparators; 1 observer measured significant glenoid defects (>20 % of width)
Specificity 100 %
Saliken
et
al.
BMC
Musculosk
eletal
Disorders
(2015) 16:164
Page
11
of
Table 3Studies Assessing Glenoid Width Loss with CT and MRI(Continued)
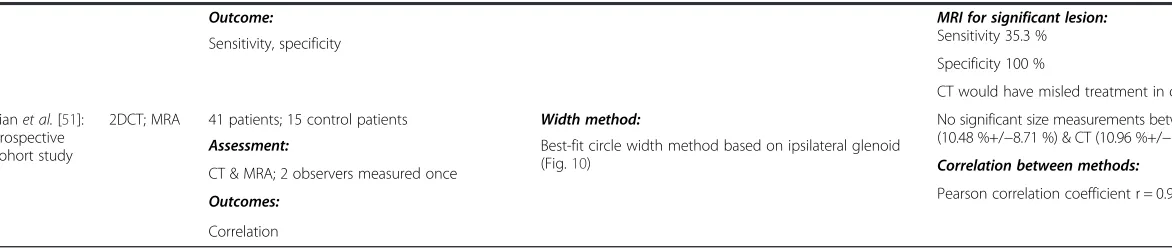
Outcome: MRI for significant lesion:
Sensitivity 35.3 % Sensitivity, specificity
Specificity 100 %
CT would have misled treatment in only 4.2 %
Tianet al.[51]: Prospective cohort study
2DCT; MRA 41 patients; 15 control patients Width method: No significant size measurements between MRA (10.48 %+/−8.71 %) & CT (10.96 %+/−9.0 %; p = 0.288). Assessment: Best-fit circle width method based on ipsilateral glenoid
(Fig.10) Correlation between methods:
CT & MRA; 2 observers measured once
Pearson correlation coefficient r = 0.921; SD 3.3 % Outcomes:
Correlation
List of Abbreviations:ICC: intraclass correlation coefficient; PE: percent error; PPV: positive predictive value; NPV: negative predictive value
Saliken
et
al.
BMC
Musculosk
eletal
Disorders
(2015) 16:164
Page
12
of
Table 4Studies Directly Comparing Imaging Methods for Assessing Glenoid Bone Loss
Study Modality Details Quantification Technique Findings
Bishopet al.[42]: Cadaveric study
Radiography; 2DCT; 3DCT; MRI
7 cadavers Observers measured bone loss using his/her usual
approach (Methods not specified)
Overall agreement with gold standard (kappa score):
Assessment:
3DCT 0.5 Serial imaging of shoulder after osteotomies of 0 %,
<12 %, 12-25 %, 25-40 %; manually measured glenoid width through bare area using a digital caliper (gold standard); 12 observers measured twice
CT 0.4
Outcome:
MRI 0.28
Reliability
Radiography 0.15
Intra-observer reliability (kappa):
3DCT 0.59
CT 0.64
MRI 0.51
Radiography 0.45
Note:3DCT highest agreement & 2nd highest intra-observer reliability; radiography lowest agreement & reliability
Boiset al.[63]: Laboratory study
2DCT; 3DCT Sawbones:1 model for anterior defect; 1 model for anteroinferior defect
2DCT & 3DCT: 2D CT methods (ICC, PE):
Assessment:
Indicators: linear width/length (W/L) ratio; defect length; quantifiers: glenoid index (injured glenoid inferior circle diameter relative to uninjured glenoid diameter)
Defect length: 0.81, 7.68
Osteotomies made at 0, 15 %, and 30 % of inferior glenoid circle diameter; gold standard measurement (3D laser scanner of model); 6 observers measured all 7 techniques 3DCT:
W/L ratio: 0.50,−16.34
Outcome: Quantifiers: linear ratio (d/R; d = radius to defect, R = circle radius); Pico method (3 variations):
Glenoid index, 0.3,−4.13
Reliability, PE
(1)Original circle method
3D CT (ICC, PE):
(2)Based on contralateral normal glenoid circle with 3 points of reference
Defect length: 0.90, 0.29
(3)Based on remaining intact glenoid cortex
W/L ratio: 0.88,−2.41
Glenoid index: 0.69, 0.01 (0.85, 3.39 with other software platform)
Linear ratio: 0.97, 29.9
Pico (1): 0.98, 4.93
Pico (2): 0.84, 7.32
Pico (3): 0.86, 12.14
Note:Pico method (1) based on the contralateral, intact glenoid and Glenoid Index on 3DCT were most reliable & accurate; Glenoid Index on 2DCT was deemed invalid
Saliken
et
al.
BMC
Musculosk
eletal
Disorders
(2015) 16:164
Page
13
of
Table 4Studies Directly Comparing Imaging Methods for Assessing Glenoid Bone Loss(Continued)
Rerkoet al.[44]: Cadaveric study
Radiography; 2DCT; 3DCT; MRI
7 cadavers Observers measured bone loss using his/her usual
approach (Methods not specified)
Accuracy (PE):
Assessment: 3DCT−3.3 %+/−6.6 %
Serial imaging of shoulder with osteotomies grouped as 0 %,<12 %, 12, 25 %, 25-40 %; gold standard defined as glenoid width using digital caliper; 2 radiologists & 2 ortho-paedic surgeons measured twice
2DCT−3.7 %+/−8.0 %
Outcome:
MRI−2.75 %+/−10.6 %
PE, reliability
Radiography−6.9 % +/−13.1 %
Intra-observer reliability (ICC):
3DCT 0.947
2DCT 0.927
MRI 0.837
Radiography 0.726
Inter-observer reliability (ICC):
3DCT 0.87-0.93
2DCT 0.82-0.89
MRI 0.38-0.85
Radiography 0.12-0.53
List of Abbreviations:ICC: intraclass correlation coefficient; PE: percent error
Saliken
et
al.
BMC
Musculosk
eletal
Disorders
(2015) 16:164
Page
14
of
Table 5Other Methods for Assessing Glenoid Bone Loss
Study Modality Details Quantification Technique Findings
De Filippoet al.[66]: Cadaveric study
2DCT 10 cadavers De Filipo Method: Fig.6 Curved MPR CT:
Assessment: Note:Curved MPR assessed curved structures very accurate
PE 1.03 %; inter-observer reliability (Cronbach alpha) 0.995
2 had anteroinferior defects created; 1 re-measured at 3 months; re-measured glenoid bone area on flat MPR & curved MPR of all 10 cadavers; laser scanner used directly on cadavers as gold standard; 3 radiologists measure once
Intra-observer reliability (ICC) 0.998
Outcome:
Flat MPR CT:
PE, reliability
PE 16.99 %
Inter-observer reliability (Cronbach alpha) 0.995
Note:Authors conclude curved gives more accurate glenoid contour
Diederichset al.[59]: Cadaveric study
3DCT 5 cadavers; 30 patients with no glenoid injury Manually traced out border of glenoid; volume and surface area calculated with measurements made manually (to calculate volume, depth was assumed to be 10 mm)
Coefficient of variation:
Assessment: Width 1.7 %
Glenoid width, height, surface area, & volume; osteotomy created on one cadaveric glenoid; compared to contralateral for calculation; 1 investigator measured study group; another measured the controls
Volume 1.3 %
Outcome:
Coefficient of varaition
Dumontet al.[49]: Technique description
CT; MRI Authors describe a new method to calculate surface area loss
Best-fit circle to inferior glenoid; measured angle (alpha) from center of circle between superior and inferior edges of lesion; converted measured angle to percentage area loss = [(alpha-sinalpha)/ 2π] x 100
No assessment of reliability or comparison to other methods
Note:This method avoids issues with defect orientation and is simple to apply without complicated software
Tauberet al.[56]; Retrospective case series
CT 10 patients with associated glenoid fracture (>21 % glenoid length)
Fit circle to outer glenoid, measured glenoid length at 45° angle (A), measured length to defect (B); calculated bone loss as: (A x 0.965– B)/A x 100
Inter-observer reliability:
Assessment:
ICC = 0.81
2 examiners measured once
Average width loss 26.2 %
Outcome:
Reliability
Van Den Bogaertet al.[69]: Cadaveric study
2DCT 20 cadavers Glenohumeral index: Glenohumeral Index Compared to Gold
Standard: Assessment: Maximal AP diameter of humeral head / maximal
AP diameter of glenoid (axial images) Non-significant difference Diameter measured with a digital caliper in vitro
(gold standard) followed by CT quantification; 3 observers measured once
Outcome:
Direct comparison
List of Abbreviations:ICC: intraclass correlation coefficient
Saliken
et
al.
BMC
Musculosk
eletal
Disorders
(2015) 16:164
Page
15
of
Table 6Studies Assessing Hill-Sachs Bone Loss with Radiography, CT and MRI
Citation Method Details Quantification Method Findings
Charoussetet al.[47]: Retrospective case series
Radiography 26 patients Quantitative assessment: P/R ratio reliability:
Assessment: P/R ratio on true AP radiography in internal rotation (Fig.10)
Inter-observer ICC 0.81-0.92
3 observers measured twice
Qualitative assessment:
Intra-observer ICC 0.72-0.97
Outcome:
True AP radiograph in external rotation (present or absent lesion)
Qualitative assessment reliability:
Reliability Inter-observer ICC 0–0.30
Intra-observer ICC 0.06-0.92
Note:Simple patient positioning and reliable
Itoet al.[38]: Retrospective case series
Radiography 27 patients (30 shoulders) Width and depth of Hill-Sachs lesion measured: Width difference (p > 0.05):
Assessment: Supine position; arm 135 ° flexion, 15 ° internal rotation; radiography beam perpendicular
Dislocation group 13.4 mm+/−2.5 mm
Divided into 2 groups: dislocation (11) and dislocation with recurrent subluxation (19); 1 observer measured once
Note:Patient positioning may be cumbersome and difficult to replicate in a clinical setting
With subluxation group 13.8+/−3.5 mm
Outcome:
Depth difference (p < 0.05):
Width difference
Dislocation group 3.9+/−0.9 mm
With subluxation group 2.1+/−1.0 mm
Note:Deeper lesions associated with subjective joint laxity but not number of dislocations
Kralingeret al.[39]: Retrospective cohort study
Radiography 166 patients Hill-Sachs Quotient: Recurrence rate associated with Hill-Sachs Quotient:
Assessment: Bernageau view and AP view at 60 ° internal rotation (Fig.8)
Grade I 23.3 %
1 observer measured once Grade II 16.2 %
Outcome: Grade III 66.7 %
Recurrence rate
Sommaireet al.[46]: Retrospective cohort study
Radiography 77 patients d/R ratio: Risk of recurrence (p = 0.016):
Assessment: True AP radiograph in internal rotation (similar to Charoussetet al.[2010]; Fig.9)
9.6 % in d/R ratio <20 %
Final clinical outcome after arthroscopic Bankart repair and imaging; 1 observer measured once
40 % in d/R ratio >20 %
Outcome:
Note:d/R ratio predictive of failure of arthroscopic Bankart repair
Need for revision repair
Hardyet al.[37]: Retrospective cohort study
Radiography; 2DCT
59 patients Radiograph 45 ° internal rotation view: d/R ratio (p < 0.01):
Assessment: Depth of defect/radius of humerus (d/R) ratio (similar to Charoussetet al.[2010])
Good/excellent group: 16.2 %
After arthroscopic stabilization divided into 2 groups based on Duplay clinical functional score: good/excellent (38) fair/poor (21); 1 observer measured all patients once; 10 observers measured 10 patients
CT:
Poor/fair group: 21.3 %
Saliken
et
al.
BMC
Musculosk
eletal
Disorders
(2015) 16:164
Page
16
of
Table 6Studies Assessing Hill-Sachs Bone Loss with Radiography, CT and MRI(Continued)
Outcome: Humeral head radius (best-fit circle to
circumference); defect width; defect depth (from edge of circle); defect length (amount of CT slices with the defect); lateralization angle (compared to AP line through center of head)
Mean volume of lesion (p < 0.001): Correlation of clinical score with radiographic
findings; surgical failure rate
Note:Radiographic technique easily obtained
Good/excellent group: 640 mm3 Poor/fair group: 2160 mm3 Surgical failure rate:
d/R >15 %: 56 % d/R < 15 %: 16 %
Presence of lesion, depth, lateralization angle, lesion, and humeral head volume ratio all non-significant between groups
Reliability:
Inter-observer reliability for depth and radius measurements non-significant
Kodaliet al.[72]: Laboratory study
2DCT 6 anatomic bone substitute models Circle fit to humeral head: Inter-observer reliability ICC:
Assessment: Width and depth measured on sagittal, axial, and coronal planes (similar to Saitoet al.(2009)
Depth - 0.879
Circular humeral head defects created; 2DCT width-depth measurements made in 3 planes and compared to the defect sizes measured by a 3D laser scanner
Width 0.721
Outcome:
Accuracy (PE):
5 observers measured once
Width: sagittal 10.9+/−8.6 %, axial 10.5+/−4.4 %, coronal 15.9+/−8.6 %;
Depth: sagittal 12.7+/−10.0 %, axial 16.7 +/−10.2 %,coronal 22.5+/−16.6 %
Saitoet al.[12]: Retrospective case-controls study
2DCT 35 patients; 13 normal Circle fit to the humeral head on axial slices: Mean size of Hill-Sachs lesion:
Assessment: Depth: greatest length of distance from floor of defect to edge of circle; width: measured between edges of defect
Depth 5.0+/−4.0 mm; width 22+/−6 mm
1 observer measured 3 times Intra-observer reliability:
Outcome: Pearson correlation coefficient: 0.954-0.998
Reliability Coefficient of variation: 0–7.4 %.
Choet al.[36]: Prospective cohort study
3DCT 104 patients (107 shoulders) Fit circle to articular surface of humeral head: Inter-observer reliability:
Assessment: Axial and coronal planes: width and depth measured on axial and coronal slice where lesion was largest
ICC 0.629-0.992 evaluated size, orientation, & location as means
to predict engagement; engagement defined arthroscopically; 1 observer measured 27 randomly selected shoulders 3 times; 2nd observer measured once
Intra-observer reliability:
Outcome:
ICC 0.845-0.998
Reliability, size of Hill-Sachs lesion relationship to engaging lesions
Size of Hill-Sachs lesion (axial):
Engaging group width 52 % & depth 14 %
Non-engaging group width 40 % & depth 10 % (both p <0.001)
Saliken
et
al.
BMC
Musculosk
eletal
Disorders
(2015) 16:164
Page
17
of
Table 6Studies Assessing Hill-Sachs Bone Loss with Radiography, CT and MRI(Continued)
Size of Hill-Sachs lesion (coronal):
Engaging group width 42 % & depth 13 %
Non-engaging group width 31 %, & depth 11 % (p = 0.012 & 0.007 respectively).
Note:Orientation of Hill-Sachs angle significantly higher in engaging lesions
Kawasakiet al.[73]: Modeling
3DCT Evaluated 7 CT scans of bilateral shoulders Created 3D contour; mirrored the normal shoulder and overlap contours; computer measured defect difference
Proposed a method to calculate humeral head bone loss
Kirkleyet al.[70]: Prospective case series
MRI 16 patients Hill-Sachs lesions were categorized as small (<1 cm) or large (>1 cm);
Presence vs. absence of Hill-Sachs lesion: Assessment:
Note:Did not clarify slice or dimensions measured to determine Hill-Sachs lesion size
Kappa = 1
MRI followed by arthroscopic evaluation; 2 observers measured once
Distinguishing small from large lesion: Kappa = 0.44
Outcome: Not able to accurately quantify size
Reliability
Salomonssonet al.[71]: Prospective cohort study
MRI 51 patients Hill-Sachs depth: Size of Hill-Sachs lesion:
Assessment: Measured on axial slice at largest point Stable group 5 mm; unstable group 3 mm (non-significant)
MRI immediately and clinical follow-up to 105 months; divided into stable and unstable (re-current instability); 2 observers measured once
Outcome:
Size of Hill-Sachs lesion correlation with recurrent instability
List of Abbreviations:ICC: intraclass correlation coefficient; PE: percent error
Saliken
et
al.
BMC
Musculosk
eletal
Disorders
(2015) 16:164
Page
18
of
32, 33, 35, 42–51, 54–69]. For Hill-Sachs bone loss,
radi-ography was evaluated in 5 studies [37–39, 46, 47], MRI
in 2 studies [70, 71], and CT in 5 studies [23, 36, 72–74].
Glenoid imaging Radiography
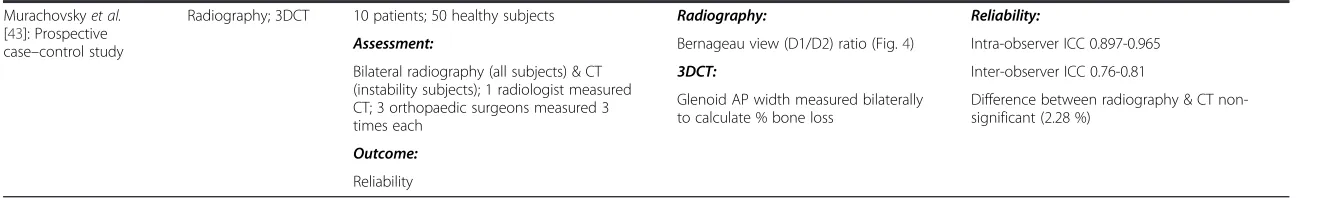
Routine radiographic views (true AP and axillary) were found to have lower accuracy and reliability in calculat-ing glenoid bone loss (Table 1) [18, 42, 44, 45, 47]. Spe-cial radiographic views on the other hand, in particular the Bernageau profile view (Fig. 4), had better accuracy and reliability scores [18, 43, 46]. The Bernageau profile had an intra-observer intraclass correlation coefficient (ICC) 0.897-0.965 and inter-observer ICC 0.76-0.81 compared to a true AP radiograph with an intra-observer ICC 0.66-0.93 and inter-intra-observer ICC 0.44-0.47
[43, 47]. Sommaireet al.demonstrated failure of Bankart
repair when the width loss was 5.3 % compared to no failure with width loss 4.2 % using the Bernageau view (p = 0.003), although no clinically relevant threshold was defined [46]. A true AP radiograph was found to be spe-cific (100 %) but not sensitive (54-65 %) for detecting a large glenoid bone lesion [45].
CT and MRI
Surface area loss measurements
The surface area loss methods vary in the manner to which a circle is approximated to the inferior glenoid -based on either contralateral glenoid or intact posteroin-ferior margins of injured glenoid - but will be grouped together in this review as best-fit circle surface area methods (Fig. 10) (BCSA). The Pico Method (Fig. 2) is a BCSA based on the contralateral glenoid described by
Baudi et al. [75]. The Pico Method has demonstrated
good inter-observer (ICC 0.90) and intra-observer (ICC 0.94, 0.96-1.0) reliability as well as a low coefficient of
variation (2.2-2.5 %) [32, 60, 65]. Magarelli et al. (mean
difference between two-dimensional CT [2DCT] and three-dimensional CT [3DCT] 0.62 %+/−1.96 %) showed the method could be applied accurately with both 2DCT and 3DCT [32]. The previous article used software to
cal-culate the surface area lost, but Barchillonet al.
demon-strated that a BCSA method similar to the Pico Method could be applied using 3DCT, a femoral head gauge, and
applying a mathematical formula [20]. Milanoet al.
dem-onstrated that using the Pico Method, recurrent disloca-tion was associated with defects greater than 20 %. [55]
Huijsmans et al.showed that a BCSA method could be
used by MRI with similar accuracy to 3DCT [21].
Nof-singeret al.used a method termed the Anatomic Glenoid
Index (see Table 2 for description) in an attempt to retro-spectively predict which surgical procedure an instability patient would receive but were unable to separate the two groups with their method [35].
Fig. 4Bernageau Radiography.a)Patient positioning. b)Antero-posterior glenoid width measurement on this view (Murachovskyet al.[43])
[image:19.595.304.538.88.665.2]Width loss measurements
Griffith et al. created the Griffith Index using bilateral
shoulder CT scans (Fig. 1) as one of the first width loss techniques and it has been found to be reliable and ac-curate [33, 47, 58]. A method similar to the Griffith Index, termed the Glenoid Index (Fig. 5) was shown to accurately predict if a patient would require a Latarjet procedure 96 % of the time [68]. Other width loss meas-urement methods have measured width loss from a cir-cle approximated to the inferior glenoid (based on either contralateral or ipsilateral glenoid) and have been found to have good reliability and accuracy (Table 3) [47, 48, 50, 52]. Evidence is conflicting with respect to whether width loss
measurements can be applied to MRI. Tianet al.suggested
volumetric interpolated breath-hold examination (VIBE) magnetic resonance arthrography (MRA) was as accurate
as 2DCT and Leeet al.found a correlation between 2DCT
and MRI of r = 0.83 and the difference in accuracy was
1.3 % for width loss measurements [51, 52]. Moroderet al.
found that MRI (35 % sensitive, 100 % specific) was not as sensitive as 3DCT (100 % sensitive, 100 % specific) for
de-tecting a significant bone lesion [50]. Gyftopoulous et al.
found 3DCT was more accurate than 2DCT and MRI (per-cent error 3DCT 2.17-3.5 %, 2DCT 2.22-17.1 %, MRI 2.06-5.94 %) although the difference was not significant and they concluded that MRI could accurately measure glenoid bone loss [48].
Comparative studies
A few studies directly compared imaging modalities and
methods (Table 4). Bishopet al.found 3DCT had the highest
accuracy (agreement kappa 0.5) and second highest intra-observer reliability (intra-intra-observer kappa 0.59) while radiog-raphy (agreement kappa 0.15, intra-observer kappa 0.45) had the lowest in a comparison of radiography, 2DCT, 3DCT,
and MRI [42]. Rerko et al. also found that 3DCT was the
most accurate (percent error [PE] -3.3 % +/−6.6 %) and reli-able (inter-observer ICC 0.87-0.93) method compared to
radiography (PE−6.9 %; ICC 0.12-0.53), 2DCT (PE−3.7 %;
ICC 0.82-0.89), and MRI (PE−2.75 %; ICC 0.38-0.85) [44].
Boiset al.evaluated 7 measurement techniques using 2DCT and 3DCT and found that the Pico Method based on the contralateral, intact glenoid (inter-observer ICC 0.84; PE 7.32) and Glenoid Index using 3DCT (ICC 0.69; PE 0.01) were the most reliable and accurate methods [63].
Other glenoid bone loss methods
Results are presented in Table 5. Dumontet al. used an
arc angle to determine percent surface area loss but have not tested the method clinically [49]. De Filipoet al. cre-ated a new technique using curved multiplanar recon-struction (MPR), a CT technique generally used for vascular studies for its ability to follow curved surfaces, and found it was more accurate than flat MPR in
meas-uring surface area loss (Fig. 6) [66]. Diederichs et al.
expressed bone loss in terms of volume using 3D com-puter software to mirror the contralateral normal glen-oid and found good accuracy in a cadaveric study [59].
Sommaire et al. used Gerber’s Index and found that a
threshold of 40 % bone loss was associated with recur-rent instability (Fig. 7) [46].
Hill-Sachs imaging
Radiography Results are presented in (Table 6). Ito et al. positioned patients supine with the shoulder in 135 ° flexion and 15 ° of internal rotation to obtain a view of the posterolateral notch and calculate depth and width of the Hill-Sachs lesion but reliability was not
ex-plored [38]. Kralingeret al.calculated a Hill-Sachs
Quo-tient (Fig. 8) by measuring depth and width on a true AP radiograph with the arm in 60 ° internal rotation and
Fig. 5Glenoid Index. The Glenoid Index is calculated from injured width/normal width. Chuanget al.use the parameters of the normal glenoid to normalize the pre-injury glenoid width accounting for any height difference between shoulders. They then compare the ratio of post-injury width to pre-injury width. Although demonstrated here using 2D CT, the description of the Glenoid Index by Chuanget al.involves 3DCT. (Adapted from Chuanget al.[68])
[image:20.595.56.541.534.684.2]length on a Bernageau profile [39]. Recurrence rate was noted to be higher with a larger quotient (Grade I 23.3 %; grade II 16.2 %; grade III 66.7 %) although the reliability and accuracy have not been tested.
A technique of creating a ratio using the Hill-Sachs de-fect depth and humeral head radius (d/R) on a true AP radiograph with the arm in internal rotation has been found to be reliable and clinically relevant (Fig. 9).
Char-oussetet al. demonstrated inter- and intra-observer
reli-ability ICC 0.81-0.92 and 0.72-0.97 respectively with this
technique [47]. Sommaire et al. retrospectively found the
recurrence rate of GHI was 40 % when d/R >20 %
com-pared to 9.6 % when d/R <20 %, while Hardyet al.found
arthroscopic stabilization failure rate was 56 % when d/R > 15 % compared to 16 % when d/R <15 % [37, 46].
CT and MRI
Hardyet al.measured the volume of the defect on axial
slices using width, depth, and length and found a signifi-cantly larger defect volume in patients with lower Duplay functional scores but did not evaluate reliability
[37]. Saito et al. and Cho et al. both measured defect
depth and width on the axial slice where the lesion was
largest [23, 36]. Saitoet al.found intra-observer Pearson
correlation coefficients of 0.954-0.998 using 2DCT. Cho et al. found inter- and intra-observer reliability ICC of 0.772-0.996 and 0.916-0.999 respectively for depth and
width measurements on 2DCT. Cho et al. also showed
that the size of engaging Hill-Sachs lesions were
signifi-cantly larger than non-engaging lesions. Kodali et al.
evaluated the reliability and accuracy of 2DCT with an anatomic model and showed inter-observer reliability ICC 0.721 and 0.879 for width and depth respectively. The accuracy was highest in axial slices but there was still a percent error of 13.6+/−8.4 % [72].
Two studies evaluated MRI for quantifying Hill-Sachs
lesions. Salomonssonet al.measured the depth of the
le-sion but were not able to show a significant difference between stable and unstable shoulders that were treated
non-operatively [71]. Kirkleyet al.tested the agreement
between MRI and arthroscopy for the quantification of Hill-Sachs size [70]. They showed moderate agreement
(Cohen’s kappa value 0.444) for the size of the lesion as
normal, less than 1 cm, or greater than 1 cm.
Discussion
Glenohumeral bone loss is a key factor in predicting re-current instability following traumatic anterior shoulder dislocation. Increasing size of glenoid and Hill-Sachs lesions are associated with higher failure rates of arthro-scopic Bankart repairs. Clinical and biomechanical stud-ies have attempted to determine threshold values of Fig. 7Gerber Index. The Gerber Index calculates bone loss based on
a ratio of length of glenoid defect and diameter of glenoid. (Adapted from Sommaireet al.[46])
Fig. 6Glenoid bone loss calculated with De Filippo method using CT curved MPR. Normal right glena (a; 6.87 sq. cm), left glena with deficiency (b; 5.49 sq. cm)
[image:21.595.57.540.89.244.2] [image:21.595.58.290.495.694.2]glenohumeral bone loss to use in preoperative planning. Radiography, CT, and MRI have all been explored as imaging modalities for quantification of these glenohum-eral bone lesions, with CT being studied most exten-sively. Within each modality a number of methods have been proposed to quantify the bone loss. There is still a need for further investigation to determine the best mo-dality and method but significant progress has been made since 2000.
Radiography appears to have a role in screening pa-tients for glenoid bone loss; standard radiographic views are straightforward for imaging technicians to obtain but their accuracy is low compared to CT and MRI [42]. Specialized radiographic views are more accurate; how-ever they may be difficult to reproduce clinically due to patient discomfort or apprehension [74]. Slight devia-tions in gantry orientation or arm positioning may also obscure the bony details [47].
Two general methods emerged when quantifying glen-oid bone loss using advanced imaging, width and surface area methods. Each of these methods uses humeral head
subtraction and reconstruction to obtainen faceviews of
the glenoid. Because bone loss occurs anteriorly, width methods measure the bone loss in this anterior-posterior dimension in the inferior 2/3 of the glenoid. Jiet al.state that this measurement should be made specifically at 03:20 on a clock face, the most common location of bone loss [13]. The bone loss in the width methods is expressed compared to the pre-injury glenoid. Some authors have used CT scans of the contralateral, uninjured shoulder to
Fig. 9Humeral head depth:radius ratio (d/R). On a true AP x-ray with internal rotation, a circle template is fit to the contour of the articular surface of the humeral head and the depth of Hill-Sachs bone loss is measured. (Adapted from Sommaireet al.[46])
Fig. 8Hill-Sachs Quotient.a)True AP x-ray of the humerus with the shoulder in 60° internal rotation to measure the width (x) and depth (y) of the lesion.b)Bernageau profile view to measure the length (z) of the lesion. The Hill-Sachs Quotient is calculated by multiplying x, y and z. Grade: I <1.5 cm2; II 1.5-2.5 cm2; III > 2.5 cm2(Adapted from Kralingeret al.[39])
[image:22.595.57.290.84.540.2] [image:22.595.308.540.88.422.2]obtain the pre-injury width. Others have approximated the pre-injury width by using the intact inferior edges of the injured glenoid to place a circle. Earlier studies sug-gested that either form of calculating the width loss was adequate, although newer studies have found that using bilateral CT is more accurate [42, 63]. The Glenoid Index (Fig. 5) is the most accurate width measurement method. Surface area methods function by approximating a circle to the inferior glenoid in the same manner as the width methods then finding the area missing. The surface area methods have been studied frequently and have good to excellent reliability [32, 60, 65]. Initially computer software was required to calculate the surface area; however
Barchillon et al. showed that one could use a femoral
gauge in a clinical setting and still produce accurate re-sults [20]. Comparative studies suggest that the Pico Method based on bilateral CT scans is most accurate and reliable, particularly when using 3DCT versus 2DCT [42, 48, 63]. The accuracy of the Pico method may be affected in part due to the curved nature and concavity of the
glen-oid. De Felippoet al.have attempted to address this with
their De Felippo method that utilizes curved MPR. This was shown to have low interobserver variability and a high correlation with their reference standard. Evidence is cur-rently equivocal if MRI can be used to calculate glenoid bone loss using width and surface area methods in a clin-ical setting [48, 50, 61]. In comparative studies, CT was found to be more accurate than MRI [42, 48].
Radiography has been shown to be useful in quantify-ing Hill-Sachs bone loss. Creatquantify-ing a depth/radius ratio on a true AP radiograph with internal rotation is reliable and shown to be clinically relevant, although the accur-acy has not been clarified [37, 46, 47]. CT imaging has been used to quantify depth, width, and volume of the
lesion. It appears the reliability of CT is good but its ac-curacy is questionable, often underestimating the size of the lesion [72]. A complicating factor in determining the significance of a Hill-Sachs lesion is the role its orienta-tion plays. More horizontal lesions tend to engage the glenoid lesion and incorporating this factor along with the size is likely important but has not been determined
yet [36]. Walia et al.have explored how Hill-Sachs and
glenoid lesions interact and engage theoretically and concluded that combined bony defects reduced stability more than expected based on isolated defects alone [30]. The exact way they reduce stability and how to calculate this clinically is unknown.
This study is limited by its qualitative nature. Because the literature has evaluated multiple methods and mo-dalities with different statistical tools it is difficult to pool data and achieve a clear answer of which method is the best. However, this may guide future prospective studies into which method to apply. There was a trend to use either a width or surface-area method, each of which can be applied with the same imaging data set ob-tained from a CT or MRI. Comparing these methods and correlating with surgical results may give an answer to the best imaging method.
Conclusions
Our scoping review has synthesized the current evidence regarding imaging techniques to quantify glenoid and Hill-Sachs bone loss. A number of modalities and methods have been explored to quantify glenoid bone loss. Radiography does not appear to have the accuracy required for pre-operative planning but may play a role in screening patients that would require advanced im-aging. The Bernageau profile view to calculate AP glen-oid width is the most accurate radiograph. CT is the most accurate modality but the risk of radiation expos-ure, particularly when using methods that require bilat-eral imaging, needs to be considered. Of the methods used with CT, the Glenoid Index is the most accurate and reliable width method while the Pico Method is the most accurate and reliable surface area method. The Glenoid Index requires bilateral shoulder CT and the Pico Method is most accurate when applied using bi-lateral CT but may also be applied with unibi-lateral im-aging. There are equivocal findings about the accuracy or MRI compared to CT and this needs to be clarified by future studies.
[image:23.595.57.289.88.269.2]A consensus measurement technique for calculating Hill-Sachs bone loss or a threshold size for predicting re-current instability has not yet been established. Larger lesions, at least >25 % of the humeral head diameter, ap-pear to increase risk of recurrent instability in biomech-anical studies [24]. Calculating a depth:radius radio on a true AP radiograph with the arm internally Fig. 10Best-Fit Circle Width Loss. A circle is approximated to the
inferior glenoid and the expected diameter of the circle is compared to the defect width
rotated is inexpensive, easy to obtain, and predicts recurrence with good reliability when >20 %. How-ever, its accuracy has not yet been established. Meas-uring the depth and width on axial slices of a CT scan have good to excellent reliability and have been associated with engaging Hill-Sachs lesions. However the role of CT in predicting recurrence has not been determined.
Ease of calculation, radiation exposure, experience of interpreting radiologist or surgeon, and software avail-ability are factors that should be considered when deter-mining which method will be used. Finally, glenoid and Hill-Sachs bone loss may need to be evaluated together as the manner in which these lesions interact is complex and requires further study.
Additional file
Additional file 1:Appendix 1_BMC.docx; This is a Microsoft Word file that contains the Search Strategy for the scoping review.
Abbreviations
2DCT:Two-dimensional computed tomography; 3DCT: Three-dimensional computed tomography; BCSA: Best-fit circle surface area; d/R: Hill Sachs defect depth and humeral head radius; CT: Computed tomography; GHI: Glenohumeral instability; ICC: Intraclass correlation coefficient; MPR: Multiplanar reconstruction; MRA: Magnetic resonance arthrography; MRI: Magnetic resonance imaging; PE: Percentage error; VIBE: Volumetric interpolated breath-hold examination.
Competing interests
The authors declare that they have no competing interests.
Authors’contributions
DJS, TB, MB, DMS, LB contributed to study concept and design; DS and TB performed data acquisition; DJS, TB, MB, DMS, LB contributed to data analysis, interpretation and drafting and revising the manuscript. All authors read and approved the final draft of the manuscript.
Acknowledgements
LB receives salary support from the Canadian Institutes of Health Research as a New Investigator (Patient Oriented Research) and Alberta Innovates Health Solutions as a Population Health Investigator.
DMS, MB and LB are members of the Shoulder and Upper Extremity Research Group of Edmonton (SURGE).
Author details
1Department of Surgery, University of Alberta, 6-110 CSB, 8440-112 Street
NW, Edmonton, AB T6G 2B7, Canada.22-50 Corbett Hall, Department of Physical Therapy, University of Alberta, Edmonton, AB T6G 2G4, Canada.
Received: 17 December 2014 Accepted: 28 May 2015
References
1. Hovelius L, Olofsson A, Sandstrom B, et al. Nonoperative treatment of primary anterior shoulder dislocation in patients forty years of age and younger. a prospective twenty-five-year follow-up. J Bone Joint Surg Am. 2008;90:945–52.
2. Mclaughlin HL, Cavallaro WU. Primary anterior dislocation of the shoulder. Am J Surg. 1950;80:615–21.
3. Simonet WT, Cofield RH. Prognosis in anterior shoulder dislocation. Am J Sports Med. 1984;12:19–24.
4. Hobby J, Griffin D, Dunbar M, Boileau P. Is arthroscopic surgery for stabilisation of chronic shoulder instability as effective as open surgery? A
systematic review and meta-analysis of 62 studies including 3044 arthroscopic operations. J Bone Joint Surg (Br). 2007;89:1188–96.
5. Voos JE, Livermore RW, Feeley BT, et al. Prospective evaluation of arthroscopic bankart repairs for anterior instability. Am J Sports Med. 2010;38:302–7. 6. Ide J, Maeda S, Takagi K. Arthroscopic bankart repair using suture anchors in
athletes: Patient selection and postoperative sports activity. Am J Sports Med. 2004;32:1899–905.
7. Flinkkila T, Hyvonen P, Ohtonen P, Leppilahti J. Arthroscopic bankart repair: Results and risk factors of recurrence of instability. Knee Surg Sports Traumatol Arthrosc. 2010;18:1752–8.
8. Owens BD, Dawson L, Burks R, Cameron KL. Incidence of shoulder dislocation in the united states military: Demographic considerations from a high-risk population. J Bone Joint Surg Am. 2009;91:791–6.
9. Randelli P, Ragone V, Carminati S, Cabitza P. Risk factors for recurrence after bankart repair a systematic review. Knee Surg Sports Traumatol Arthrosc. 2012;20:2129–38.
10. Thomazeau H, Courage O, Barth J, et al. Can we improve the indication for bankart arthroscopic repair? A preliminary clinical study using the ISIS score. Orthop Traumatol Surg Res. 2010;96(8 Suppl):S77–83.
11. Sugaya H, Moriishi J, Dohi M, Kon Y, Tsuchiya A. Glenoid rim morphology in recurrent anterior glenohumeral instability. J Bone Joint Surg Am. 2003;85-A:878–84.
12. Saito H, Itoi E, Sugaya H, Minagawa H, Yamamoto N, Tuoheti Y. Location of the glenoid defect in shoulders with recurrent anterior dislocation. Am J Sports Med. 2005;33:889–93.
13. Ji J, Kwak D, Yang P, Kwon MJ, Han S, Jeong J. Comparisons of glenoid bony defects between normal cadaveric specimens and patients with recurrent shoulder dislocation: An anatomic study. J Shoulder Elbow Surg. 2012;21:822–7.
14. Burkhart SS, De Beer JF. Traumatic glenohumeral bone defects and their relationship to failure of arthroscopic bankart repairs: Significance of the inverted-pear glenoid and the humeral engaging hill-sachs lesion. Arthroscopy. 2000;16:677–94.
15. Burkhart SS, Debeer JF, Tehrany AM, Parten PM. Quantifying glenoid bone loss arthroscopically in shoulder instability. Arthroscopy. 2002;18:488–91.
16. Itoi E, Lee SB, Berglund LJ, Berge LL, An KN. The effect of a glenoid defect on anteroinferior stability of the shoulder after bankart repair: A cadaveric study. J Bone Joint Surg Am. 2000;82:35–46.
17. Gerber C, Nyffeler RW. Classification of glenohumeral joint instability. Clin Orthop Relat Res. 2002;400:65–76.
18. Itoi E, Lee SB, Amrami KK, Wenger DE, An KN. Quantitative assessment of classic anteroinferior bony bankart lesions by radiography and computed tomography. Am J Sports Med. 2003;31:112–8.
19. Yamamoto N, Itoi E, Abe H, et al. Effect of an anterior glenoid defect on anterior shoulder stability: A cadaveric study. Am J Sports Med. 2009;37:949–54.
20. Barchilon VS, Kotz E, Barchilon Ben-Av M, Glazer E, Nyska M. A simple method for quantitative evaluation of the missing area of the anterior glenoid in anterior instability of the glenohumeral joint. Skeletal Radiol. 2008;37:731–6.
21. Huijsmans PE, Haen PS, Kidd M, Dhert WJ, van der Hulst VPM, Willems WJ. Quantification of a glenoid defect with three-dimensional computed tomography and magnetic resonance imaging: A cadaveric study. J Shoulder Elbow Surg. 2007;16:803–9.
22. Yiannakopoulos CK, Mataragas E, Antonogiannakis E. A comparison of the spectrum of intra-articular lesions in acute and chronic anterior shoulder instability. Arthroscopy. 2007;23:985–90.
23. Saito H, Itoi E, Minagawa H, Yamamoto N, Tuoheti Y, Seki N. Location of the hill-sachs lesion in shoulders with recurrent anterior dislocation. Arch Orthop Trauma Surg. 2009;129(10):1327–34.
24. Kaar SG, Fening SD, Jones MH, Colbrunn RW, Miniaci A. Effect of humeral head defect size on glenohumeral stability: A cadaveric study of simulated hill-sachs defects. Am J Sports Med. 2010;38:594–9.
25. Sekiya JK, Wickwire AC, Stehle JH, Debski RE. Hill-sachs defects and repair using osteoarticular allograft transplantation: Biomechanical analysis using a joint compression model. Am J Sports Med. 2009;37(12):2459–66.
26. Sekiya JK, Jolly J, Debski RE. The effect of a hill-sachs defect on glenohumeral translations, in situ capsular forces, and bony contact forces. Am J Sports Med. 2012;40:388–94.