Area socioeconomic status and mortality after
coronary artery bypass graft surgery: The role of
hospital volume
Catherine Kim, MD, MPH,a,bAna V. Diez Roux, PhD,cTimothy P. Hofer, MD, MS,d,e
Brahmajee K. Nallamothu, MD, MPH,d,fSteven J. Bernstein, MD, MPH,d,fand Mary A.M. Rogers, PhDg
Ann Arbor, MI
Background
Individuals of low socioeconomic status (SES) have reduced access to coronary artery bypass graftsurgery (CABG). It is unknown if low-SES CABG patients have reduced access to hospitals with better outcomes.
Methods
We conducted a retrospective cohort analysis of the California CABG Mortality Reporting Program, consistingof individuals with zip code information who underwent CABG at participating hospitals in 1999-2000 (n = 18 961). Primary outcome measures were inhospital mortality after CABG; primary independent variables of interest were area-level SES, clinical risk factors, and hospital volume. We used 2-level hierarchical random-effects logit models to estimate the relationship between explanatory variables and inhospital mortality.
Results
Within high-volume hospitals, patients of low-SES areas had greater mortality than those of mid- and high-SES areas (2.5% vs 1.5% vs 1.8%,P= .024). However, there was no relationship between SES and mortality in lower-volume hospitals. Contrary to expectations, individuals of high-SES areas (42%) underwent surgery at low-volume hospitals more often than patients of low-SES areas (28%,Pb.001), although mortality at low-volume hospitals was greater than that at high-volume facilities (Pb.001). Discrepancies were not explained by distance traveled.Conclusions
Mortality after CABG is modified by both SES and hospital volume. Within high-volume hospitals,patients of low-SES areas fared worse than patients of higher-SES areas. Patients of high SES tended to have CABG surgery at low-volume hospitals where mortality was greater and therefore had higher mortality than expected. (Am Heart J 2007;154:385290.)
Lower socioeconomic status (SES) is associated with greater cardiovascular mortality.1Individuals with lower SES have relatively limited access to cardiovascular procedures, including coronary artery bypass graft surgery (CABG).2,3For those who undergo CABG, lower
SES may also be associated with greater mortality after CABG.4One possible explanation is that individuals with lower SES have more severe cardiovascular risk factors that may increase their risk of mortality after CABG.5
It is also possible that among CABG recipients, individuals with lower SES receive poorer quality of care, with consequent effects on subsequent outcomes. Specifically, in the case of CABG, patient SES may be associated with the hospital where the procedure is performed. High-volume CABG hospitals have better surgical procedure outcomes presumably because of better quality of perioperative care and other health system factors.6-9Patients of lower SES might be less able than patients of higher SES to choose high-volume CABG hospitals for a variety of reasons, including lack of knowledge regarding hospital quality and lack of empowerment to choose hospitals. Other potential barriers to high-volume hospitals include the fact that high-volume hospitals tend to be located in neighbor-hoods that are less socioeconomically disadvantaged and tend to treat patients with non-Medicaid insurance.10 Patients of lower SES are more often minorities, particularly African American; and racial disparities in From thea
Division of General Internal Medicine, Department of Medicine, University of Michigan, Ann Arbor, MI,bDepartment of Obstetrics and Gynecology, University of
Michigan, Ann Arbor, MI,c
Department of Epidemiology, Robert Wood Johnson Health and Society Scholars Program, University of Michigan School of Public Health, Ann Arbor, MI,d
Department of Veterans Affairs, VA Center for Practice Management and Outcomes Research, VA Ann Arbor Healthcare System, Ann Arbor, MI,eDepartment of
Internal Medicine, Michigan Diabetes Research and Training Center, The Robert Wood Johnson Clinical Scholars Program, University of Michigan, School of Medicine, Ann Arbor, MI,f
Department of Internal Medicine, University of Michigan School of Medicine, Ann Arbor, MI, andgDivision of General Internal Medicine, Department of Medicine,
Patient Safety Enhancement Program, University of Michigan School of Medicine, Ann Arbor, MI.
This study was supported by a grant from the Robert Wood Johnson Health and Society Scholars Program, the American Diabetes Association, and NIDDK K23-DK071552. Submitted January 29, 2007; accepted April 1, 2007.
Reprint requests: Catherine Kim, MD, MPH, 300 NIB, Room 7C13, Box 0429, Ann Arbor, MI 48109.
E-mail: cathkim@umich.edu 0002-8703/$ - see front matter
hospital selection and CABG outcomes may exist.11-13To our knowledge, the associations between patient SES, hospitals where CABG is performed, and CABG mortality have not been studied.
Therefore, we conducted a retrospective cohort study to examine the associations between area-level SES and inhospital mortality after CABG in the California CABG Mortality Reporting Program (CCMRP). We hypothe-sized that persons from lower-SES areas would have greater inhospital mortality after CABG than persons from higher-SES areas and that the explanations for this would include their greater clinical risk as well as greater rates of surgery at low-volume CABG hospitals.
Methods
Setting and study population
Data were collected as part of the CCMRP.14,15This registry, based on the Society of Thoracic Surgeons Template, contains information collected from 75 California hospitals on 20 864 participants who underwent isolated CABG (ie, concomitant valve or aortic surgery was excluded) between January 1, 1999, and December 31, 2000. Trained abstractors performed a comprehensive and detailed clinical data extraction. Accuracy of the CCMRP data was assured through an independent, external audit of 1006 medical records at 26 of the participat-ing hospitals includparticipat-ing all facilities identified as outliers based
on inhospital mortality rates. The California Office of Statewide Health Planning and Development provided limited CCMRP data for this study after institutional review board approval.
SES and hospital volume
Of the 20 864 patients, we excluded 1892 (9%) who were missing zip code information and 11 for whom sex was missing. The remaining 18 961 patients were included in this analysis. To obtain area measures of SES, we linked patient zip codes with the 2000 US Census data. For each participant, we created a standardized summarized SES score orzscore based on the level of 6 indices in their zip code of residence:16,17(a) education (percentage completed high school for population
z25 years old, percentage completed college for population
z25 years old), (b) income (log of median household income; log of median value of housing units; percentage of households receiving interest, dividend, or net rental income), and (c) occupation (percentage executive, managerial, or professional specialty occupations for employed populationz16 years old).
[image:2.580.44.538.105.392.2]In our population, the median percentage of adults who had completed high school was 82%, median percentage of adults who had completed college was 23%, median household income was $47 970, median value of housing units was $197 300, median receiving rental income was 36%, and median employed in executive/managerial/professional occu-pations was 34%. We categorized thezscore into tertiles (low, medium, and high), with a greaterzscore representing higher SES. Using zip code epicenters, we calculated the distance
Table I. Characteristics of patients undergoing CABG, by area-level measures of SES
Characteristic
Low SES Middle SES High SES
P
n = 6286 n = 6349 n = 6326
Age, y b.001
b60 1750 (27.8%) 1727 (27.2%) 1628 (25.7%)
60-69 2054 (32.7%) 1969 (31.0%) 1913 (30.2%)
70-79 2010 (32.0%) 2116 (33.3%) 2145 (33.9%)
z80 472 (7.5%) 537 (8.5%) 640 (10.1%)
Female sex 1954 (31.1%) 1737 (27.4%) 1455 (23.0%) b.001
Nonwhite (includes Hispanic) 2309 (36.7%) 1408 (22.2%) 1189 (18.8%) b.001
Diabetes 2554 (40.6%) 2103 (33.1%) 1887 (29.8%) b.001
Ejection fractionb40% 1205 (19.2%) 921 (14.5%) 862 (13.6%) b.001
Type of surgery4 b.001
Elective surgery 2720 (43.3%) 3048 (48.0%) 3223 (50.9%)
Urgent surgery 3167 (50.4%) 2892 (45.6%) 2656 (42.0%)
Emergent surgery 399 (6.3%) 409 (6.4%) 447 (7.1%)
Prior CABG 474 (7.5%) 496 (7.8%) 509 (8.0%) .570
Peripheral vascular disease 934 (14.9%) 873 (13.8%) 858 (13.6%) .078
Dialysis 198 (3.1%) 124 (2.0%) 107 (1.7%) b.001
Creatininez2 382 (6.1%) 287 (4.5%) 291 (4.6%) b.001
3-Vessel disease 4761 (75.7%) 4793 (75.5%) 4763 (75.3%) .898
Degree of stenosis b.001
Left main vessel stenosis 51%-90% 1388 (22.1%) 1462 (23.0%) 1521 (24.0%)
Left main vessel stenosisN90% 143 (2.3%) 178 (2.8%) 218 (3.4%)
Myocardial infarctionb7 d ago 1397 (22.2%) 1404 (22.1%) 1247 (19.7%) .001
Chronic obstructive pulmonary disease 995 (15.8%) 868 (13.7%) 716 (11.3%) b.001
Predicted mortality rate (mean, SD) 2.44 (3.38) 2.17 (2.98) 2.23 (3.38) b.001
Distance traveled in miles (mean, SD) 38 (160) 35 (153) 28 (153) .001
traveled to hospital for each patient. Hospital volume was also categorized into tertiles: low (b240 CABGs per year, at
48 hospitals), medium (240-489 CABGs per year, at 19 hospitals) and high (z490 CABGs per year, at 8 hospitals).
Preoperative clinical risk or predicted mortality To adjust for clinical risk, we adjusted for the following risk factors: age in years, sex, urgency of surgery (not urgent, urgent, emergent), dialysis, prior CABG, chronic obstructive pulmonary disease, diabetes, creatinineN2 mg/dl, ejection fractionb40%,
peripheral vascular disease, myocardial infarction within the past 7 days, and presence of 3-vessel or left main disease.18To estimate subsequent predicted mortality after CABG, we adop-ted the American College of Cardiology/American Heart Associ-ation risk equAssoci-ation.18In the CCMRP, missing values ranged from 0.1% (urgency of the admission) to 12.2% (creatinine). There were no missing data for age. Missing values were imputed using best-subset regression, with demographic and clinical variables used to enumerate all best-subset combinations.19
Statistical analysis
We conducted our analyses in 3 stages. First, we examined the unadjusted associations between SES and actual inhospital CABG mortality. Second, we examined the unadjusted associ-ation between SES and clinical risk factors. Third, we examined the unadjusted relationship between SES and hospital volume and the association between volume and mortality. Finally, we examined the association between SES and actual mortality after adding hospital volume, then individual clinical risk factors, then distance traveled. F tests in 1-way analysis of variance were used to test for differences in means across SES groups, whereas Pearsonm2tests were used
to assess for differences in categorical variables across categories of SES.
We used 2-level hierarchical random-effects logit models to estimate the relationship between explanatory variables (SES, hospital volume, clinical risk factors) and actual inhospital mortality, using clustering at the facility level. Adaptive Gauss-Hermite quadrature was used for integration, and adequacy of the results was assessed by varying the number of quadrature points. Theawas set at .05, 2-tailed. Analyses were conducted in Stata 9.2 (StataCorp, College Station, TX).
We conducted several sensitivity analyses. To determine whether our results were sensitive to the choice of tertiles for hospital volume, we repeated our analysis with hospital volume as a continuous variable and found no substantial impact on our overall results. We also examined the use of area-level education and area-level income as representations of SES and found no change in our results, so we illustrate results using the summaryzscore. We excluded participants with missing values, but found a similar pattern of effects; so we illustrate results using imputed values. We conducted analysis for the subset of patients undergoing elective surgery only, as we hypothesized that SES differences might be different in patients who were less pressured by their clinical condition and therefore more likely to be able to exercise choice in hospital; we found a similar pattern of effects (results not shown). To see if adjustment using risk equation scores led to different estimates of clinical risk than adjustment for the actual risk factors, we substituted clinical risk score for individual risk predictors; we found a similar pattern effects (results not shown) and therefore illustrate models that
adjust for individual risk factors only. We added distance traveled as a covariate to determine if SES effects were mediated by this factor. We examined interactions between area-level SES and age and area-level SES and race, but found that these were not significant; and therefore, we did not include these in the final models. Finally, we examined whether hospitals that served low-SES patients had poorer outcomes than hospitals that served high-SES patients. When the mean SESzscore for each hospital was added to the model as a second-level variable, it was not statistically significant (P= .268), did not change appreciably change estimates for the other variables, and was therefore not included in the final models.
Results
Of the 18 961 patients in our sample, 501 (2.6%) died inhospital after their CABG surgery. Contrary to our hypothesis, in unadjusted analyses, SES was not associ-ated with greater CABG mortality. Inhospital mortality was 2.66% (n = 167) among individuals residing in low-SES areas, 2.57% (n = 163) among individuals residing in medium-SES areas, and 2.70% (n = 171) among individ-uals residing in high-SES areas (P = .89).
SES and preoperative clinical risk
As hypothesized, patients in low-SES areas had greater clinical risk and predicted mortality than patients from high-SES areas.Table Iillustrates clinical risk factors and subsequent mortality risk by SES. The risk profiles of patients differed by SES group. Compared with patients residing in middle- or high-SES areas, patients in low-SES areas had greater odds of being female and of minority race, and also had greater odds of having diabetes, renal
Figure 1
failure, elevated creatinine, low ejection fraction, myo-cardial infarction within the past 6 days, and chronic obstructive pulmonary disease. Patients from low-SES areas were more likely to be admitted for urgent surgery than patients from high-SES areas and to travel greater distances to the hospital. However, patients residing in high-SES areas tended to be older and had greater left main stenosis than patients residing in lower-SES areas.
SES and hospital volume
Contrary to our hypothesis, patients residing in high-SES areas were themost likely to have received CABG surgery in low-volume hospitals (Figure 1). Of all patients admitted to a low-volume hospital, 41.8% were from high-SES areas and only 27.4% were from low-SES areas (P b.001). At high-volume hospitals, the
percen-tages of patients from high- and low-SES areas were approximately the same (31.5% vs 31.3%, respectively).
As expected, lower hospital volume was associated with higher CABG mortality (Pb.001). Mortality was
3.42% in hospitals that performedb240 CABG procedures per year (low volume), 2.60% in medium-volume hospi-tals, and 1.92% in hospitals that performed a minimum of 490 CABG procedures per year (high volume).
SES, volume, and mortality
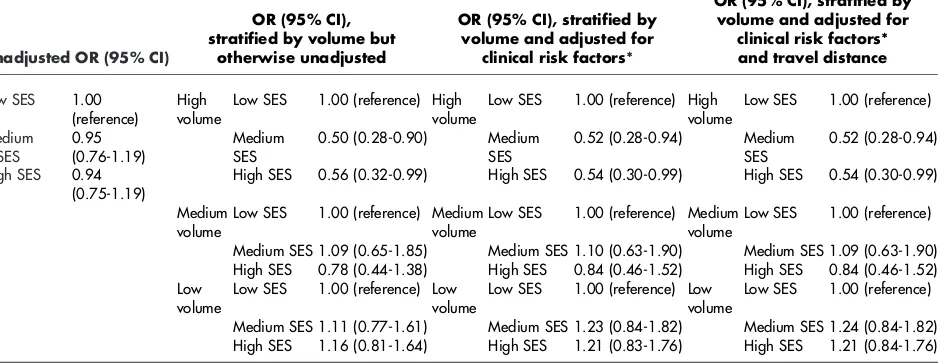
Although SES was not associated with CABG mortality in unadjusted analyses (Table II, column 1), the relation between SES and mortality was modified by hospital volume. We found an interaction between SES and hospital volume (P = .044) when regressed upon mortality; and therefore, the results are stratified by
hospital volume (Table II, column 2). In high-volume hospitals, low-, medium-, and high-SES patients had significantly different observed mortality rates (2.5% vs 1.5% vs 1.8%,P= .024). However, no significant SES differences in mortality existed in medium-volume hospitals (2.4% vs 3.1% vs 2.4%,P= .91) or low-volume hospitals (3.2% vs 3.4% vs 3.6%,P = .43).
Lower SES was associated with greater CABG mortality as originally hypothesized, but only in high-volume hospitals. In these high-volume settings, high SES yielded a significant reduction in the odds of mortality compared with low SES (odds ratio [OR] 0.56, 95% CI 0.32-0.99) and medium SES yielded a significant reduction in the odds of mortality as well (OR 0.50, 95% CI 0.28-0.90) (Table II, column 2).
SES, volume, clinical risk, and mortality
After adjustment for clinical risk factors inTable I, the association between SES and CABG mortality was still present in high-volume hospitals, although no longer statistically significant for high- versus low-SES–area patients (Table II, column 3). However, the estimates of effects were similar. In other words, the association between SES and mortality within high-volume hospitals was not entirely due to clinical risk nor distance traveled (Table II, column 4). The proportion of variation in mortality due to hospital volume was 12.2%.
Discussion
[image:4.580.54.524.112.294.2]Improving socioeconomic disparities in cardiovascular health requires identification of mechanisms potentially
Table II. Unadjusted and adjusted ORs and 95% CIs of inhospital CABG mortality for tertiles of SES, stratified by hospital volume
Unadjusted OR (95% CI)
OR (95% CI), stratified by volume but
otherwise unadjusted
OR (95% CI), stratified by volume and adjusted for
clinical risk factors*
OR (95% CI), stratified by volume and adjusted for
clinical risk factors* and travel distance
Low SES 1.00
(reference)
High volume
Low SES 1.00 (reference) High volume
Low SES 1.00 (reference) High volume
Low SES 1.00 (reference)
Medium SES
0.95 (0.76-1.19)
Medium SES
0.50 (0.28-0.90) Medium SES
0.52 (0.28-0.94) Medium SES
0.52 (0.28-0.94)
High SES 0.94
(0.75-1.19)
High SES 0.56 (0.32-0.99) High SES 0.54 (0.30-0.99) High SES 0.54 (0.30-0.99)
Medium volume
Low SES 1.00 (reference) Medium volume
Low SES 1.00 (reference) Medium volume
Low SES 1.00 (reference)
Medium SES 1.09 (0.65-1.85) Medium SES 1.10 (0.63-1.90) Medium SES 1.09 (0.63-1.90) High SES 0.78 (0.44-1.38) High SES 0.84 (0.46-1.52) High SES 0.84 (0.46-1.52) Low
volume
Low SES 1.00 (reference) Low volume
Low SES 1.00 (reference) Low volume
Low SES 1.00 (reference)
Medium SES 1.11 (0.77-1.61) Medium SES 1.23 (0.84-1.82) Medium SES 1.24 (0.84-1.82) High SES 1.16 (0.81-1.64) High SES 1.21 (0.83-1.76) High SES 1.21 (0.84-1.76)
High SES; Highest tertile of the area-levelzscore,medium SES; middle tertile of thezscore,low SES; lowest tertile of the area-levelzscore.
amenable to improvement. We had hypothesized that one of these mechanisms could be hospital selection. We expected that individuals of low SES would have greater mortality after CABG, mediated through both a poorer clinical risk factor profile and reduced access to CABG at hospitals presumed to have higher quality. We confirmed that individuals residing in low-SES areas did indeed have worsened preoperative estimates of car-diovascular risk and that individuals residing in low-SES areas had greater CABG mortality than individuals residing in higher-SES areas when the surgery was performed in high-volume hospitals.
However, we did not find that low-SES–area patients tended to go to low-volume hospitals more often than high-SES–area patients, despite previous reports from California showing that high-volume hospitals are locat-ed in higher-SES areas.10In fact, individuals from high-SES areas were more likely to have had their CABG surgeries at low-volume hospitals and exhibited a higher mortality rate than would be anticipated. In other words, although the overall association between SES and CABG mortality was minimal, this was because the association between SES and CABG mortality was mediated by 2 conflicting factors: volume and clinical risk. Low-SES patients tended to have greater clinical risk that predis-posed to greater mortality, but high-SES patients tended to go to hospitals with lower volume and poorer outcomes. To our knowledge, ours is the first examina-tion of the relaexamina-tionships between SES and CABG mortality that also examines the role of hospital volume.
One previous analysis that examined 771 CABG patients in one medical center in Kentucky found that those fromlower-SES communities(defined as lower median housing value) had a 3-fold increased risk of death 3 years after CABG surgery. As in our analysis, patients from lower-SES areas had a poorer clinical risk factor profile in that report. Because only a single center was examined, it was not possible to examine the effects of access to high-volume centers.4Our results may have differed because of our examination of inhospital mortality rather than 3-year mortality, which may more closely reflect the effects of hospital volume and periprocedural processes of care, as well as a larger database with a range of hospital volumes.
Contrary to expectations, we found that patients residing in high-SES areas tended to have surgery in low-volume hospitals. This could potentially be explained by the manner in which patients are selected to undergo surgery, combined with factors affecting hospital choice among high-risk patients. Although explanations are speculative, patients residing in high-SES areas may choose hospitals for their surgery based on a number of factors other than hospital volume and quality. These reasons include physical appeal of the facilities, culture of the hospital, and relative lack of insurance restrictions. These choices may not be available to or as important to
patients from low-SES areas. However, these choices may not always work to the patient’s advantage.
We primarily saw a relationship between SES and mortality in settings where high volumes of CABG surgeries were performed. Adjustment for clinical risk factors only slightly changed the effects, suggesting that SES differences are mediated through some other pathway. It is possible that in high-volume settings, processes of care are in some way SES dependent. It is also possible that SES effects only express themselves at lower levels of clinical risk because high-volume hospi-tals tended to have patients who had a lower as well as a narrower range of clinical risk. Specific techniques or medications may be used only in patients with lower levels of clinical risk, and these may be differentially applied by SES. For example, patients at lower clinical risk may be more likely to receive anticoagulants,h -blockers, angiotensin-converting enzyme inhibitors, or statins because of lack of comorbid diseases that are contraindications; but these therapies may not be equally administered to patients of low SES.
In contrast, a minimal relationship existed between SES and mortality, in medium- and low-volume hospitals. It is possible that in these settings, where all patients are presumed to receive poorer care, the effects of SES are comparatively minimal to other perioperative processes of care. The greater preoperative clinical risk at these hospitals may mask any independent SES effects.
We also found that the favorable associations between hospital volume and mortality were not entirely inde-pendent of clinical risk. High-volume hospitals tended to see patients of lower average clinical risk, although risk patients tended to have better outcomes at high-volume hospitals than patients of the same high risk at low-volume hospitals. This phenomenon has been previously reported upon, although explanations are speculative.20Low-volume hospitals may be less inclined to turn down high-risk patients, and/or high-volume hospitals may be performing surgeries on patients who could be treated more conservatively. However, it does not seem that this phenomenon affects the relationship between SES and mortality, as the association between SES and mortality was significant only within high-volume hospitals.
Caution must be taken in extrapolating area-level markers of SES to individual SES, and it is possible that the imprecision in the SES measure minimized the CABG mortality differences between categories of SES. Data were collected in 1999, and the magnitude of associa-tions may have changed over time. Finally, we were unable to explore potential explanations for the better outcomes at higher-volume hospitals, such as type of insurance, individual surgeon volume, and use of recommended medications, as these were not available. However, the primary purpose of our investigation was not to provide explanations for the link between hospital volume and outcomes but rather to determine the interaction of SES with hospital type.
In conclusion, we found that the greater preoperative clinical risk of patients residing in low-SES areas was not borne out in greater overall CABG mortality. Because high-SES patients tend to receive CABG procedures at low-volume institutions, hospital selection may reduce overall SES differences in CABG mortality. We did find that patients residing in lower-SES areas still were at greater risk for CABG mortality within hospitals that performed the most surgeries. Further study of potential explanations for this disparity is needed, particularly the application of perioperative procedures and medica-tions across groups of patients. Further study of decision making regarding hospital selection, including physician referral, insurance constraints, and other factors such as convenience, teaching status, patient mix, and appearance, may provide further insight into the paradoxical selection of low-volume hospitals by higher-SES patients.
References
1. Kaplan G, Keil J. Socioeconomic factors and cardiovascular disease: a review of the literature. Circulation 1993;88 (4 Pt 1): 1973 - 98.
2. Philbin E, McCullough P, DiSalvo T, et al. Socioeconomic status is an important determinant of the use of invasive procedures after acute myocardial infarction in New York State. Circulation 2000;102 (19 Suppl 3):III107 - 15.
3. Carlisle D, Leake B. Differences in the effect of patients’ socio-economic status on the use of invasive cardiovascular procedures across health insurance categories. Am J Public Health 1998;88: 1089 - 92.
4. Boscarino J, Chang J. Survival after coronary artery bypass graft surgery and community socioeconomic status: clinical and research implications. Med Care 1999;37:210 - 6.
5. Mensah G, Mokdad A, Ford E, et al. State of disparities in cardiovascular health in the United States. Circulation 2005;111:1233 - 41.
6. Shahian D. Improving cardiac surgery quality—volume, outcome, process? JAMA 2004;291:246 - 8.
7. Showstack J, Rosenfeld K, Garnick D, et al. Association of volume with outcome of coronary artery bypass graft surgery. JAMA 1987;257:785 - 9.
8. Birkmeyer J, Siewers A, Finlayson E, et al. Hospital volume and surgical mortality in the United States. N Engl J Med
2002;346:1128 - 37.
9. Halm E, Lee C, Chassin M. Is volume related to outcome in health care? A systematic review and methodologic critique of the literature. Ann Intern Med 2002;137:511 - 20.
10. Liu J, Zingmond D, McGory M, et al. Disparities in the utilization of high-volume hospitals for complex surgery. JAMA
2006;296:1973 - 80.
11. Konety S, Vaughan-Sarrazin M, Rosenthal G. Patient and hospital differences underlying racial variation in outcomes after coronary artery bypass graft surgery. Circulation 2005;111:1210 - 6. 12. Trivedi A, Sequist T, Ayanian J. Impact of hospital volume on racial
disparities in cardiovascular procedure mortality. J Am Coll Cardiol 2006;47:417 - 24.
13. Rothenberg B, Pearson T, Zwanziger J, et al. Explaining disparities in access to high-quality cardiac surgeons. Ann Thorac Surg 2004;78:18 - 24.
14. Harlan B. Statewide reporting of coronary artery surgery results: a view from California. J Thorac Cardiovasc Surg 2001;121:409 - 17. 15. Damberg C, Chung R, Stimle A. The California report on coronary artery bypass graft surgery: 1997-1998 hospital data, technical report. San Francisco (Calif)7Pacific Business Group on Health and
the California Office of Statewide Health Planning and Develop-ment; 2001.
16. Diez-Roux A, Kiefe C, Jacobs DJ, et al. Area characteristics and individual-level socioeconomic position indicators in three popu-lation-based epidemiologic studies. Ann Epidemiol
2001;11:395 - 405.
17. Diez-Roux A, Merkin S, Arnett D, et al. Neighborhood of residence and incidence of coronary heart disease. N Engl J Med
2001;345:99 - 106.
18. Eagle K, Guyton R, Davidoff R, et al. ACC/AHA 2004 guideline update for coronary artery bypass graft surgery: a report of the American College of Cardiology/American Heart Association Task Force on Practice Guidelines (Committee to Update the 1999 Guidelines for Coronary Artery Bypass Graft Surgery). Circulation 2004;110:e340-e437.
19. Lavori P, Dawson R, Shera D. A multiple imputation strategy for clinical trials with truncation of patient data. Stat Med 1995;14:1913 - 25.