Blackwell Munksgaard
2008 The Authors Journal compilationC 2008 The American Society of Transplantation and the American Society of Transplant Surgeons doi: 10.1111/j.1600-6143.2007.02098.x
The Effects of Donor and Recipient Practices
on Transplant Center Finances
M. J. Englesbe∗, Y. Ads, J. A. Cohn, C. J. Sonnenday, R. Lynch, R. S. Sung,
S. J. Pelletier, J. D. Birkmeyer and J. D. Punch
Michigan Surgical Collaborative for Outcomes Research and Evaluation, Department of Surgery, University of Michigan, Ann Arbor, MI
∗Corresponding author: Michael J. Englesbe,
englesbe@med.umich.edu
Over the past several years we have noted a marked decrease in this profitability of our kidney transplant program. Our hypothesis is that this reduction in kid-ney transplant institutional profitability is related to aggressive donor and recipient practices. The study population included all adults with Medicare insur-ance who received a kidney transplant at our center between 1999 and 2005. Adopting the hospital per-spective, multi-variate linear regression models to de-termine the independent effects of donor and recipi-ent characteristics and era effects on total reimburse-ments and total hospital margin. We note statistically significant decreased medical center incremental mar-gins in cases with ECDs (−$5887) and in cases of DGF (−4937). We also note an annual change in the med-ical center margin is independently associated with year and changes at a rate of−$5278 per year, related to both increasing costs and decreasing Medicare re-imbursements. The financial loss associated with pa-tient DGF and the use of ECD kidneys may resonate with other centers, and could hinder efforts to ex-pand kidney transplantation within the United States. The Centers for Medicare and Medicaid Services (CMS) should consider risk-adjusted reimbursement for kid-ney transplantation.
Key words: Delayed graft function (DGF), economic analysis, expanded criteria donors, kidney transplan-tation
Received 24 August 2007, revised 24 October 2007 and accepted for publication 20 November 2007
Introduction
Kidney transplantation is a life-saving treatment for most patients receiving dialysis. Transplantation is associated with a 68% reduction in long-term mortality among pa-tients who receive deceased donor renal transplants,
com-pared to patients who stay on dialysis (1). Unfortunately, need for transplantation continues to outpace the supply of these vital organs, leading to an 11% annual growth in the number of registrants joining the renal transplant wait list (2). Fueled by this growing shortage of kidneys for trans-plantation, the Department of Health and Human Services has encouraged expanding the donor pool, in part by en-couraging aggressive organ acceptance practices. Center-specific reports of organ acceptance practices are now available to the general public and ‘nonaggressive’ centers may be penalized (3). Among the most successful policies to expand the organ donor pool have been efforts to use kidneys from expanded criteria donors (ECDs). There has been an approximately 3-fold increase in the use of ECDs in the past 10 years and they now represent 17% of the donor organs (2,4,5).
Like many other kidney transplant programs, our program has historically been very profitable for our medical cen-ter. Over the past several years we have noted a marked decrease in this profitability. Our center has become more aggressive, transplanting sicker patients and using more ‘marginal’ deceased donor kidneys. For example, in 1999, 7% of our deceased donor kidney transplants were from ECDs, while in 2005, ECDs represented 21% of the donors utilized by our center. Similarly, our delayed graft function (DGF) rates among deceased transplant recipients have increased over this period. Presumably, the recipients of these kidneys will require more peri-operative care (6). Since hospitals are paid a single price, regardless of the risk or complexity of the kidney transplant, there may be a strong financial disincentive to use ‘high risk’ kidneys and transplant sicker patients, particularly as reimbursements for renal transplantation continues to decrease.
Our hypothesis is that the reduction in kidney transplant surgical care profitability is related to aggressive donor and recipient practices.
Materials and Methods
graft and patient outcomes as well as all financial data from UMHS for 90 days following the kidney transplant.
Patients with DGF were defined as those who required dialysis within the first 7 days after a kidney transplant operation. ECD kidneys were defined as having a risk of graft failure≥1.7 times that of ideal donors. ECDs include any donor≥60 years old and donors 50–59 years old with at least two of the following: terminal creatinine>1.5 mg/dL, history of hypertension or death by cerebrovascular accident (7).
Financial Data was collected using the Transitions Systems Inc. (TSI) (Chicago, IL) to identify hospital costs and reimbursements. Reimburse-ments to the medical center were calculated based on modeled revenue for reimbursements (constantly updated average for a payer based on hospital charges). The TSI system tracks the use of all resources and assigns esti-mates of cost based on direct acquisition costs for supplies and time-and-motion studies for labor costs. This method of activity-based cost account-ing is widely believed to be the most accurate method of estimataccount-ing the true economic cost of an episode of care. Hospital Margins were calculated us-ing the formula (hospital reimbursements−hospital total costs). To reiterate, this is not the margin for the operation but rather for all care provided in the 90 days following the transplant. Considering the complexity and variation involved in accounting for donor acquisition costs, we decided to limit all financial analysis to Medicare patients. In TSI, we adjust the Medicare organ acquisition add-on payment based on the final Medicare Cost Report. Spe-cific cost buckets were broken down into: pharmacy costs, inpatient costs (respiratory therapy, rehabilitation, nursing, operating room, supplies and dialysis), outpatient costs (clinic visits, emergency room visits), and trans-plant center costs (organ acquisition and pretranstrans-plant patient care). Costs of care outside of UMHS were not obtained. Physician costs and reimburse-ments were not collected. All data was adjusted to 2004 U.S. dollars by using the Producer Price Index for the Direct Health and Medical Insurance Carriers (8).
Statistical analysis
Differences in financial data were assessed via unpairedt-test. The de-pendant variables (total reimbursements and total margin) were noted to be of normal distribution, so no transformations were done. Simple linear regression analysis was used to identify donor and recipient variables af-fecting total reimbursements and total margin. Era effects were estimated by using the year of transplant as a variable. Variables significant to a level of p<0.20 were potential candidate variables for multi-variate linear re-gression models, assessing the independent effects of covariates on total reimbursements and total hospital margin. ECD and the individual com-ponents of ECD status were considered in the univariate analysis. If ECD was entered into the multi-variate model, covariates that are components of ECD status were excluded from the model. All analysis was completed using SPSS 14.0 (Chicago, IL).
Results
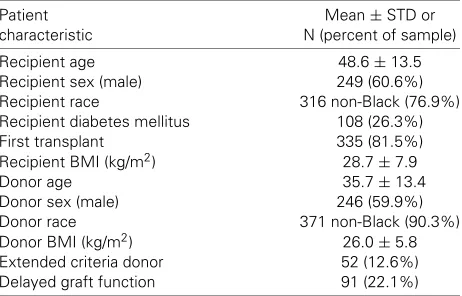
The baseline characteristics of the study population (411 consecutive adult deceased donor kidney transplants done between 1999 and 2005 on patient with Medicare) are de-tailed in Table 1. We note that 37 (11.7%) recipients re-ceived kidneys from ECD donors and 91 (22.1%) recipients had DGF.
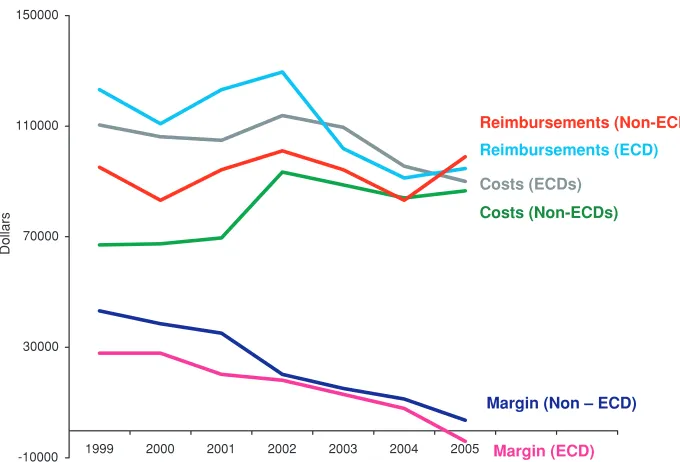
Between 1999 and 2005, we note a trend toward decreas-ing reimbursements from Medicare for the first 90 days of care following a kidney transplant (Figure 1).
Conse-Table 1: Donor and recipient characteristics among 411 con-secutive renal transplant operations on patients with Medicare insurance
Patient Mean±STD or
characteristic N (percent of sample)
Recipient age 48.6±13.5
Recipient sex (male) 249 (60.6%)
Recipient race 316 non-Black (76.9%)
Recipient diabetes mellitus 108 (26.3%)
First transplant 335 (81.5%)
Recipient BMI (kg/m2) 28.7±7.9
Donor age 35.7±13.4
Donor sex (male) 246 (59.9%)
Donor race 371 non-Black (90.3%)
Donor BMI (kg/m2) 26.0±5.8
Extended criteria donor 52 (12.6%)
Delayed graft function 91 (22.1%)
quently, we note an impressive downward trend Medical Center reimbursements and margins over the study period. These trends are similar in both ECD and non-ECD kidney transplants.
Reimbursements
Using simple linear regressions, we noted variables with a significant effect on total Medicare reimbursements (Table 2). We note an annual reduction in Medicare reim-bursement of $1319 over the period of the study. These variables were used as candidate variables in a multivari-able linear regression model to determine the incremental costs of significant donor and recipient characteristics. We note increased incremental reimbursements (or Medicare costs) of $13 163 in cases of DGF, $12 499 in male recipi-ents (compared to female), and $6900 in cases when the donor cause of death was a stroke. ECDs were not asso-ciated with a statistically significant increase in reimburse-ments from Medicare to the medical center.
Margins
Using simple linear regressions, we report variables with a significant effect on total medical center margins (prof-its) (Table 3). These variables were used as candidate variables in a multivariable linear regression model to de-termine the incremental costs of significant donor and re-cipient characteristics. We note statistically significant de-creased medical center incremental margins in cases with ECDs (−$5887) and in cases of DGF (−4937). We also note an annual change in the medical center margin is in-dependently associated with year and changes at a rate of −$5278 per year.
Finances of ECD kidneys
[image:2.595.309.540.86.234.2]Finances of ECD and Non-ECD kidney transplants
-10000 30000 70000 110000 150000
1999 2000 2001 2002 2003 2004 2005
Dollars
Reimbursements (Non-ECD)
Costs (Non-ECDs)
Margin (Non – ECD)
Margin (ECD)
Reimbursements (ECD)
Costs (ECDs)
Figure 1: The reimburse-ments, total costs and mar-gins for ECD and Non-ECD kidney transplants on Medi-care patients from 1999 to 2005 at the University of Michigan.
There was no significant difference in Medicare reimburse-ments between patients who did and did not receive kid-neys from ECDs in this univariate analysis. When strati-fied by year, we note a trend of decreasing margins for both ECD and non-ECD deceased donor renal transplants. (Figure 1) In 2005, our center had a margin of−$3958 when using ECD kidneys for transplant.
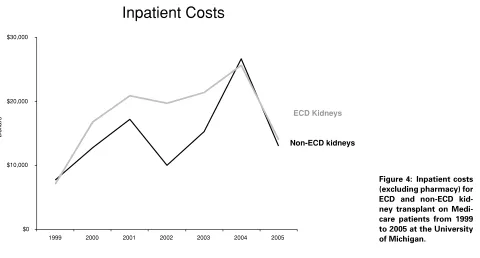
[image:3.595.58.398.84.315.2]We then assessed trends in cost ‘buckets’ between ECD and non-ECD kidney transplants. Specifically, we note a sharp increase in organ acquisition and pretransplant costs between both ECD and non-ECD kidney transplant recipients. (Figure 2) In general, costs were higher for ECD kidney transplants with respect to pharmacy costs (Figure 3), inpatient costs (Figure 4) and outpatient costs (Figure 5), but there was significant year-to-year variation in these costs.
Table 2: Medical center reimbursements: univariate and multi-variate analysis of renal donor and recipient variables affecting total Medicare reimbursements (incremental dollars) to the medical center
Incremental Incremental
Covariate dollars univariate p-Value dollars multivariate p-Value
Delayed graft function 4219 0.0013 13 163 0.0017
Recipient male sex 12 855 0.0004 12 499 0.0005
Donor cause death stroke 6898 0.0555 6900 0.0498
Post-op urinary complication 28 095 0.0144 NS NS
Number of transplants (per transplant) 6265 0.1051 NS NS
Donor age (per year) 188 0.1019 NS NS
Transplant year (per year) −1319 0.0867 NS NS
Recipient diabetes mellitus −5369 0.1826 NS NS
Donor race black −10 438 0.0801 NS NS
Discussion
Table 3:Medical Center Financial Margins: Univariate and multi-variate analysis of renal donor and recipient variables affecting total medical center financial margins (incremental dollars)
Incremental Incremental
Covariate dollars univariate p-Value dollars multivariate p-Value
Extended criteria donor −8876 0.0047 −5887 0.0228
Transplant year (per year) −5287 0.0001 −5278 0.0001
Delayed graft function −1644 0.0516 −4937 0.0176
Donor race black −8051 0.0228 NS NS
Donor hypertension −7283 0.0089 NA NA
Recipient black race −6116 0.0138 NS NS
Recipient diabetes mellitus −4861 0.0414 NS NS
Donor BMI (per 5 kg/m2) −1890 0.0379 NS NS
Recipient age −184 0.0067 NS NS
transplants actually have a negative margin for our Medical Center.
The financial implications of policy changes, such as ex-panding the organ donor pool, are intimately related to pa-tient care and must be addressed. The significant organ shortage leaves many potential kidney transplant recipi-ents waiting for years, with significant waiting list mortality (1,2,5,10). Appropriately, efforts have been made to opti-mize the donor pool in order to maxiopti-mize the number of transplants being done (11,12). These efforts are with the best intentions for the patients, but these policies seem to be having financial implications on our center. In view of decreasing Medicare reimbursements for kidney
trans-Organ acquisition and pre-transplant costs
$10,000 $20,000 $30,000 $40,000 $50,000 $60,000
1999 2000 2001 2002 2003 2004 2005
Dollars
ECD Kidneys
Non-ECD kidneys
Figure 2: Organ acqui-sition and pretransplant costs for ECD and non-ECD kidney transplant on Medicare patients from 1999 to 2005 at the Uni-versity of Michigan.
plantation, the financial loss associated with patient DGF and the use of ECD kidneys may resonate with other cen-ters, and could hinder efforts to expand the renal donor pool within the United States.
Inpatient and outpatient pharmacy costs
$0 $10,000
1999 2000 2001 2002 2003 2004 2005
Dollars
ECD Kidneys
[image:5.595.60.408.81.329.2]Non-ECD kidneys
Figure 3: Inpatient and out-patient pharmacy costs for ECD and non-ECD kidney transplant on Medicare pa-tients from 1999 to 2005 at the University of Michigan.
Alternatively, using multivariable modeling, we control for the confounding variables and assign incremental costs to ECDs. The multivariable analysis also controls for the re-lationship between time and changes in practice patterns, namely more ECD donors recently in an era of lower mar-gins. It is unclear why ECDs are associated with lower margins independent of time and the occurrence of DGF.
Inpatient Costs
$0 $10,000 $20,000 $30,000
1999 2000 2001 2002 2003 2004 2005
Dollars
ECD Kidneys
Non-ECD kidneys
Figure 4: Inpatient costs (excluding pharmacy) for ECD and non-ECD kid-ney transplant on Medi-care patients from 1999 to 2005 at the University of Michigan.
[image:5.595.62.542.445.703.2]Outpatient Costs
$0 $1,000 $2,000 $3,000 $4,000
1999 2000 2001 2002 2003 2004 2005
Dollars
ECD Kidneys
[image:6.595.203.544.77.296.2]Non-ECD kidneys
Figure 5: Outpatient costs (excluding pharmacy) for ECD and non-ECD kidney transplant on Medicare pa-tients from 1999 to 2005 at the University of Michigan.
Medicare more money (likely related to the kidney trans-plant DRG) but have a deleterious effect on our center’s financial margin. Conversely, DGF does cost Medicare sig-nificantly, but is also independently associated with lower center margins.
Certainly, there are several factors, which limit the scope of our study. Firstly, we do not account for opportunity cost for the medical center, which is always running near full capacity. When a patient with DGF is forced to remain in the hospital for longer than a patient with no postsurgi-cal complications, the hospital is unable to admit new and potentially profitable patients to take his/her bed. In addi-tion, although we quantify financial costs for the medical center and the payer, we make no effort to quantify the cost on the patient’s personal life or on society. Postsur-gical occurrences like DGF are certain to affect a patient’s ability to return as a productive member of society. We also have used the UMHS cost accounting methodology to produce our cost data and accounting assumptions are inherently imperfect and will have significant impact on the data and associated conclusions. Finally, we make no attempt to assess the financial implications on the organ procurement organization (OPO). For example, many ECD protocols include aggressive use of pulsatile pump perfu-sion of kidneys, and the clinical and financial implications of such clinical measures remains to the determined (13). Similarly, aggressive pursuit of donors will undoubtedly be associated with a higher rate of donor-discarded kidneys, which will presumably affect OPO finances (14,15). These influences likely attribute to the rapidly increasing standard acquisition charge from the OPO for a kidney.
There have been significant changes in transplant finances and practice patterns from the beginning of the study
pe-riod (1999) to the end of the study pepe-riod (2005). The most impressive includes an annualized rate of decline on med-ical center margin of almost $5000/year. This is primarily related to both decreasing reimbursements, rising organ acquisition costs (which are likely related to policies aimed at expanding it organ donor pool, though these changes should be cost neutral) and accounting policies specific to our Medical Center. In 2005, the medical center margin on deceased donor renal transplants reimbursed by Medicare was $719. In an attempt to make our findings as generaliz-able as possible to other centers, we have limited the study group to Medicainsured recipients of deceased donor re-nal transplants. We primarily chose to do this because the organ acquisition reimbursements in non-Medicare payers is complex and makes it difficult to compare financial data among different payers. Similarly, it is also difficult to com-pare financial data among medical centers, for character-ization and assignment of indirect costs is largely policy driven and not data driven. Medicare claims data provides vast data on a large sample size, but is insufficient in inform-ing center-specific financial conclusions. Thus, we chose to use single center data and as a result it is important that the conclusions of this analysis be considered within the context of this relatively small sample size.
increasing organ acquisition costs. The transplant commu-nity can likely have a significant impact on organ acquisition costs, at least in part by assessing the efficiency in which organs are procured. Though organ acquisition costs are reimbursed by CMS, their rapid increase likely indirectly affects the DRG reimbursement for kidney transplant.
As medical center costs continue to rise and medical cen-ter reimbursements continue to fall, the delecen-terious finan-cial impact of expanding the organ donor pool will likely receive more attention from Medical Center administra-tors. In addition, there will likely be increasing pressure on transplant centers to use more high-risk donors by means of public reporting of transplant and organ turn-down rates (5). This pressure is likely in the best interest of patients on the renal transplant list. Conversely, this pressure can fairly be seen as an unfunded mandate on the individual trans-plant centers. The financial losses associated with DGF and ECDs could hinder efforts to expand the renal donor pool within the United States. The Centers for Medicare and Medicaid Services (CMS) should consider risk-adjusted re-imbursement for kidney transplantation, as they do with prospective payment systems for other types of inpatient hospital care. Considering the costs of long-term dialysis (6,16,17), a financial incentive to use financially ‘high risk’ kidneys such as ECDs, would likely be a good investment for CMS.
Acknowledgment
Dr. Englesbe is supported by a grant from the American Surgical Association Foundation.
References
1. Wolfe RA, Ashby VB, Milford EL et al. Comparison of mortality in all patients on dialysis, patients on dialysis awaiting transplantation, and recipients of a first cadaveric transplant. N Engl J Med 1999; 341: 1725–1730.
2. Cohen DJ, St Martin L, Christensen LL, Bloom RD, Sung RS. Kid-ney and pancreas transplantation in the United States, 1995–2004. Am J Transplant 2006; 6(5 Pt 2): 1153–1169.
3. Center specific reports—Scientific Registry of Transplant Re-cipients. Available from: www.ustransplant.org. 2007. Accessed October 20, 2007.
4. Merion RM, Ashby VB, Wolfe RA et al. Deceased-donor charac-teristics and the survival benefit of kidney transplantation. JAMA 2005; 294: 2726–2733.
5. The 2006 OPTN/SRTR Annual Report—US Department of Health and Human Services, 2006. Available from: www.ustransplant.org. Accessed October 20, 2007.
6. Whiting JF, Woodward RS, Zavala EY et al. Economic cost of ex-panded criteria donors in cadaveric renal transplantation: Analysis of Medicare payments. Transplantation 2000; 70: 755–760. 7. Sung RS, Guidinger MK, Lake CD et al. Impact of the expanded
criteria donor allocation system on the use of expanded criteria donor kidneys. Transplantation 2005; 79: 1257–1261.
8. Producer Price Index for the Direct Health and Medical Insur-ance Carriers Industry. U.S. Department of Labor, Bureau of Labor Statistics, 2006. Available from: www.bls.gov. Accessed October 20, 2007.
9. Resnick AS, Corrigan D, Mullen JL, Kaiser LR. Surgeon contribution to hospital bottom line: not all are created equal. Ann Surg 2005; 242: 530–537; discussion 537–539.
10. Danovitch GM, Cohen DJ, Weir MR et al. Current status of kidney and pancreas transplantation in the United States, 1994–2003. Am J Transplant 2005; 5(4 Pt 2): 904–915.
11. Punch JD, Hayes DH, LaPorte FB, McBride V, Seely MS. Organ donation and utilization in the United States, 1996–2005. Am J Transplant 2007; 7(5 Pt 2): 1327–1338.
12. Marks WH, Wagner D, Pearson TC et al. Organ donation and uti-lization, 1995–2004: entering the collaborative era. Am J Transplant 2006; 6(5 Pt 2): 1101–1110.
13. Schold JD, Kaplan B, Howard RJ, Reed AI, Foley DP, Meier-Kriesche HU. Are we frozen in time? Analysis of the utilization and efficacy of pulsatile perfusion in renal transplantation. Am J Transplant 2005; 5: 1681–1688.
14. Kubota Y, Hayakawa K, Sasaki H et al. Should we discard the graft? Analysis of the renal grafts with a total ischemia time of more than 24 hours donated after cardiac death. Am J Transplant 2007; 7: 1177–1180.
15. Hayakawa K, Kubota Y, Sasaki H et al. Should we discard the renal allografts from cardiac death donors that have total ischemic time longer than 24 hours? Transplant Proc 2006; 38: 3382–3383. 16. Hirth RA. The organization and financing of kidney dialysis and
transplant care in the United States of America. Int J Health Care Finance Econ 2007.