Munich Personal RePEc Archive
An analysis of at-home demand for ice
cream in the United States
Davis, Chris and Blayney, Don and Yen, Steven and Cooper,
Joseph C.
Economic Research Service, USDA, Department of Agricultural
Economics, University of Tennessee
December 2009
Online at
https://mpra.ub.uni-muenchen.de/24782/
An analysis of at-home demand for ice cream in the United States
1C. G. Davis ,*2 D. P. Blayney ,* S. T. Yen ,† and J. Cooper *
* Markets and Trade Economics Division, Economic Research Service, US Department of Agriculture, Washington, DC 20036 † Department of Agricultural Economics, University of Tennessee, Knoxville 37996
ABSTRACT
Ice cream has been manufactured commercially in the United States since the middle of the 19th century. Ice cream and frozen dessert products comprise an im-portant and relatively stable component of the United States dairy industry. As with many other dairy prod-ucts, ice cream is differentiated in several dimensions. A censored translog demand system model was employed to analyze purchases of 3 ice cream product categories. The objective of this study was to determine the effect that changes in retail prices and consumer income have on at-home ice cream consumption. The analysis was based on Nielsen 2005 home scan retail data and used marital status, age, race, education, female employment status, and location in the estimations of aggregate de-mand elasticities. Results revealed that price and con-sumer income were the main determinants of demand for ice cream products. Calculated own-price elasticities indicated relatively elastic responses by consumers for all categories except for compensated bulk ice cream. All expenditure elasticities were inelastic except for bulk ice cream, and most of the ice cream categories were substitutes. Ongoing efforts to examine consumer demand for these products will assist milk producers, dairy processors and manufacturers, and dairy market-ers as they face changing consumer responses to food and diet issues.
Key words: Nielsen home scan retail data , dairy de-mand , elasticity , ice cream
INTRODUCTION
Ice cream has been manufactured in the United States since at least the time of the Revolutionary War. How-ever, a commercial ice cream industry did not emerge until the middle of the 19th century. As with many other dairy products, ice cream is differentiated in several dimensions. Fat content is perhaps the most obvious of
the ways to categorize ice cream, but others categoriza-tions, including texture, flavor(s), and sweetness, are also used. The factors that affect consumer decisions among the types of ice creams, which are essentially close substitutes, are of interest to many. In addition to economic variables such as prices, other factors such as demographics and location are important.
It is impossible to pin down with certainty the first appearance of most food products. Products prepared and consumed in the past may be the precursors of what today is recognized as ice cream. Trager (1997) noted ice cream production as early as 1560 in Italy, where it was found that combining salt and ice resulted in a fro-zen product. The first public mention was in 1774 when a caterer advertised in a New York newspaper that he had arrived from London and was prepared to supply various confections, including ice cream. Many famous people of the time, including George Washington, listed ice cream among their favorite foods.
It was not until the 1800s that technological advance-ments provided the support for a larger scale ice cream industry, with the invention of a hand-cranked freezer. The wholesale ice cream industry is generally dated to 1851 and has since been spurred by technological changes in refrigeration, milk testing, and packaging. The development and introduction of the continuous freezer in the late 1920s was an important factor in con-tinued industry growth. Until the 1930s, ice cream was mainly sold through soda fountains, but by the 1950s and 1960s, widespread establishment of supermarkets and specialty ice cream stores had significantly changed ice cream merchandising—consumers could purchase packaged ice cream to take home. Ready availability of ice cream for both at-home and away-from-home consumption continues to affect purchases today (Man-chester and Blayney, 1997).
Ice cream production has been quite stable over the past several years. Although there is some trade in ice cream products, the categories defined for this study are generally assumed to be consumed domestically. As Figure 1 shows, production trends for 4 types of ice cream products—hard full-fat (sometimes called hard regular), hard low-fat (reduced fat), sherbet, and other (novelty items)—have been relatively flat or slowly
doi: 10.3168/jds.2009-2536
© American Dairy Science Association, 2009 .
6210
Received July 1, 2009. Accepted September 1, 2009.
1 Disclaimer: The opinions and analysis presented represent the
authors’ ideas and do not necessarily reflect those of Economic Research Service or the U.S. Department of Agriculture.
2
increasing over time. Given a rising population, this implies a relatively flat or slowly declining per capita consumption of the individual product categories.
The United Dairy Industry Association (n.d.) pub-lished a series of dairy product studies based on pur-chase information collected from April 1972 to March 1973 (reported results are based on the 6-mo period of March to September 1972). Ice cream and related product purchases were reported and analyzed in one of those published studies. The sample used for the analysis represented purchases by household consumers of regular bulk or packaged products and novelties that did not reflect away-from-home purchases. Results were summarized for the United States, 5 major regions, and 3 metropolitan areas (Chicago, Los Angeles, and New York). Only the United States and regional results are reported here.
During the 6-mo period, 81% of households pur-chased ice cream and 26% purpur-chased novelty products. Converting volumes to half-gallon equivalents, the average United States ice cream price was $0.775 per half-gallon—only 1 region, the Northeast, had a higher price: $0.876. Even with the higher price, households in the Northeast reported a greater buying frequency: 9.6 purchases compared with the United States average of 8.2. Purchasing frequency was lowest in the South.
Ice cream, ice milk (reduced-fat ice cream), and sherbet were analyzed separately and exhibited some interesting regional characteristics. Compared with the United States average purchases, ice cream was
purchased more in the North Central and Northeast regions; ice milk was purchased more often in the South and Pacific regions, and sherbet purchases were higher in the Mountain, Southwest, Pacific, and North Central regions. Smaller households (1 or 2 members) reported the highest purchases of ice cream, whereas households of 4 or 5 had the highest purchases of novelties. The results based on age indicated that older (55 and over) purchasers reported higher ice cream purchases, where-as those in the 25 to 34 age category reported higher novelty purchases. No summary statistics were reported by income category (although data were provided).
A study by Boehm and Babb (1975) examined price responses of frozen desserts as a subset of perishable manufactured dairy products. The frozen products were defined in 4 categories: ice cream, ice milk, total bulk-packaged products, and novelties. Household data were used to obtain both long- and short-run estimates of price and expenditure elasticities. The long-run analysis was a cross-section analysis, whereas short-run results were obtained using time series analysis. The own-price responses estimated in the study were −0.42 for ice cream, −0.56 for ice milk, −0.47 for total bulk-packaged products, and −0.75 for novelties in the long-run (all statistically significant) and −0.69, −1.05, −0.42, and −1.48, respectively, in the short-run (with only the bulk product result not statistically significant). The calculated income elasticities were reported to be 0.047, −0.009, 0.070, and 0.149, respectively, suggest-ing that income increases did not generate substantial
6211
OUR INDUSTRY TODAY
[image:3.612.116.517.73.321.2]Journal of Dairy Science Vol. 92 No. 12, 2009
changes in consumption, although they were generally positive. It was found that consumers were particularly responsive to specials for ice cream and bulk products. As mentioned, regional patterns of consumption were noted.
A study of Canadian dairy demand by Veeman and Peng (1997) using quarterly data from 1984 to 1993 in a dynamic “almost ideal demand system” (AIDS) model specification with 5 dairy categories, 1 category including ice cream, yogurt, cottage cheese, and cream, found an estimated Marshallian own-price elasticity of demand for ice cream of −0.6241 (statistically signifi-cant). An expenditure elasticity, which was significant, was calculated to be 1.4604.
There has been much research on the consumption of differentiated products. Maynard and Venkat Narayanan (2002) examined the frozen desserts category, particu-larly the 7 products defined as ice cream, frozen yogurt, sherbet, sorbet, branded frozen novelties, private label frozen novelties, and other packaged frozen products. An ordinary (quantity-dependent) synthetic conditional demand system model framework was used to estimate elasticities. The estimates of compensated own-price elasticities for the categories, in the order presented, were −1.30, −1.72, −1.43, −0.71, −2.39, −1.59, and −2.37. Kaiser and Forker (1993) also estimated a price and income elasticity for frozen products of −0.356 and 0.08, respectively. Other related studies include, among others, Dong and Kaiser (2005, 2008), Schmit et al. (2003), and Dong et al. (2004).
It is not possible to directly compare these models and results. The time spans are different, as are the methodological and empirical approaches. Thus, the objective of this study was to determine the effect that changes in retail prices and consumer income have on at-home ice cream consumption using Nielsen (2005) retail household purchase data. The following section describes our analysis based on the 2005 household purchase data. The results may be compared in a very general way with those of other authors noted here.
MATERIALS AND METHODS
Assuming that most people shop for the household once a week, it is unlikely that every person who buys food will purchase bulk ice cream, ice cream novelties, and ice milk or sherbet every time he or she shops. Be-cause the likely occurrence is that household shoppers will not buy all 3 ice cream products each time they shop, zero purchases are recorded. Thus, to address the 0/1 problem that is a frequent issue with cross-sectional retail data, we employed a censored demand system.
To streamline our estimation procedures, we estimat-ed a censorestimat-ed demand system using a multivariate
sam-ple selection model developed by Yen and Lin (2006), which was estimated with a 2-step procedure proposed by Shonkwiler and Yen (1999). One advantage of this approach is that it accommodated zero purchases and simplified the computational burden while still produc-ing consistent parameter estimates.
The demographic variables used by Nielsen (2005) to characterize ice cream purchases were all based on a representative sample of the 2005 United States popula-tion. A representative sample was used in the selection of consumers who agreed to scan retail grocery receipts of purchases made during a 12-mo period. Although some researchers have heavily criticized the reliability of Nielsen data, the overall accuracy of self-reported data by Homescan panelists seems to be in line with many other surveys of this type (Einav et al., 2008). The Economic Research Service sample contained purchase data from a representative group of 8,000 households for the year 2005. All 8,000 households that purchased ice cream within a 12-mo period were included in the analysis, whether they purchased ice cream 1 time or 500 times. Nielsen’s demographic file contained sample weights (projection factors) that were used to project product purchases to the United States national level, and these weights were used in the probit analysis de-scribed below.
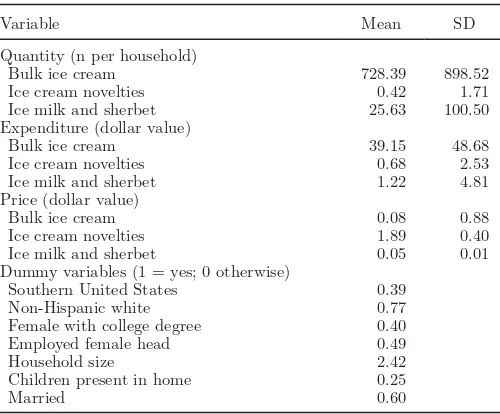
For this study, we analyzed the effects of demographic variables, including employed female head of household, Southern region of the United States, non-Hispanic Whites, female college graduates, children present in the home, size of household, and married individu-als because of the effect they have had on ice cream purchases in other studies (Tables 1 and 2). Studies that have analyzed dairy products in the past (Huang and Lin, 2000; Chouinard et al., 2005; and others) have used the above or similar demographic variables in their analyses. Table 3 shows the percentage of demo-graphic variables of interest represented in the United States census, the Nielsen Homescan Fresh Foods panel (unweighted), and the subset of those households who purchased ice cream as reported in the data (also un-weighted).
statistically significant in some of the binary ice cream models. The same demographic variables were used in the second step, which consisted of the maximum likelihood estimates of the multivariable, sample selec-tion model (censored translog demand system). In our analysis, we found that whereas demographic variables were important factors that must be accounted for in the demand estimations, the major drivers of ice cream demand were price and income. The next section reveals and discusses the price and income elasticities related to the 3 ice cream products.
RESULTS AND DISCUSSION
The compensated price elasticities derived from the censored translog demand system are shown in Table 4. To make the Results and Discussion segment easier to understand, we will present some definitions of economic terms. In particular, the following terms are important: complements, substitutes, compensated demand elasticities, and uncompensated demand elas-ticities. If 2 products are complements, an increase in the price of one of them results in a decrease in the de-mand for the other. In contrast, substitute products are those in which an increase in the price of one increases the demand for the other. The terms compensated and uncompensated are generally applied to demand curve descriptions. From economic theory, both price and income changes influence demand. A compensated demand curve describes behavior of consumers if they were somehow compensated for income effects related to price changes (also known as the Hicksian demand curve). Uncompensated demand curves are not adjusted
for the income effects (the Marshallian demand curve; Black, 2002).
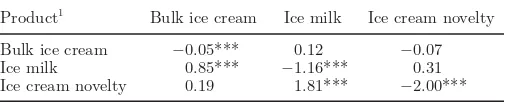
All of the own-price elasticities were statistically significant at the 1% level and negative, as expected according to the theory of demand (Table 4). Demands for ice milk or sherbet and frozen novelty ice cream were notably elastic, with own-price elasticities of −1.16 and −2.00, respectively, which meant that a 1% change in the price of these products would have a change greater than 1% in quantity demanded. The bulk ice cream category was inelastic and would have a very small response to changes in its own price (at −0.05).
All of the compensated cross-price elasticities were less than unity except for the relationship between novelty ice cream and ice milk or sherbet. A mixture of complements and substitutes among the ice cream product categories was found, based on the compen-sated demand elasticities, with 2 of the 6 being statisti-cally significant. Ice milk and sherbet were substitutes for bulk ice cream, whereas ice cream novelties were substitutes for ice milk or sherbet. The inelastic cross-price elasticities reported for the compensated demand implied that changes in the price of one product would yield small changes in the purchase of the other prod-uct, and vice versa.
Table 5 presents the estimated uncompensated price and expenditure elasticities derived from the censored demand model. The own-price elasticities for the 3 ice cream categories were all significant at the 1% level and negative. In contrast to elasticities from the
compen-6213
OUR INDUSTRY TODAY
[image:5.612.60.310.96.303.2]Journal of Dairy Science Vol. 92 No. 12, 2009
Table 1. Variable definitions and sample statistics (sample size = 7,254)
Variable Mean SD
Quantity (n per household)
Bulk ice cream 728.39 898.52 Ice cream novelties 0.42 1.71 Ice milk and sherbet 25.63 100.50 Expenditure (dollar value)
Bulk ice cream 39.15 48.68 Ice cream novelties 0.68 2.53 Ice milk and sherbet 1.22 4.81 Price (dollar value)
Bulk ice cream 0.08 0.88
Ice cream novelties 1.89 0.40 Ice milk and sherbet 0.05 0.01 Dummy variables (1 = yes; 0 otherwise)
Southern United States 0.39 Non-Hispanic white 0.77 Female with college degree 0.40 Employed female head 0.49
Household size 2.42
Children present in home 0.25
[image:5.612.324.575.470.711.2]Married 0.60
Table 2. Probit estimates of the translog demand system
Parameter Coefficient SEM
Bulk ice cream
Southern United States 0.06 0.08 Non-Hispanic White 0.21*** 0.09
College degree 0.10 0.08
Employed female head 0.03 0.08 Household size 0.13*** 0.06 Children present in home −0.21 0.14
Married 0.11 0.10
Frozen novelty ice cream
Southern United States −0.01 0.04 Non-Hispanic White −0.04 0.04 College degree −0.20*** 0.04 Employed female head 0.01 0.04 Household size 0.10*** 0.02 Children present in home 0.26*** 0.06
Married 0.09*** 0.04
Ice milk and sherbet
Southern United States 0.01 0.04 Non-Hispanic White −0.04 0.04 College degree −0.07* 0.04 Employed female head 0.02 0.04 Household size 0.07*** 0.02 Children present in home 0.03 0.06
Married 0.06 0.04
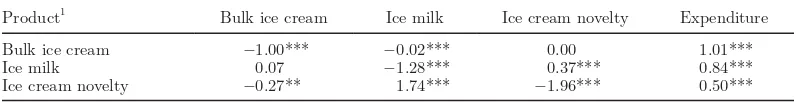
sated own-price elasticities, these elasticities were all numerically larger except for ice cream novelties. The own-price elasticities from the uncompensated demand ranged from −1.00 for bulk ice cream to −1.28 for ice milk or sherbet to −1.96 for ice cream novelties. Similar to our study, the own-price elasticities of Maynard and Venkat Narayanan (2002) for ice cream (−1.30), sher-bet (−1.43), branded frozen novelties (−2.39), and pri-vate label frozen novelties (−1.59) were all elastic and close in magnitude. Boehm and Babb (1975) own-price elasticities for ice cream product categories were inelas-tic (−0.42 for ice cream, −0.56 for ice milk, −0.47 for total bulk-packaged products, and −0.75 for novelties) and were much smaller in comparison with the present study and Maynard and Venkat Narayanan (2002).
The estimated uncompensated demand cross-price elasticities from the censored demand model had more statistically significant relationships than did the com-pensated demand cross-price elasticities. All of the uncompensated demand cross-price elasticities were less than unity except for the substitution relationship that existed between ice cream novelties and ice milk or sherbet, similar to the results found for the compen-sated demand. A substitution relationship also existed between ice milk or sherbet and ice cream novelties. Some of the ice cream products served as complements to others. Complementary relationships were found between frozen ice cream novelties and bulk ice cream, as well as between bulk ice cream and ice milk or sher-bet.
Expenditure elasticities from the censored demand model were all positive and statistically significant at the 1% level (Table 5). The estimated expenditure elas-ticities from the specified model produced elaselas-ticities that were greater in magnitude than estimates reported in other studies. In particular, the results reported by Boehm and Babb (1975) were considerably smaller at 0.047, −0.009, 0.070, and 0.149 for ice cream, ice milk, total bulk packaged products, and novelties, respec-tively. Veeman and Peng (1997) found the expenditure elasticity for ice cream to also be elastic (1.46). One reason for the difference in magnitude of these elasticity estimates over time may be changing demand trends.
Over the past 4 decades, there have been large increases in household disposable income as well as an increase in the varied selection of products, which enhances the possibility for more substitution among commodities.
CONCLUSIONS
[image:6.612.98.495.90.186.2]Empirical analysis of the Nielsen (2005) purchase data for 3 ice cream categories suggested that regional and demographic characteristics may play a role in determining estimates of aggregate national demand price and income factors that influence demand for the products. Results revealed that price and income were the main driving force in determining the demand for bulk ice cream, frozen novelties, and ice milk or sherbet. Estimates from the censored translog demand system provided similar results for the own-price to those that Maynard and Venkat Narayanan (2002) reported. The relative elasticity of the own-price elasticities suggested that ice cream manufacturers and marketers must care-fully evaluate any price-changing strategies. Our ex-penditure elasticity for bulk ice cream was elastic and somewhat comparable to that reported by Veeman and Peng (1997). As noted, it is not possible to make direct comparisons between the results derived in this study and the results from other analytical works. However, our results do seem comparable to some of the previ-ously derived results. Ice cream and frozen dessert prod-ucts make up an important and, over time, relatively stable component of the United States dairy industry. Ongoing efforts to examine consumer demand for these products will assist milk producers, dairy processors and manufacturers, and dairy marketers as they face changing consumer responses to food and diet issues.
Table 4. Censored demand compensated price elasticities
Product1 Bulk ice cream Ice milk Ice cream novelty
Bulk ice cream −0.05*** 0.12 −0.07 Ice milk 0.85*** −1.16*** 0.31 Ice cream novelty 0.19 1.81*** −2.00***
1Ice milk includes all low-fat products along with sherbets.
[image:6.612.300.553.649.700.2]***P = 0.01.
Table 3. Average size and share of selected demographic variables in the ice cream analysis Demographic variable
(%, unless otherwise noted) 2005 census
2005 Homescan (unweighted)
Homescan ice cream purchasers
Household size (n) 2.6 2.4 2.4
Employed female head 63 54 49
Southern United States 36 38 39
Non-Hispanic White 76 76 77
Married 53 57 60
Children present in home 25 24 25
REFERENCES
Black, J. 2002. Oxford Dictionary of Economics. 2nd ed. Oxford University Press, Oxford, UK.
Boehm, W. T., and E. M. Babb. 1975. Household consumption of perishable manufactured dairy products: Frozen desserts and specialty products. Station Bulletin 105. Department of Agricultural Economics, Agricultural Experiment Station, Purdue University, West Lafayette, IN.
Chouinard, H. H., J. T. LaFrance, D. E. Davis, and J. M. Perloff. 2005. Milk marketing order winners and losers. CUDARE Working Papers, University of California, Berkeley. http://repositories. cdlib.org/are_ucb/1006 Accessed April 14, 2009.
Christensen, L. R., D. W. Jorgenson, and L. J. Lau. 1975. Transcendental logarithmic utility functions. Am. Econ. Rev. 65:367–383. Dong, D., C. Chung, and H. M. Kaiser. 2004. Modeling milk purchasing
behavior with a panel data double-hurdle model. Appl. Econ. 36:769–779.
Dong, D., and H. M. Kaiser. 2005. Coupon redemption and its effect on household cheese purchases. Am. J. Agric. Econ. 87:689–702. Dong, D., and H. M. Kaiser. 2008. Studying household purchasing and
non-purchasing behavior for a frequently consumed commodity: Two models. Appl. Econ. 40:1941–1951.
Einav, L., E. Leibtag, and A. Nevo. 2008. On the accuracy of Nielsen Homescan data. Economic research report no. 69, Dec. 2008. USDA, Washington, DC.
Huang, K. S., and B.-H. Lin 2000. Estimation of food demand and nutrient elasticities from household survey data. Technical bulletin no. 1887, Aug. 2000. USDA, Washington, DC.
Kaiser, H. M., and O. D. Forker. 1993. Analysis of generic dairy advertising scenarios on retail, wholesale, and farm milk markets. Department of Agricultural Economics, Cornell University Agricultural Experiment Station, New York State College of Agriculture and Life Sciences, Cornell University, Ithaca, NY. (unpublished document)
Manchester, A. C., and D. P. Blayney. 1997. The structure of dairy markets: Past, present, future. Agricultural economic report no. 757, Sept. 1997. USDA, Washington, DC.
Maynard, L. J., and V. Venkat Narayanan. 2002. Price sensitivities for U.S. frozen dairy products. Paper presented at the annual meetings of the American Agricultural Economics Association, Long Beach, CA.
Nielsen. 2005. Consumer panel. http://www.Nielsen.com/services/ consumer/ Accessed Oct. 28, 2006.
Schmit, T. M., B. W. Gould, D. Dong, H. M. Kaiser, and C. Chung. 2003. The impact of generic advertising on household cheese purchases: A censored autocorrelated regression approach. Can. J. Agric. Econ. 51:15–37.
Shonkwiler, J. S., and S. T. Yen. 1999. Two-step estimation of a censored system of equations. Am. J. Agric. Econ. 81:972–982. Trager, J. 1997. The Food Chronology: A Food Lover’s Compendium
of Events and Anecdotes, from Prehistory to Present. Henry Holt and Co., New York, NY.
United Dairy Industry Association. n.d. The Household Market for Ice Cream and Related Products. USDA, Rosemont, IL.
Veeman, M., and Y. Peng. 1997. Canadian dairy demand. Project report 97-03. Department of Rural Economy, Faculty of Agriculture, Forestry, and Home Economics. University of Alberta, Edmonton, Canada.
Yen, S. T., and B. Lin. 2006. A sample selection approach to censored demand systems. Am. J. Agric. Econ. 88:742–749.
APPENDIX
For the purpose of this study, ice cream products were assumed to be separable from all other goods. In the first step of the procedure, censoring of each com-modity was governed by the following stochastic sample selection process:
wi =d f xi⎣⎢⎡i( ; )θ +ei⎤⎦⎥,i=1,..., ,n [1]
where di = 1 if z′γi + ui > 0 and di = 0 if z′γi + ui ≤ 0;
wi is the expenditure share of the ith commodity; x and
z are vectors of explanatory variables; θ and γi are
vec-tors of parameters; and ei and ui are random errors.
Using a translog utility function (Christensen et al., 1975), the translog demand system in expenditure share form can be derived as
w v v i n i i j j j ij j n j n kj j n k n = + + = = = = =
∑
∑
∑
∑
α β α β 11 1 1
1 log
log
, ,..., , [2]
where β and α are parameters and vj is
expenditure-normalized price for commodity j. By using normalized prices for all commodities, homogeneity is implied in the above equation and symmetry is imposed with the restrictions
βij =βji ∀ i j, . [3]
We allowed the intercepts αito vary with
demograph-ic variables hℓ such that
αi αi αih i n L
= + = −
=
∑
0 1 1
1
ℓ ℓ
ℓ
, ,..., , [4]
where ℓ = 1,….,L.
6215
OUR INDUSTRY TODAY
[image:7.612.119.517.90.141.2]Journal of Dairy Science Vol. 92 No. 12, 2009
Table 5. Censored demand uncompensated price and expenditure elasticities
Product1 Bulk ice cream Ice milk Ice cream novelty Expenditure
Bulk ice cream −1.00*** −0.02*** 0.00 1.01***
Ice milk 0.07 −1.28*** 0.37*** 0.84***
Ice cream novelty −0.27** 1.74*** −1.96*** 0.50***
1Ice milk includes all low-fat products along with sherbets.
One of the challenges of working with the censored system approach specified above is that the adding-up restriction cannot be imposed. Following the approach suggested by Yen and Lin (2006), we estimated the first n – 1 equations and calculate elasticities for the nth equation using the adding-up property in demand theory. Even though the estimates are not invariant to the equation excluded, Yen and Lin (2006) showed that the elasticity estimates are stable regardless of which commodity is treated as the residual category.
The system of demand equations in share form can be written as
wi =E w( )i +ξi =Φ(z′γi) ( ; )f xi θ +δ φi (z′γi)+ξi, [5]
where δi is the covariance between the error terms ei
and ui; Φ(z′γi) and φ(z′γi) are the normal cumulative
distribution and probability density functions,
respec-tively; and ξi = wi – E(wi) is a heteroskedastic error
term, with E(ξi) = 0 (Shonkwiler and Yen, 1999).
The system can be estimated using the 2-step proce-dure. First, we obtained maximum likelihood estimates for γi based on binary probit for wi = 0 and wi > 0.
Second, assuming that the disturbances (ei, ui) were
distributed bivariate normal with cov(ei, ui) = δi, we
estimated the demand parameters θ and covariances δi
in the system
wi =Φ( ˆ ) ( ; )z′γi f xi θ +δ φi ( ˆ )z′γi +ξi [6]