http://dx.doi.org/10.4236/ijcns.2016.94006
3D Mobile Augmented Reality Interface for
Laboratory Experiments
Clement Onime1, Olatunde Abiona2
1Information and Communication Technology Section, Abdus Salam International Centre for Theoretical
Physics, Trieste, Italy
2Department of Computer Information Systems, Indiana University Northwest, Gary, IN, USA
Received 5 March 2016; accepted 24 April 2016; published 27 April 2016
Copyright © 2016 by authors and Scientific Research Publishing Inc.
This work is licensed under the Creative Commons Attribution International License (CC BY). http://creativecommons.org/licenses/by/4.0/
Abstract
In fields such as science and engineering, virtual environment is commonly used to provide re-placements for practical hands-on laboratories. Sometimes, these environments take the form of a remote interface to the physical laboratory apparatus and at other times, in the form of a complete software implementation that simulates the laboratory apparatus. In this paper, we report on the use of a semi-immersive 3D mobile Augmented Reality (mAR) interface and limited simulations as a replacement for practical hands-on laboratories in science and engineering. The 3D-mAR based interfaces implementations for three different experiments (from micro-electronics, power and communications engineering) are presented; the discovered limitations are discussed along with the results of an evaluation by science and engineering students from two different institutions and plans for future work.
Keywords
Mobile Augmented Reality, Laboratory Experiments, 3D
1. Introduction
Computers are used in learning for digitization, storage and manipulation of pedagogical material into learning objects; they are also used for content delivery to learners and subsequent assessment (or testing) in a combina-tion of textual, graphical or audio-visual formats. For example, the learner is presented with a set of multiple choice questions and the answers are collected for immediate or later grading.
Most smart-phones and tablet (or mobile) devices provide output to users through three basic channels which are sound speaker(s), a visual display screen and the ability to vibrate. These are used for providing auditory, visual and haptic feedback respectively. The simple mobile devices collect input using a microphone device and a data-entry keypad, while more advanced devices also include additional sensors such as multi-touch input (display), photo/video camera, global positioning system (GPS)/location sensor, accelerometer (for acceleration) and ambient light level (sensor).
The rest of this paper is structured as follows: Section 2 discusses reality and mobile augmented reality, while Section 3 focuses on augmented reality for laboratory experiments; Section 4 presents the results of an interna-tional survey of scientists (academic-staff and students) conducted to evaluate the implementations.
2. Reality and 3D
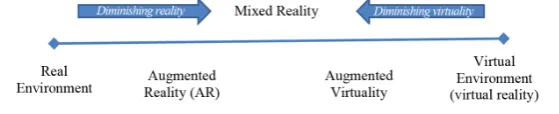
Humans typically perceive and relate with the 3D world or the surrounding environment around them using the five physiological senses of sight, smell, touch, sound and taste, although sight, sound and touch are more rea-dily used. Stimulating one or more of the five physiological senses conveys reality in a 3D world. Within a 3D world/environment, reality is defined as a state of having existence or substance [4], that is, reality involves ob-jects that may be actually experienced and/or seen and virtuality as the opposite of reality involves a notional (non-realistic) view of objects. The Reality-Virtuality Continuum [5] highlights the opposing relationship be-tween reality on the one hand and virtuality on the other hand as illustrated in Figure 1.
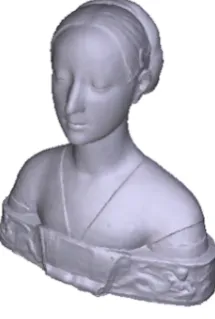
“Formatted text” and images, just as one may find in a printed book. Mobile devices or portable readers are capable of storing large quantities (hundreds) of e-books for transporting and learner-friendly display and inte-ractions. For example, the size of text may be enlarged or reduced to suit individual learner preference and digi-tal annotations may be added to sections and/or shared collaboratively with other learners. Some e-book formats, such as the portable document format (PDF) include the ability to embed 3D objects for display on a suitable 2D interface. Viewers can interact with the 3D object and carry out manipulations such as angular rotation (360 de-grees) or flip vertically (upside-down). Figure 2 shows a PDF document with an embedded 3D object [6].
2.1. Augmented Reality (AR)
[image:2.595.174.454.651.708.2]The continuum shown in Figure 1 identifies two kinds of mixed reality environments: Augmented Reality (AR) and Augmented Virtuality. AR would refer to an environment which is predominantly composed of real objects but includes a few virtual objects within it. AR may be perceived as an integrated view of a 3D physical real en-vironment that is enhanced through the use of computer generated or digital data [5][7]. While this definition emphasizes the graphical (visual) nature of AR, [8], contextually spoke of AR as augmenting/enhancing the natural feedback to an operator with simulated cues, which suggests that, apart from a visual form, augmentation may also be auditory (the delivery of sound) and haptic (the delivery of tactile feedback touch, pressure or vi-brations). In AR, visual, auditory and haptic augmentations may be used all-together as outputs although, the visual form is more commonly encountered [9]. Learning objects that are enhanced with auditory and haptic feedback are quite useful for the visually challenged learners [10]. AR may be considered as the real-time fusion
Figure 2. E-book (PDF) file with 3D object embedded.
of virtual objects (information) into a three dimensional real world environment, where the word “object” in-cludes visual, auditory, haptic inputs/outputs and digital data such as real-time video, audio or even data from various sensors. Similar to VR systems, users of AR systems are able to interact with the objects in real time. Unlike VR systems, where the goal is to completely immerse the user in the virtual environment, the goal in AR is to seamlessly blend or combine the virtual objects into the real world in order to enhance or compliment the real objects for a semi-immersive ([11]) experience. An AR system manages the interactions between end-user and both virtual and real objects, as well as, the integration/interactions between the real and virtual objects. For example, clashes between the placement of virtual and real objects have to be resolved and in certain cases, shadows from virtual objects drawn or rendered over real objects.
2.2. Mobile Augmented Reality (mAR)
Mobile Augmented Reality (mAR) is the application of AR via (or to) mobile devices such as portable custom- gear, head-mounted devices (HMD), smart-phones and tablets. While the use of custom-gear, HMDs, other highly specialized hardware devices and equipment contribute to making AR technologically expensive, the use of smart-phones/tablet devices in mAR is cost-effective thanks to the availability of good quality touch-screen displays and an array of in-built sensors on such devices.
Various implementations of mAR from diverse fields such as architecture and tourism range from providing passive information (text, audio and video overlays) based on input from the sensors about the user physical lo-cation, movement and gestures to engaging the users in role playing (gaming) activities with the discovery of additional material [10].
3. AR for Laboratory Experiments
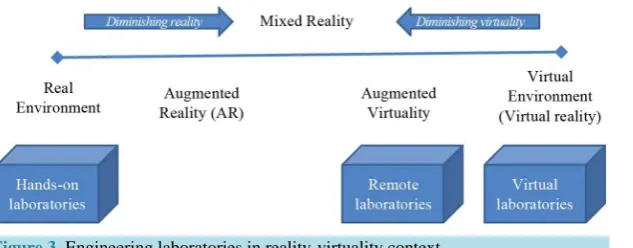
In Science and Engineering Laboratories, the location of apparatus (equipment) is physically fixed (within the four walls of a laboratory), and the users/learners are physically present in the laboratory concurrently [12]. There are a growing number of challenges with use of physical laboratories as scaling the limited facilities for capacity is difficult and expensive, while access to facilities is always limited to school work-hours or according to a fairly rigid schedule [13]. In engineering, remote access (especially across different time-zones) is widely used for sharing laboratory apparatus. The Sciences appear to lean towards the use of virtual laboratories, which are generally computer based software simulations based on mathematical model(s)/representation(s) of appara-tus and data (input or output) [14].
Figure 3. Engineering laboratories in reality-virtuality context.
[15]. The hands-on physical laboratories would be at the Realism end, remote laboratories are in the mixed- reality zone and virtual laboratories are at the other extreme. Without any visible view of the apparatus, the user- interface of most remote laboratories are typically computer-generated environments with the insertion of real data taken from the remote apparatus, which is consistent with an augmented virtuality environment of Figure 3.
Several works have considered the use of AR for improving the experience obtained from both virtual and remote laboratories. [15] Augmented a remote laboratory by delivering a real-time video feed of the apparatus alongside an interactive user-interface which also allowed for limited, remote wiring of digital (electrical) cir-cuits. Similarly, [13] delivered a video feed from the equipment but uses AR techniques to display either the di-rect output from the (remote) equipment’s screen or overlay the output with an alternative/virtual (local comput-er gencomput-erated) vcomput-ersion.
Figure 4 shows how a remote laboratory may be augmented through the inclusion of a video feed. The aug-mentation would be classified as monitor-based AR when it happens at the laboratory (back-end) server or video see-through AR when the augmentation happens at the user end.
A haptic (non-visual) augmentation of a web based virtual laboratory system was reported in [16]. While, [17]
presented an AR application for mechanical engineering that allows users to interact with a web based 3D model of piston. The above AR implementations were mainly web-based for use on table-top/desktop or laptops com-puters where interactivity is defined by the standard Human Computer Interface (HCI). In [3] mAR based tangi-ble user interface that allowed users to visualize otherwise invisitangi-ble physical quantities in scientific experiments was reported. However, the AR devices used were tailor-made to be portable and built from easy to obtain components [3].
3.1. Implementation
A different/novel mAR implementation that focuses on the use of commodity smart-phones/tablets as AR plat-forms was the result of a joint collaboration between the University of Ulster in Ireland and the International Centre for Theoretical Physics (ICTP), Trieste, Italy [18]. This approach employs video see-through AR, where the real environment is composed of a live video feed from the smart-phone/mobile-device camera and virtual objects are superimposed on this live video feed. A 2D photographic image of laboratory equipment/apparatus is used as the AR marker as this conveys added realism to the semi-immersive experience where the user moves seamlessly between both the real and virtual environments. For practical laboratory experiments, the approach facilitates the digital capture and presentation of individual experiment, usually conducted within a physical la-boratory and also allows replicating the step-by-step procedure (for conducting the experiment) with minimal transformations. This approach was successfully applied to hands-on experiments in micro-electronics [19]-[21], communications engineering [22][23] and also visualization [24]. This section presents the generic aspects of the 3D user-interface of the AR implementations of both experiments. The steps required for installing the soft-ware on suitable devices (with touch-screen and camera) are not presented.
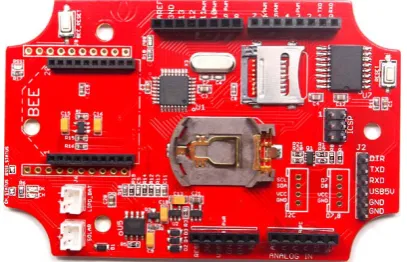
On starting the AR application, the end-user is presented with a full-screen view of the video stream from the in-built camera device and nothing happens until the AR marker (2D photographic image of apparatus shown in Figure 5) comes into view.
Figure 4. Augmenting a remote laboratory.
Figure 5. AR marker for micro-electronics experiment.
sub-components such as button-battery removed. Once the marker object is recognized, the AR application commences tracking by highlighting several pre-selected hot-spots (on the marker) and also creates/overlays virtual objects such as additional laboratory components over the video image and then wait for user interaction. Figure 6 shows the AR view of the micro-electronics experiment, where the physical environment (live video- feed) contains the 2D image of the apparatus (board) and 2 virtual (computer generated) components (a Light Emitting Diode (LED) and a resistor).
On touching a hot-spot (sub-part of the apparatus), the user is rewarded with a textual description that could also contain hyper-links to additional information or related experiments. Figure 7 shows the display following the selection of several hot-spots. A subsequent touch of a hot-spot would remove (hide visibility of) the textual description.
In the micro-electronics experiment [20], the user builds the desired circuit using the virtual components shown in the touch-screen, following the same step-by-step procedure used in the laboratory. Once the circuit is completed, the LED provided as a virtual component is pulsated just as in a physical experiment. The user may additionally use a slider to vary the pulse rate and is rewarded with the code of micro-controller program used to vary the pulse rate in the physical experiment.
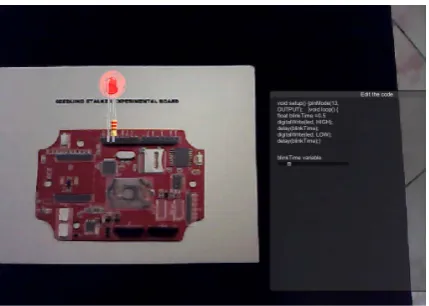
Figure 8 shows the final view (completed experiment) with both resistor and LED connected. The LED is pulsating and the insert on the right-hand-side shows the micro-controller code fragment used for pulsating the LED during a physical experiment. In the 2nd communications experiment [20], the 3D user interface focuses on visualizing an otherwise invisible quantity (radiation pattern) and also studying the resulting effect of physi-cal changes. The AR application for this experiment is capable of tracking 3 different markers shown in Figure 9, although only one is tracked at a time.
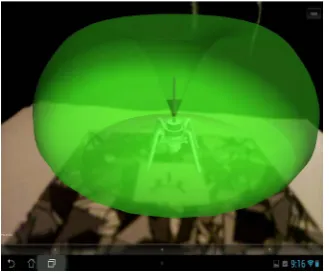
As shown in Figure 10 and Figure 11, the AR application displays a 3D visualization of an antenna’s asso-ciated radiation pattern when a marker is tracked. With the 3D effect, the user is able to approach and also zoom the displayed pattern at different angles.
[image:5.595.205.421.89.234.2] [image:5.595.213.417.233.364.2]Figure 6. AR view of the micro-electronics experiment.
Figure 7. AR view after selection of several hot-spots.
Figure 8. AR view of micro-electronics experiment with pulsating LED.
parameters are only supported in 2D mode.
[image:6.595.206.421.455.608.2]Figure 9. AR markers.
[image:7.595.233.395.293.426.2]Figure 10. AR view of radiation pattern from Cantenna in 3D.
Figure 11. AR view of radiation pattern from spider antenna in 3D.
Up on till a few years ago, AR was considered an expensive technology used mainly by the military. The ad-vent of powerful mobile devices such as tablets has completely revolutionized AR research and AR is now seen as a powerful tool that can be deployed for both formal and informal learning in science and engineering [3].
3.2. Units
[image:7.595.232.397.454.591.2]4. Results and Evaluation
A questionnaire based survey was conducted to evaluate the AR applications. Respondents to the evaluation (a hundred and forty-eight engineering and sciences students from two institutions, the Addis Ababa University, Addis Ababa, Ethiopia and the ObafemiAwolowo University, Ile-Ife, Nigeria), were asked to anonymously evaluate both AR applications described in section 3. The concept of deploying AR application for laboratory experiments is equally applicable for graduate students with lab-experiment requirement in their programs. Open ended questionnaire were used to collect data (subjective opinion) about the quality and satisfaction with the AR experiments. Majority of respondents reported that the applications were their first (conscious) contact with AR technology, although their mean age range was between 21 and 24 years. A professor from each insti-tution served as a voluntary local contact that also ensured that consenting volunteers (valid students) partici-pated in the study without incentives, risks and disadvantages. Participants were provided with an information sheet that informed them of the purpose of the study, provided assurance of confidentiality, the intended use and end-of-life of the collected data. The sample population was found to be quite diverse with 74% undergraduate students (40% from final year, 21% from 1st year and rest are sophomores and Juniors), 19% female, 41% were from the department of Computer Science & Engineering, 27% from the department of Electronic & Electrical Engineering, 10% from Computational Science, while 22% were from Physics and Mathematics departments. Data analysis involved identifying commonalities from the supplied responses for subsequent categorization and counting.
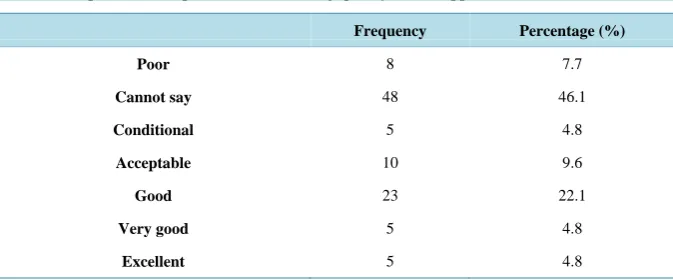
Table 1 shows the responses from 104 participants to the question of the rendering quality of the AR applica-tions.
As shown in Table 1, about 46% of respondents felt they lacked the experience to provide an opinion about rendering quality on what was their first (conscious) encounter with AR technology. In total, about 41% of the respondents found it to be acceptable or better, while less than 8% felt it was of poor quality. Less than 5% felt the quality of rendering was conditional on other external factors and listed quality of camera or display as the key issue.
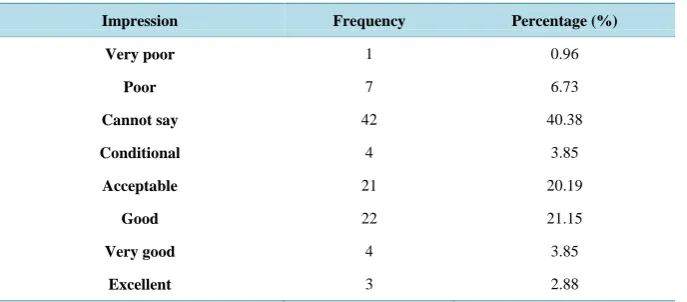
Table 2 shows the responses from 104 participants to the question of the fidelity (simulation quality) of the AR applications.
[image:8.595.151.488.581.721.2]The AR applications focused on the simulation of the step-by-step procedure of an experiment along with the expected input and output combined with required 3D modeling of shapes and objects. As Table 2 shows, about 48% of the respondents found the simulation fidelity of the AR applications acceptable, while less than 8% found
Table 1. Respondent’s impression of rendering quality of AR applications.
Frequency Percentage (%)
Poor 8 7.7
Cannot say 48 46.1
Conditional 5 4.8
Acceptable 10 9.6
Good 23 22.1
Very good 5 4.8
Table 2. Respondent’s impression of the fidelity of the AR applications.
Impression Frequency Percentage (%)
Very poor 1 0.96
Poor 7 6.73
Cannot say 42 40.38
Conditional 4 3.85
Acceptable 21 20.19
Good 22 21.15
Very good 4 3.85
Excellent 3 2.88
it poor. Slightly over 40% choose not to respond due to prior stated considerations. Less than 4% felt the simu-lation fidelity was dependent on other external issues and cited computational power (processor performance) and overall build-quality of mobile device as major hindrances to fidelity.
5. Conclusion
In this paper, we presented an application of Augmented Reality (AR) technology for hands-on practical labora-tory experiments for Science and Engineering students. The implementation approach focuses on the use of commodity mobile devices (smart-phones/tablets) as AR platforms. The 3D user interfaces of two AR applica-tions implemented for hands-on practical experiments were presented and discussed, along with evaluation by the students from two academic institutions. The results of the study showed that the participants (students) found the AR technology easy to use, and they were satisfied with the simulation and rendering quality of the implemented AR applications.
Acknowledgements
The authors wish to thank Prof. S. Radicella, Prof. E. Pietrosemoli, Dr. M. Zennaro of the Telecommunications/ ICT for Development Laboratory (T/ICT4D), International Centre for Theoretical Physics (ICTP) and Engr. Mattia Santachiara of Santa’s Co. (Software Developing-3D Graphic-Augmented Reality-Games-Digital Enter-tainment), Regio-Emilia, Italy.
References
[1] Albrechta, U., Nolla, C. and von Jan, U. (2013) Explore and Experience: Mobile Augmented Reality for Medical Training. In Lehmann, C.U., Ammenwert, C. and Nahr, C., Eds., MEDINFO 2013: Studies in Health Technologies and Informatics, Vol. 192, IMIE & IOS Press Copehegen, 382-386.
[2] Canessa, E. and Zennaro, M. (2012) A Mobile Science Index for Development. International Journal of interactive Mobile Technologies, 6, 4-6.
[3] Davidsson, M., Johansson, D. and Lindwall, K. (2012) Exploring the Use of Augmented Reality to Support Science Education in Secondary Schools. 7th international Conference on Wireless, Mobile and Ubiquitous Technology in Education, IEEE Computer Society, Takamatsu, 27-30 March 2012, 218-220. http://dx.doi.org/10.1109/wmute.2012.52
[4] Oxford Dictionaries (2014) Reality. Definition of Reality in Oxford Dictionary (British & World English). Oxford University Press, Oxford. http://www.oxforddictionaries.com/definition/english/reality
[5] Milgram, P., Takemura, H., Utsumi, A. and Kishino, F. (1994) Augmented Reality: A Class of Displays on the Reality- Virtuality Continuum. Telemanipulator and Telepresence Technologies, SPIE, 2351, 282-292.
http://dx.doi.org/10.1117/12.197321
[6] Cignoni, P. (2013) The Tex Showcase. http://www.tug.org/texshowcase/Laurana.pdf
[7] Annaffismo Innanzitutto [Ilsantass] (2013) Santa’S Co. & ICTP at World Teachers Day 2013—UNESCO—Paris—AR Cave—Part 1. http://www.youtube.com/watch?v=Gr4_zuMl_qM
[12] Coller, D.B. (2008) An Experiment in Hands-On Learning in Engineering Mechanics. International Journal of Engi-neering Education, 24, 545-557.
[13] Andujar, J.M., Mejias, A. and Marquez, M.A. (2011) Augmented Reality for the Improvement of Remote Laboratories: An Augmented Remote Laboratory. IEEE Transactions on Education, 54, 492-500.
http://dx.doi.org/10.1109/te.2010.2085047
[14] Shanab, S.A., Odeh, S., Hodrob, R. and Anabtawi, M. (2012) Augmented Reality Internet Labs versus Hands-On and Virtual Labs: A Comparative Study. International Conference on Mobile and Computer Aided Learning (IMCL), Am-man, 6-8 November 2012, 17-21. http://dx.doi.org/10.1109/IMCL.2012.6396444
[15] Odeh, S., Shanab, S.A., Anabtawi, M. and Hodrob, R. (2012) Remote Augmented Reality Engineering Labs. Proceed-ings of the 2012 IEEE Global Engineering Education Conference (EDUCON), Marrakech, 17-20 April 2012, 1-6.
http://dx.doi.org/10.1109/educon.2012.6201162
[16] Cardoso, A., Restivo, M. T., Cioga, P., Delgado, M., Bicker, J., Nunes, E. and Gil, P. (2012) Demonstration of Online Educational Modules with Online Experiments. 2012 9th International Conference on Remote Engineering and Virtual Instrumentation (REV), Bilbao, 4-6 July 2012, 1-2. http://dx.doi.org/10.1109/rev.2012.6293180
[17] Annaffismo Innanzitutto [Ilsantass] (2013) Santa’S Co. & ICTP at World Teachers Day 2013—UNESCO—Paris— AR Seeduino Board—Part 2. http://www.youtube.com/watch?v=rxFM__7ZA8c
[18] Onime, C., Uhomoibhi, J. and Radicella, S. (2015) Mare: Mobile Augmented Reality Based Experiments in Science, Technology and Engineering. In: Restivo, M.T.R., Cardoso, A. and Lopez, A.M., Eds., Online Experimentation:
Emergent Technologies & the Internet of Things, The International Frequency Sensor Association (IFSA), Barcelona, In Press.
[19] Onime, C., Uhomoibhi, J. and Zennaro, M. (2014) Demonstration of a Low Cost Implementation of an Existing Hands- On Laboratory Experiment in Electronic Engineering. 2014 11th International Conference on Remote Engineering and Virtual Instrumentation (REV), Porto, 26-28 February 014, 195-197.
[20] Onime, C., Uhomoibhi, J. and Zennaro, M. (2014) A Low Cost Implementation of an Existing Hands-On Laboratory Experiment in Electronic Engineering. International Journal of Engineering Pedagogy, 4, 1-3.
http://dx.doi.org/10.1109/rev.2014.6784253
[21] FitzGerald, E., Adams, A., Ferguson, R., Gaved, M., Mor, Y. and Thomas, R. (2012) Augmented Reality and Mobile Learning: The State of the Art. In: Specht, M., Sharples, M. and Multisilta, J., Eds., 11th World Conference on Mobile and Contextual Learning (mLearn 2012), CEUR, Helsinki, 62-69.
[22] Liarokapis, F., Mourkoussis, N., White, M., Darcy, J., Sifniotis, M., Petridis, P., Basu, A. and Lister, P.F. (2004) Web3D and Augmented Reality to Support Engineering Education. World Transactions on Engineering and Technol-ogy Education, 3, 11-14.
[23] Onime C., Uhomoibhi, J. and Pietrosemoli, E. (2015) An Augmented Virtuality Based Solar Energy Power Calculator in Electrical Engineering. International Journal of Engineering Pedagogy, 5, 4-7.
http://dx.doi.org/10.3991/ijep.v5i1.3841