Munich Personal RePEc Archive
Wage disparity and team performance in
the process of industry development:
Evidence from Japan’s professional
football league
Yamamura, Eiji
7 December 2010
Online at
https://mpra.ub.uni-muenchen.de/27363/
1
Wage disparity and team performance in the process of industry
development: Evidence from Japan’s professional football league
Eiji Yamamura
Department of Economics, Seinan Gakuin University, 6-2-92 Sawara-ku, Nishijin, Fukuoka
814-8511, Japan
Abstract
The changing effects of wage disparity on team performance during the process of industry
development are examined using data sourced from the Japanese professional football league. The
results show that wage disparity leads to a reduction in team performance during the developing
stage but does not influence performance during the developed stage. Unobserved fixed team effects
and endogeneity bias were controlled in the study.
Keywords: Wage disparity, team performance, industry development
JEL classification: J31; L20
Tel: 81-92-823-4543, Fax: 81-92-823-2506
2
1. Introduction
Two conflicting views exist regarding wage disparity within sports teams and its effect on team
performance in professional leagues. One theory purports that wage equality improves team
performance and will, therefore, will enhance worker cooperation (Levine 1991). There are a
number of studies that support this view (e.g., Depken 2000; Richards and Guell 1998; Sommer
1998; Wiseman and Chatterjee 2003). In contrast, tournament theory suggests that wage inequality
leads to higher worker productivity (Lazear and Rosen 1981; Rosen 1986)1. If this is true, wage
inequality improves team performance, which is also supported by empirical evidence (Avrutin and
Sommers 2007)2.
Previous studies have not considered endogeneity in wage inequality, and so their results appear
to exhibit estimation bias. This paper attempts to control for this bias by using the dynamic panel
model. Furthermore, the effect of wage inequality on team performance possibly depends on the
conditions within professional sports leagues, an aspect that has not been sufficiently investigated.
For instance, the skill level of professional sports leagues can appear low during inception stages,
and then improve over time, through experience and technology transfers from more advanced
foreign leagues (Yamamura 2009). During this development process, the effect of income inequality
on team performance may change. Using data sourced from the Japanese professional football
league (J-League), established in 1993, this paper examines the relationship between wage inequality
and team performance in the context of industry development.
2. Data and Model
Approximately 200 countries belong to the Fédération Internationale de Football Association
1 Ramaswamy and Rowthorn (1991) suggest that ‘damage potential’ leads to a positive
relationship between wage inequality and team performance.
2
3
(FIFA), while only 32 teams, those that win preliminary rounds, are able to participate in the final
tournament. Since Japan’s J-League began in 1993, the skills and performance of the Japanese
national team have improved significantly. This improvement is due in part to the transfer of star
players, from professional football leagues in South America and Europe, into the J-league. For
example, Zico (Brazil) and Schillaci (Italy) played in the J-league during its early stages. Prior to
1993, the Japanese national team consisted of amateur players and its performance had been far from
the level required to advance to the World Cup. In 1994, the Japanese team was comprised of
J-League players but failed to qualify for the Football World Cup. However, four years later, the
Japanese team won its preliminary competition and qualified to play in the 1998 World Cup.
Subsequently, the Japanese team has qualified for the last three World Cups (2002, 2006, and 2010)3.
Team level data regarding the J-league was used to examine how the effects of wage disparity on
team performance vary at different team-development stages. This paper uses a data panel to
describe the J-league teams from 1993 to 2006: the developing stage is 1993–1998, before any
World Cup qualifications, and 1999–2006 is the developed stage. The data was sourced from the
Nikkan Sports newspaper from 1994 to 2007. To conduct the estimation (using data from
1993–2006), the sample was divided into developing and developed stages, and the effects of wage
disparity on team performance during the different stages were compared.
Table 1 includes the variable definitions and a summary of statistics. As in Depken’s (2000)
study on baseball, a fixed effects model was also used in this study, with WIN as a dependent
variable, and AVSAL and SALHHI as independent variables and year dummies. However, AVSAL
and SALHHI are also considered as endogenous variables, which create endogeneity bias due tothe
reverse causality that team performance influences players’ salaries and the accompanying wage
disparity within a team. In addition to the fixed effects model, a Arellano-Bond type dynamic panel
3 The 2002 World Cup was held in Japan and Korea. As host countries, Japan and
4
model (Arellano 2003) is used in this paper for the purpose of controlling for endogeneity bias and
unobservable fixed team effects. This paper provides a control for endogeneity bias, a measure not
taken in earlier studies (e.g., Avrutin and Sommer 2007; Berri and Jewell 2004; Depken 2000;
Sommer 1998; Richards and Guell 1998). The estimated function takes the following form:
WIN it = α1 WIN it-1 + α2 AVSAL it + α3 SALHHI it + εt + i, + uit,
whereεt, i,and uit represent the following unobservable effects:tis the year-specific effects, iis the
unobserved team-specific effects, anditis the error term, respectively. t-1is the lagged year of the t
year. The structure of the data set used in this study in panel form. Lagged dependent variable
WINit-1was used as a control in the initial level. AVSAL and SALHHIwere used as endogenous
variables in the dynamic panel modeland the levels of endogenous variables that lagged for two or
more periods could also be used as instrumental variables (Arellano 2003).
3. Results
Table 2 shows the results from the fixed effect estimation, a model also used by Depken
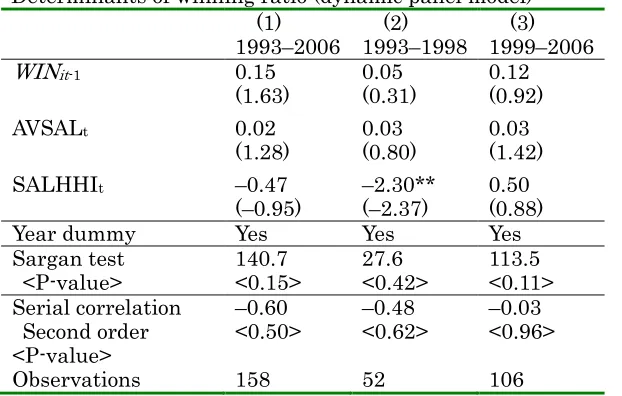
(2000) with regard to a study on major league baseball. Table 3 provides the results of the dynamic
panel estimation. Column (1), in both Tables 2 and 3, shows the data results for 1993 to 2006.
Column (2) shows the results regarding the developing stage, from 1993 to 1998, while column (3)
shows the developed stage results, from 1999 to 2006.
In the interests of brevity, only the results for SALHHI are discussed in this paper. Table 2
shows that SALHHI takes a negative sign and is statistically significant in columns (1) and (2),
which is congruent with the results from the major league baseball study (Depken 2000). However,
column (3) shows that the sign for SALHHI becomes positive and is statistically significant, which
5
Table 3 illustrates Sargan’s over-identification test and second-order serial correlation test,
used to check the validity of the estimation results in the dynamic panel model. The null hypothesis
is that the instrumental variables do not correlate with the residuals. If the hypothesis is not rejected,
the instrumental variables are valid. Further, the test for the null hypothesis (that there is no
second-order serial correlation with the disturbance of the first-differenced equation) is important
because the estimator is consistent when there is no second-order serial correlation. Table 3 shows
that both hypotheses are not rejected in all estimations, suggesting that estimation results are valid.
Interestingly, SALHHI in column (2) continues to yield a negative sign and is statistically significant
at the 5% level, whereas signs for SALHHI in columns (1) and (3) are not statistically significant.
The results from Tables 2 and 3 support the argument that wage disparity within a team reduces team
performance during the developing stage but does not affect it during the developed stage (when
endogeneity bias and the unobservable team fixed effects are controlled). Thus, the gap between the
skills of a star player coming from Europe (or South America) and domestic players is great during
the developing stage. Foreign-born high salaried players with advanced skills cannot sufficiently
integrate within J-league teams, resulting in a reduction in team performance. Later, during the
developed stage, the skill gap among the players is thought to diminish, even where wage inequality
continues to exist, because some domestic players advanced faster technically during the earlier
developing stage. Domestic Japanese players can now match the skill levels of foreign players,
resulting in the harmonization of the team. Thus, the negative relationship between wage inequality
and team performance disappears.
4. Conclusions
A dynamic panel estimation to control for fixed team effects and endogeneity bias was conducted
6
team performance was examined with regard to different industry developmental stages. Empirical
results suggest that wage disparity leads to a reduction in team performance during the developing
7
References
Arellano, M. 2003. Panel Data Econometrics. New York, Oxford University Press.
Avrutin, B.M., Sommers, P.M. 2007. Work incentives and salary distribution in major league
baseball. Atlantic Economic Journal 35, 509-510.
Berri, D.J., Jewell, R.T. 2004. Wage inequality and firm performance: Professional basketball’s
natural experiment. Atlantic Economic Journal. 32, 130–139.
Depken, C.A. 2000. Wage disparity and team productivity: evidence from major league baseball.
Economics Letters 67, 87-92.
Lazear, E.P., Rosen, S. 1981. Rank order tournaments as optimum labor contracts. Journal of
Political Economy 89, 841-864.
Levine, D.I. 1991. Cohesiveness, productivity and wage dispersion. Journal of Economic Behavior
and Organization 15, 237-255.
Nikkan Sports. 1994–2007. J-League Players Meikan (in Japanese). Tokyo, Nikkan Sports Press.
Ramaswamy, R., Rowthorn, R.E., 1991. Efficiency wage and wage dispersion. Economica 58,
501-541.
Rosen, S. 1986. Prizes and incentives in elimination tournaments. American economic Review 76,
701-715.
Richards, D.G.., Guell, R.C. 1998. Baseball success and the structure of salaries. Applied Economics
Letters 5, 291–296.
Sommers, P.M. 1998. Work incentives and salary distributions in the national hockey league.
Atlantic Economic Journal 26, 119.
Wiseman, F., Chatterjee, S. 2003. Team payroll performance in major league baseball: 1985-2002.
Economics Bulletin 1(2), 1-10.
8
9 Table 1
Descriptive statistics of study data (1993–2006)
Definition Mean Standard
deviation
Minimum Maximum
WIN Rate of wins. 0.45 0.15 0.86 0.11
AVSAL Average annual salary of players. (Millions yen)
2.30 0.98 6.24 0.56
10 Table 2
Determinants of winning ratio (fixed effect model) (1)
1993–2006
(2) 1993–1998
(3) 1999–2006
AVSALt 0.04**
(2.62)
0.02 (0.91)
0.03 (1.08)
SALHHIt –0.50*
(–1.82) – 0.64* (–1.96)
1.34* (1.85)
Dummy year Yes Yes Yes
Observations 219 87 132
11 Table 3
Determinants of winning ratio (dynamic panel model) (1)
1993–2006
(2) 1993–1998
(3) 1999–2006
WINit-1 0.15
(1.63)
0.05 (0.31)
0.12 (0.92)
AVSALt 0.02
(1.28)
0.03 (0.80)
0.03 (1.42)
SALHHIt –0.47
(–0.95) –
2.30** (–2.37)
0.50 (0.88)
Year dummy Yes Yes Yes
Sargan test <P-value> 140.7 <0.15> 27.6 <0.42> 113.5 <0.11> Serial correlation Second order <P-value> –0.60
<0.50> – 0.48
<0.62> – 0.03 <0.96>
Observations 158 52 106