The dynamics of delinking in industrial
emissions: The role of productivity, trade
and RD
Marin, Giovanni and Mazzanti, Massimiliano
IMT Lucca (Italy), University of Ferrara (Italy)
2009
Online at
https://mpra.ub.uni-muenchen.de/17536/
http:/ / www.cairn .in fo/ article.php?ID_ REVUE=J IE&ID_ NUMPUBLIE=J IE_ 0 0 3&ID_ ARTICLE=J IE_ 0 0 3_ 0 0 91
The dynamics of delinking in indust rial emissions: The role of product ivit y,
t rade and R&D
par Giovanni MARIN et Massimiliano MAZZANTI
| De Boeck Univer sit é |
Jour nal of Innovat i on Economi cs
2009/ 1 - N° 3
ISSN | pages 91 à 117
Pour cit er cet art icle :
— Marin G. et Mazzant i M. , The dynamics of delinking in indust rial emissions: The role of product ivit y, t rade and R&D,
Jour nal of Innovat i on Economi cs 2009/ 1, N° 3, p. 91-117.
Distribution électron ique Cairn pour De Boeck Un iversité. © De Boeck Un iversité. Tous droits réservés pour tous pays.
IN INDUSTRIAL EMISSIONS:
THE ROLE OF PRODUCTIVITY,
TRADE AND R&D
1
Giovanni MARIN
University of Ferrara, IMT Lucca (Italy) giovanni.marin@imtlucca.it
Massimiliano MAZZANTI
University of Ferrara, Ceris CNR National Research Council, Milan (Italy) ma.maz@iol.it
INTRODUCTION
Indicators of “delinking” or “decoupling”, that is improvements of environ-mental/resource indicators with respect to economic indicators, are increas-ingly used to evaluate progress in the use of natural and environmental resources. Delinking trends for industrial materials and energy in advanced countries have been under scrutiny for decades. In the 1990s, research on delinking was extended to air pollutants and greenhouse gases (GHGs, henceforth) emissions. “Stylised facts” were proposed on the relationship between pollution and economic growth which came to be known as the “Environmental Kuznets Curve” (EKC, henceforth), which was based on general reasoning around relative or absolute delinking in income-environ-ment dynamics relationships. Environincome-environ-mental innovative capacity is currently the key issue for long term sustainability. In fact, environmental innovations are particularly crucial in industrial frameworks since they often give rise to a double externality, providing on the one hand the typical R&D spillovers and on the other hand reducing environmental externalities. They provide a contribution to the Lisbon Objectives on growth and innovation and the
1. We thank Cesare Costantino, Angelica Tudini and all ISTAT Environmental Accounting Unit in Rome for the excellent work of providing yearly updated NAMEA matrixes and for valu-able comments.
917/
jie.00
3.00
Gothenburg priorities on sustainable development complementarities. Actually, in the current situation the “two crises” (economic-financial and environ-mental) can be coherently and jointly tackled insofar as (green) investments may lead to Keynesian increases in demand and a reshaping of the economy along a greener basis. Integrated (eco) product and process innovations, that need high R&D expenses contrary to end-of-pipe solutions, may end up with restructuring production processes and achieve the double dividend of integrating labour productivity and environmental efficiency increases along the dynamic path, mitigating the usual trade-offs that exist between envi-ronmental and economic aims, especially when facing global public good issues such as climate change. The positive correlation between labour and environmental productivities is then the pre-condition for stronger compe-tiveness and sustainability in the long run; innovation is in other words the key to providing private and public benefits. It is obvious that the more innovation is radical the more it is probably costly in the short term. This paper especially focuses on the link between environmental performances and labour productivity by adopting a sector and dynamic lens. Innovation is not the primary focus but, as commented on, is a more or less latent factor that we conceptually deal with and attempt to include as far as possible from both theoretical and empirical perspectives.
The value of this mainly empirical paper is manifold. First, its originality lies in the very rich NAMEA sector based economic-environmental merged dataset for 1990-2005, which is further merged with data on trade openness for the EU15 and extra-EU15 dimensions, and research and development (R&D) sector data. The relatively long dynamics and the high sector heter-ogeneity of these data allow robust inference on various hypotheses related to the “driving forces” of delinking trends. In this paper, we investigate CO2, SOx, NOx and PM102. In addition to core evidence on the EKC shape, we
test the following hypotheses: (a) whether the increasing trends associated with trade openness among EU15 and non-EU15 countries affect emission dynamics, following the “pollution haven” debate (Cole 2003, 2004; Cole and Elliott, 2002; Copeland and Taylor, 2004); (b) whether pre-Kyoto and post-Kyoto dynamics show different empirical structures; (c) whether sector R&D plays a role in explaining emissions efficiency.
The policy relevance of this work lies in: (1) the temporal structural break in pre-Kyoto and post-Kyoto dynamics; and (2) the possibility of investigat-ing inside the branch dynamics that could help to shape EU policies such as refinements to existing Emission Trading Scheme (ETS), or a new carbon tax for specific sectors. The use of NAMEA, which is a panel of observations
for air emissions, value added and employment matched for the same pro-ductive branches of the economy (Femia and Panfili, 2005), is a novelty of our study, compared to other international studies on EKC. We use a disag-gregation at 15 productive branches for manufacturing and energy produc-tion and 4 air emissions.
The paper is structured as follows. Section 2 outlines the main method-ological and theoretical issues. Section 3 presents and discusses our dataset and methodology. Section 4 presents the main findings for the four air emis-sions. Section 5 concludes.
ECONOMIC GROWTH, ENVIRONMENTAL
EFFICIENCY AND INNOVATION
WITHIN DELINKING ANALYSES
Our discussion of some of the approaches to studying delinking begins within a simple IPAT framework that we then use as well as the EKC model for our empirical investigation. The IPAT model defines environmental impact (I, i.e. atmospheric emissions or waste production) as the (multiplica-tive) result of the impacts of population level (P), “affluence” (A) measured as GDP per capita, and the impact per unit of economic activity (i.e. I/GDP) representing the “technology” of the system (T), thus . This is an accounting identity suited to disaggregation exercises aimed at identi-fying the relative role of P, A and T for an observed change in I over time and/or across countries. For example, it implies that to stabilise or reduce environmental impact (I) as population (P) and affluence (A) increase, tech-nology (T) need to change.
While the meaning of P and A as drivers of I is clear, T is an indicator of “intensity” and measures how many units of Impact (natural resource con-sumption) are required to “produce” one unit ($1) of GDP. T is an indicator of the average “state of the technology” in terms of the Impact variable. Changes in T, for a given GDP, reflect a combination of shifts towards sec-tors with different resource intensities (e.g. from manufacturing to services) and the adoption/diffusion in a given economic structure of techniques with different resource requirements (e.g. inter-fuel substitution in manufactur-ing). If T decreases over time, there is a gain in environmental efficiency or resource productivity. Thus T can be directly examined in the delinking analysis by using diverse proxies determined by research hypotheses and data availability. , which is conceptually equivalent to consumption, and T are the main “control variables” in the system.
I = P A T• •
Within an IPAT framework, three aspects of “delinking analysis” and “EKC analysis” emerge. The IPAT may in fact be a fruitful sketched frame-work within which reasoning may take place around the key relationship for sustainable economic development: the influence of (radical) innovations on environmental performances, that is here analysed embedded in models that specify labour productivity as core dynamics.
scale in action at both supply and demand sides of the market. The role of innovation and economic performance, and their relationships, is thus cen-tral in a theoretical framework that sets out to explain the extent to which and for what reasons environmental performance is changing and eventually improving over time.
Sector data analyses, though deficient with respect to the possibility of investigating detailed innovation factors, offer higher generality since they present evidence on country or larger areas, still rooted in crucial sector hete-rogeneity that characterises environmental, innovation and economic per-formances. We here use, as commented below, R&D sector data merged with NAMEA data. R&D is a key input innovation factor that is useful since it should correlate to more radical and integrated greener processes. We do not investigate R&D drivers, an analysis lying beyond our research scope. The two most significant values added in future research are, in our eyes, the integration of sector and firm levels to exploit relative pros and mitigate cons, and the definition of environmentally based sector innovation data (eco-innovations, green R&D).
Let us comment on specifically different parts of the IPAT argument. First, delinking analysis or the separate observation of T may produce ambiguous results. Decreases in the variable I over time are commonly defined as “abso-lute decoupling”, but might not reflect a delinking process if they say nothing about the role of economic drivers and embedded innovation dynamics. An environmental impact growing more slowly than economic drivers is gene-rally described as “relative delinking”. “Absolute delinking” might not occur (i.e. if I is stable or increasing) if the increasing efficiency is not sufficient to compensate for the “scale effect” of other drivers. A multivariate setting is needed to capture robust relative influences on I.
associated with ICT diffusion, which are not captured by resource-specific “induced innovation” mechanisms (through the re-discovery of the Hick-sian “induced innovation” hypothesis in the environmental field), and can vary widely for given levels of GDP/P depending on the different innovative-ness of similar countries. Then, a decrease in T can be related to micro- and macro- non-deterministic processes that also involve dynamic feedbacks, for which economics proposes a set of open interpretations.
Third, EKC analysis addresses some of the above relationships, i.e. between I and GDP or between T and GDP/P, by looking at the direct/indirect “ben-efits” and “costs” of growth in terms of environmental impact. Even though it may highlight empirical regularities that are of heuristic value, it does not directly provide economic explanations. The existence of an EKC could deterministically be misleading in suggesting that rapid growth towards high levels of GDP/P automatically produces greater environmental efficiency and thus growth can be the “best policy strategy” to reduce environmental impact. The link between environmental efficiency and economic performance is relevant in determining the drivers of T and hence the innovative objec-tives of the economic agents. Recently, the theoretical and empirical litera-ture has focused on the assessment of the complementarities between the two performances. Until the paper of Porter and van der Linde (1995), the general idea was that the fulfilment of environmental regulation3 would
reduce the competitiveness of the hit sectors/firms. On the contrary, the so-called “Porter hypothesis” revealed the potential complementarities and (private) beneficial effects of properly designed environmental regulations. In a competitive framework characterized by dynamic efficiency, incomplete information, complexity and uncertainty, private benefits of environmental innovations could remain unexploited. While in some cases environmental regulations are necessary, for other cases information about promising paths of innovation is sufficient (e.g. “early mover advantages”). A first example, based on the classical concept of (static) efficiency, considers the saving of material inputs due to a more eco-efficient production process. A second example, now in a framework of dynamic efficiency, is linked to “early mover advantages”. The adoption of eco-efficient processes in advance respect to competitors creates an economic advantage at the moment when an environmental regulation is introduced. The advantage comes from the inertia of competitors in the adaptation to new environmental standards. Finally, it is worth noting that in general, ecological and economic innova-tions could not be separated. So, ecological innovainnova-tions could be a “by-prod-uct” of economic ones.
We conclude this section with some policy-oriented reasoning. Taking account of national dynamics is highly relevant when reasoning around the underlying dynamics of emissions, policy implementation and policy effec-tiveness. The value of country-based delinking evidence is high. NAMEA-structured studies could provide great value added for the policy arena as well as contributing to the EKC economic debate. (List and Gallet, 1999) Some stylised facts might help. Concerning GHGs and other air polluting emissions, the empirical literature and the general evidence (EEA, 2004a) indicate the emergence of at least a relative but also an absolute decoupling at EU level. Acidifying pollutants, ozone precursors, fine particulates and par-ticulate precursors all decrease. Despite this partially positive evidence, reduc-tions are largely heterogeneous by country and sector. We thus argue that specific in-depth country evidence would be helpful to inform both national policies and, e.g. the core Clean Air For Europe (CAFE) programme, and the implementation of the EU ETS and its modification.
EMPIRICAL MODEL AND DATA SOURCES
Models and research hypotheses
EKC oriented specifications
We test two models; the first uses the EKC framework as a reference (Mazzanti et al., 2008 for a similar formulation) while the second is a modified STIR-PAT model.4
We reformulate the EKC relationship to exploit the sector-level disaggre-gation of NAMEA. We lose standard demographic and income information, but we can take advantage of insights on economic and environmental effi-ciencies in the production process. Equation (1) shows the EKC based empirical model:
(1)
In equation (1) environmental technical efficiency (emissions/full-time equivalent jobs) is a function of a third order polynomial of labour produc-tivity (in terms of value added per full-time equivalent job), individual (sec-tor) dummy variables (β0i) and a temporal structural break (Kyoto), coded 0 for 1990-1997 and 1 for 1998-2005. Logarithmic form of the dependent and
4. STIRPAT is “Stochastic Impacts by Regressions on Population, Affluence and Technology”.
it it it it
it it
it it
it L )=β +βKyoto β (VA L )+β[ (VA L )] β [ (VA L )] +ε
(E 3
4 2 3
2 1 , 0 1
0i ln / ln / ln /
/
explanatory variables enables the estimated coefficients to be interpreted as elasticity.
Third order polynomial form allows us to test for non-linearity (normal/ inverted U or N shaped curves) in the relationship between E/L and VA/L. A significant cubic specification results in N (or inverted N) shaped curves, while a quadratic one signals U (or inverted U) curves. The choice of poly-nomial order in the EKC literature is still somewhat controversial. First, an N-shaped curve indicates that absolute delinking is followed by a return to a monotonic joint trend of environmental pressures and economic growth (re-coupling) determined by a strong scale effect. Second, many authors (e.g. Stern, 1998) point out that both forms allow environmental pressure tend-ing to infinite (plus or minus), both physically impossible outcomes. Finally, N (or inverted N) shaped curves in a medium-short period may indicate a rather volatile relationship. We believe it is relevant to assess these non-lin-ear shapes in our framework, given that we analyse dynamic relationships across different sectors and pollutants.
Individual effects (β0i) capture the specific features of the branch in
terms of average emissions intensity. We estimate these individual effects using a fixed effects model (FEM) following Wooldridge (2005).5 In
addi-tion to the core specificaaddi-tion, we design a sort of “Kyoto” structural break by means of a dummy variable to try to capture direct or indirect effects of the Kyoto Protocol. Direct effects should be GHG (CO2) emissions reductions in response to policies introduced to meet the Kyoto target. Indirect effects will be related to anticipatory strategies for future policies on GHGs and, for pollutants, from ancillary benefits of GHG emissions reductions.6 We can
state, therefore, in addition to specific Kyoto-related effects, that this dummy variable captures temporal variations in emissions linked to various policy effects in EU and Italian environments, and other temporal changes com-mon to all the branches. The antilog of β1 can be viewed as the average level
of emissions ceteris paribus in 1998-2005, with average emissions levels in 1990-1997 equal to 1.
We first extend the base model by adding two trade openness indexes, one for EU15 and one for the extra-EU15 area. Because of the high level of cor-relation between the two “openness indexes” (0.7696) we analyse them sep-arately to overcome potential collinearity problems.
For a review of the theoretical reasoning behind the link between trade openness and emissions growth, we refer among others to Zugravu et al. (2008), Frankel and Rose (2005), Cole (2003, 2004), Cole and Elliott (2002), Dietzenbacher and Mukhopadhay (2006) and Mazzanti et al. (2008). The sign of the relationship depends on two potentially conflicting forces: the delocalisation of polluting industries into less developed areas with lax regu-lation (pollution haven effect) and the country specialisation in capital inten-sive and energy inteninten-sive industrial sectors (factor endowment effect). The originality of our empirical exercise is that we are able to disentangle two trade openness dynamics, within EU15 and extra-EU15. We can state here that EU15 openness is not expected to be associated with pollution haven
effects on the basis of the growing homogeneity of European environmental policies. We can expect then either an insignificant or a negative effect on emissions. EU environmental policies explicitly take account of and correct for potential intra-EU unwanted and harmful for the environment displace-ment of polluting productions in search of lax environdisplace-mental policies. Such homogeneity, linked to the growing stringency in EU-wide environmental regulations, could result in a high correlation between EU15 openness and the stringency of domestic environmental regulation, with a potential ben-eficial effect (race-to-the-top) on environmental efficiency. Communitarian openness, apart from race-to-the-top effects, is related to intra-sector speciali-sation in response to relative abundance/scarcity of factors endowment (linked to particular environmental pressures) and the spread of environmentally effi-cient technologies.
Extra-EU15 openness instead captures the balance between the factor endowment and pollution haven effects. Italy is expected to have a compara-tive advantage in capital (and then pollution) intensive production and more stringent environmental regulation relative to the average extra-EU15 trade partners. Even relying on the empirical evidence on the issue of environ-mental effects of trade openness, we can state that no a priori expectation about the sign of the relationship between extra-EU15 openness and envi-ronmental efficiency is possible.
Finally, we test the effect of R&D/VA, in order to evaluate whether the innovative efforts of enterprises could have a beneficial or negative effect on environmental efficiency7. Generally, the adoption of process/product
innovations occurs with a delay as a consequence of R&D investments. We
use a contemporary R&D/VA ratio because if we use lags we lose too many observations.8
STIRPAT based specifications
The second category of models is an adaptation to a single-country sector disaggregation of the STIRPAT framework. (Dietz and Rosa, 1994; York et al., 2003) The stochastic reformulation of the IPAT formula relaxes the con-straint of unitary elasticity between emissions and population, implicit in EKC studies where the dependent variable is the logarithm of per capita environ-mental pressures. (Martinez-Zarzoso et al. 2007, Cole and Neumayer 2004) This model allows us to investigate explicitly the role of demographic factors in determining environmental pressures and to use a non-relative measure of this pressure as the dependent variable.
We start from a revised IPAT identity, as described in equations 2-4 below, where the emissions (E) for each branch are the multiplicative result of employment (L), labour productivity (VA/L) and emission intensity of value added (E/VA).
(2) (3)
(4)
The above stochastic reformulation of equation (2) has some interesting features. Firstly, it allows separate investigation of the relationship between environmental pressures and employment. Secondly, it uses absolute pressures, which are related more to sustainability issues than relative ones, as the depen-dent variable. We should stress that in our analysis the focus is on labour not population. This opens the window to empirical assessment of labour dynamics associated with technological developments, and then with emissions dynam-ics. For the sake of brevity, we just touch on this issue, referring the reader to other streams of the literature. To sum up, the relationship between emissions
8. The merging of R&D and NAMEA data sources is a worthwhile value added exercise. We are aware that both R&D expenditures are somewhat endogenous with respect to value added in a dynamic scenario. Two stage analysis might be an alternative possibility. R&D is also the input stage of innovation dynamics: data on real innovation adoptions could be more effective at an empirical level. More relevant, eco-innovations and environmental R&D should be the focus in this frame-work. Currently, there are no data from official sources that are at a sufficiently disaggregated level. Only microeconomic data and evidence on environmental innovation processes are available.
) / ( * ) /
(VA L E VA L = E ∗ it β it it β it it β it 0i
it=β (L ) VA L E VA e
E * 1*( / ) 2*( / ) 3*
and employment recalls and is strictly connected to both the (dynamic) rela-tionship between physical capital and labour and the relarela-tionship between emissions and physical capital9. This relationship can identify particular effects
associated with technological change: emission saving effect, labour saving effect and neutral effect.
We maintain the third order polynomial form for labour productivity and add the squared term of employment to test for non-linearities. Individual effects, Kyoto structural break and labour productivity are interpreted simi-larly to the EKC models, the difference being that they now refer to total, not per employee, measures of environmental pressures. Total emissions may be more relevant for effective sustainability assessment, provided that policy targets are defined in total terms. The interpretation of the coefficients of employment varies depending on an increasing or decreasing level of labour In presence of increasing employment, we observe an emissions saving effect when emissions increase less than proportionally with respect to employment (or even decrease) (elasticity <1). A more than proportional increase of emis-sions in comparison with employment shows a labour saving effect (elasti-city >1). When employment is decreasing the effect linked to each range of elasticity values is inverted.
We add trade openness indexes and the R&D/VA ratio (equations not shown for brevity): the explanatory role of these variables in the model is the same as in the EKC framework.
The data
We tested EKC and STIRPAT models for four of the GHG and air pollutant emissions10 included in NAMEA for Italy, using panel data disaggregated at
sector level. In this paper we focus on industry (manufacturing (D) and energy (E) branches) for three main reasons. The first is linked to the economic and environmental relevance of industrial branches, which accounted in 2005 for 34.21% of output, 20.67% of value added, 20.97% of employment, 74.91% of CO2 emissions, 37.85% of NOx emissions, 81.79% of SOx emissions and 34.47% of PM10 emissions. The second concerns the stronger innovatory con-tent of industrial branches with respect to services. The third derives from the policy relevance of industry in terms of both ex-post assessment (the first Kyoto period) and for reasoning on current and future policy implementations (e.g. EU ETS, CAFE and so-called “20-20-20” EU strategy). Additional
9. We refer to Mazzanti and Zoboli (2009), Stern (2004), Berndt and Wood (1979), Koetse et al. (2008).
drivers of emissions intensity are then included in order to control the robust-ness of main specifications and investigate further theoretical hypotheses.
We use NAMEA tables for Italy for the period 1990-2005, allowing branch disaggregation at the 2-digit Nace (Ateco) classification level. In NAMEA tables, environmental pressures and economic data (output, value added11,
final consumption expenditures and full-time equivalent job) are assigned to the economic branches of resident units or to the household consumption categories directly responsible for environmental and economic phenom-ena. We use only data on industrial economic branches with a disaggrega-tion of 15 branches. The added value of using environmental accounting data comes from the definitional internal coherence and consistency between economic and environmental modules.
We exploit the possibility of extending the basic NAMEA by the addi-tion of foreign trade data: for each branch, import and export of the items directly related to the output of the branch are included (CPAteco classifi-cation). Data on national accounting for foreign trade are available from supply (import) and use (export) tables at the 2-digit level of CPAteco classi-fication (51 items) for the period 1995-2004. Istat also produces COEWEB, a very detailed database on Italian foreign trade: time series 1991-2005 of exter-nal trade are available at the 4-digit level of CPAteco classification for A to E capital letters (agricultural sector and industry except F), with a disaggrega-tion for the area (EU15, EU25, EU27 or extra-EU15) of the partner. Unfortu-nately we cannot exploit that database consistently because, for privacy protection reasons, Istat does not publish data for branches with less than three units. However, we use the distinctions between EU15 – extra-EU15 trade as a weighting to split national accounting data. We construct trade openness indicators dividing the sum of imports and exports of every CPAteco category by the value added12 of the corresponding Nace branch.
We also merge NAMEA tables with ANBERD13 OECD Database
con-taining R&D expenditures of enterprises for 19 OECD countries, covering the period 1987-200314. Enterprises’ expenditures are disaggregated
accord-ing to the ISIC Rev. 3 standard, which is not perfectly compatible with Nace classification because it excludes units belonging to institutional sectors dif-ferent from private enterprises. We use the R&D/VA ratio to derive infor-mation on the relative measure of innovative effort of the different branches
11. Output and value added are both in current prices and in Laspeyres-indexed prices. 12. Both trade (import and export) and value added are at current prices, giving a inflation-cor-rected index of openness.
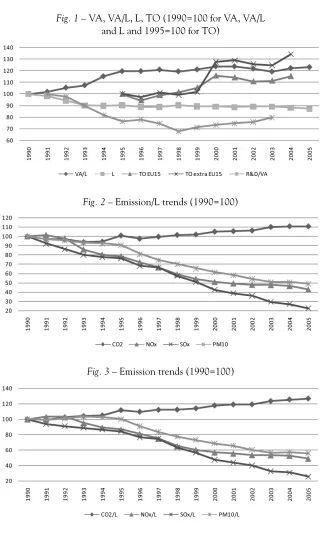
and to get an index in constant prices. Figures 1-3 depict the observed dynamics on which we focus.
EMPIRICAL EVIDENCE
We comment on the main results of various empirical analyses focusing first on CO2 and then on pollutants such as SOx, NOx and PM10.
CO2 emissions
EKC specifications
The evidence for CO2 (Table 3) signals an inverted-U relationship, with a TP exceeding the range of VA/L. The average elasticity of emissions effi-ciency with regard to labour productivity in the linear specification (not shown) is 0.4025, highlighting a relative delinking that confirms our expec-tations. This outcome is as expected given that Italy is still lagging behind the Kyoto target at aggregate level and even focusing on the more innova-tion-intense and regulated parts of the economy such as industry15.
Focus-ing on the “Kyoto structural break” in the series (pre and post 1997), CO2 presents quite clear evidence: the dummy presents a positive sign. It seems, therefore, that neither the Kyoto emergence nor the 2003 Italian ratifica-tion has had significant effects on CO2 emissions performance by the main emitters, industrial sectors. Industry has failed massively to adapt to the new climate change policy scenario, and even Italian environmental policy as a whole has somewhat lagged behind other leading countries in terms of policy efforts16. Future assessments, e.g. of the EU ETS scheme operative
since 2005 in EU (Alberola et al., 2009; Smith and Swierzbinski, 2007), would provide subjects for further research17. Nevertheless, the evidence is
15. Italy is (among EU15) third for total GHGs, 12th for GHGs per capita and 10th for GHGs per GDP and is responsible of 11% of GHGs in EU27. Current GHGs emissions are 10% higher than the Kyoto target (-6.5% for Italy), and are estimated to be in between +7.5% and -4.6% in 2010 depending on the measures adopted. German Watch’s Climate change performance index places Italy 44th in the list of 57 States with major CO
2 emissions, producing 90% of global GHGs. 16. The Italian carbon tax proposal of 1999 was never implemented.
as expected and, in part (in addition to the main sources of private transport, household emissions and services, not presenting delinking as well, even of relative nature), a reason for the lack of absolute delinking regarding CO2 in the Italian industrial macro-sector so far.
Moving on to the results for trade openness and R&D, we note that trade openness factors (neither for EU15 nor extra-EU15) emerge as significant. This may be due to the compensating and opposite effects (pollution haven and capital abundance) of trade on emissions, an explanation proposed by several authors who also found not (very) significant relationships.
R&D18 is hardly relevant: a very weak 10% statistical significance
emerges for CO2, with a positive partially counter-intuitive sign. This result may reflect the weak eco-innovation content of, and low environmental expenditure on, process innovation dynamics in Italian industries, at least on average, and the end of the conceptual nature of most eco processes that have been implemented so far. Economic significance is also low: the coeffi-cient is negligible. We refer to what we said above about the need for further investigation of the relationship using specific environmental innovation data at sector level.
STIRPAT specifications
In this type of analysis we refer to the effects on total emissions, as stated. Table 3 sums up the main regressions related to comments in the text. The evidence on the income-environment relationship is quite similar to what we commented just above. Only relative delinking is present.
The main evidence from the STIRPAT framework relates to the “emis-sions-labour relationship”, which is implicitly defined in EKC model. We note first that the average employment trend, as in other countries, is decreasing for industry. The estimated elasticity is positive (0.47), denoting a “labour saving” interpretation: emissions decrease less than employment in industry, which has “destroyed” labour.
Finally, trade openness continues not to be significant while R&D is again negligibly driving carbon emissions. Kyoto-related evidence is con-firmed as in par. EKC specifications.
Air pollutants
EKC specifications
For NOx, SOx and PM10, which show sharp decreases since 1990, the EKC-related evidence suggests negative (for NOx and SOx) and non-linear cubic (for PM10) relationships, which are worthy of careful investigation. Tables 4-6 present the main regressions in relation to comments in the text.
For PM10 the features of sector DF (coke, oil refinery, nuclear disposal) explain the final increasing part of the curve19. Re-coupling is possibly
explained by initially increasing emissions and labour productivity trends, then (after 1997-1998) a decreasing emissions and productivity figure. Thus, it can be seen that the Italian situation is rather idiosyncratic and character-ised by productivity slowdowns, especially during 2001-2006. In that period aggregate labour productivity decreased by 0.1%20, the only case in the EU,
and many industrial sectors witnessed a significant decrease. This new and contingent stylised fact has implications for our reasoning in terms of the income-environment relationship. On the one hand a positive sign of the relationship and a potential re-coupling, may depend on a decrease in both emissions and productivity21. On the other hand, a slowdown may have
negative implications for environmental efficiency, by lowering investments in more efficient technology, renewable and other energy saving and emis-sions-saving strategies that need initial investment and form the basis of complementarities rather than trade-offs between labour and environmental productivities. (Mazzanti and Zoboli, 2009) Further, the economic slowdown in association with higher than (historically) average oil prices may have created incentives for a re-balancing at the beginning of the century towards coal, as happened in the late seventies in most EU countries.
As stated above, both NOx and SOx show an absolute delinking. This evidence fits with the very sharp decrease in emissions observed over the last 20 years and can be also found in the statistically and economically very sig-nificant “Kyoto break” factor22. We can point out that, especially for SOx,
19. See fig. 5 for a graphic representation of the role of DF as outlier for PM10.
20. Using the NAMEA data we observe a reduction from 1999 to 2003 (-4.8%), then an increase from 2003 to 2004 and finally a further decrease in 2005.
the role played by income dynamics is less relevant for explaining environ-mental pressure dynamics relative to more exogenous factors, which are only partly captured here by the assessment of exogenous (policy) events. These may include the many regulatory interventions on air pollution by EU since the early 1980s (e.g. Directive 1980/779/EC substituted by the 1999/30/EC, Directive 1999/32/EC, the new CAFE (Clean Air for Europe) programme from 2005), and the adoption of end-of-pipe technologies which are cur-rently the main tool for addressing pollution.
Trade openness shows negative and significant coefficients, that are larger for SOx. If on the one hand the extra-EU15 related evidence suggests a stronger weight of the “pollution haven” factor relative to endowments, on the side of EU15 trade the motivations may include a number of perspec-tives. First, increasing trade openness (15.39% and 34.24% from 1995 to 2005 respectively for EU15 and extra-EU15) is associated with a stricter inte-gration in terms of environmental policy, which may explain the good and converging performance of eastern newcomers since the late 1990s. (Zur-gavu et al., 2008) We can confirm that Italy is a “follower” and a convergent country in terms of environmental policy implementation in the EU con-text, thus this hypothesis has robust roots. Such convergence may also (have) occur(red) along pure market dynamics though technological spill-overs and increasing technological and organisational environmental stan-dards, in order to compete with European leaders. Second, along the path of increasing openness, intra-branch specialisations over time may be favour-ing more efficient technologies and production processes. This would sup-port increasing Italian specialisation in more environmentally benign sectors and production processes. It is obvious that a structural decomposi-tion analysis would be the best tool for assessing the relevance of these driv-ing forces captured here, at a lower level of sector detail, usdriv-ing econometric techniques that result in more “average trends and statistical regularities”.
Finally, it should be noted that SOx is the only case where R&D emerges as being associated with a statistically negative and economically significant coefficient23.
STIRPAT specifications
As far as the evidence of emissions vs labour productivity is concerned, the results again partly confirm the EKC analyses. Tables 4-6 sum up the main regressions with reference to the comments in the text. For NOx an N-shaped relationship emerges. The re-coupling is explained only by the behaviour of DF branch, as seen above for PM10 (see Fig. 4). For SOx we found an inverted-N shape, determined in its central section by the positive relation-ship of DG (chemicals, accounting for 3.92% of total SOx emissions in 2005) and E (energy production, electricity, water and gas, accounting for 31.27% of total SOx emissions in 2005) branches. For these branches the temporal reduction in emissions is completely determined by the “Kyoto structural break” while the economic driver play a secondary role in our opinion. We therefore draw attention to this evidence in the light of future policy action on specific industrial sectors. Finally, the evidence for PM10 is of a positive relationship that depends, on average, on the association between lowering emissions and decreasing productivity, a situation we here recall and which characterizes most sectors, this being especially relevant in the second part of the period or even since 1995 (e.g. DF).
The link between labour and emissions dynamics is again central in the STIRPAT model. For pollutants, the estimated coefficients for labour are all well above 1 (apart from SOx) and therefore suggest an emissions saving dynamic, in association with a decrease in industrial employment over the period for most sectors. Over time, then, the size of the emissions/labour ratio reduces. This links the analysis to the reasoning on capital/labour ratio dynamics over time as a consequence of labour saving, neutral or capital sav-ing innovations. (Mazzanti and Zoboli, 2009) The evidence for Kyoto fac-tors, trade openness and R&D are quite the same as for the EKC analysis.
CONCLUSIONS
The results show that, looking at sector evidence, both decoupling and also eventually re-coupling trends could emerge along the path of economic development. Both the way that the stagnation periods affect environmen-tal performance and contingent sector specificity emerge as relevant expla-nations of the various U and N shapes. CO2 seems still to be associated only with relative delinking and performance is not compliant with the Kyoto targets, which do not appear to have generated a structural break in the dynamics. SOx, NOx and PM10 present as expected decreasing patterns, though the shape of the income-environment relationship is affected by some outlying sectors with regard to joint emissions-productivity dynamics. Innovation and policy-related factors may be the main driving force behind observed reductions in SOx. On the other hand R&D intensity shows weak, if any, correlation to emissions in all other cases. This evidence is both scope for further research and a claim towards more intensive private investments in CSR/innovation strategies and public support for core (radical) innova-tion drivers, at least in the short term. Various explanainnova-tions may exist: R&D content has so far not been specifically oriented to increasing environmen-tal efficiency or producing impure public goods externalities; eventual envi-ronmentally-oriented expenditures may take time to impact environmental performance; in addition, a large part of environmental innovation in the period we observe has been of end-of-pipe nature rather than “integrated clean processes”, which are strictly linked to R&D activities.
The analysis of trade expansion over the period validates the pollution haven hypothesis in some cases but also shows opposite evidence when EU15 trade only is considered. This may be due to technology spillovers and a pos-itive “race to the top” rather than to the bottom among the EU15 trade part-ners.
EKC and IPAT-derived models provide similar conclusions overall. The emissions-labour elasticity estimated in the latter is generally different from 1, suggesting a scenario characterised by emissions-saving technological dynamics for pollutants and labour saving for CO2.
REFERENCES
ALBEROLA, E., CHEVALLIER, J., and CHÈZE, B. (2009), “The EU Emissions Trading Scheme: Country-Specific Perspectives of the Impacts of Industrial Production on Carbon Prices”, Journal of Policy Modelling, forthcoming.
BERNDT, E. R. and WOOD, D. O. (1979), “Engineering and Econometric Interpretations of Energy-Capital Complementarity”, The American Economic Review, vol. 69, n° 3, p. 342-54. COLE, M. A. (2003), “Development, Trade and the Environment: How Robust is the Envi-ronmental Kuznets Curve?”, Environment and Development Economics, vol. 8, p. 557-80. COLE, M. A. (2004), “Trade, the pollution haven hypothesis and the environmental Kuz-nets curve: examining the linkages”, Ecological Economics, vol. 48, n° 1, p. 71-81. COLE, M. A. and ELLIOTT, R. (2002), “Determining the trade-environment composition effect: the role of capital, labor and environmental regulation”, Journal of Environmental Economics and Management, n° 46, p. 363-83.
COLE, M. A. and NEUMAYER, E. (2004), “Examining the Impact of Demographic Fac-tors on Air Pollution”, Population & Environment, 26 (1), p. 5-21.
COPELAND, B. R. and TAYLOR, M. S. (2004), “Trade, growth and the environment”,
Journal of Economic Literature, vol. 42, p. 7-71.
DEL RIO GONZALEZ, P. (2008), “Policy implications of potential conflicts between short term and long term efficiency in CO2 emissions abatement”, Ecological economics, vol. 65, n° 2, p. 292-303.
DIETZ, T. and ROSA, E. A. (1994), “Rethinking the Environmental Impacts of Popula-tion, Affluence and Technology”, Human Ecology Review, n° 1, p. 277-300.
DIETZENBACHER, E. and MUKHOPADHAY, K. (2006), “An empirical examination of the pollution haven hypothesis for India: towards a green Leontief paradox?”, Environmen-tal & Resource Economics, vol. 36, p. 427-49.
EEA (2004a), “Air Emissions in Europe”, 1990-2000, Copenhagen, European Environ-ment Agency.
EEA (2004b), “Air Pollution and Climate Change Policies in Europe: Exploring Linkages and the Added Value of an Integrated Approach”, EEA Technical report n° 5/2004, Copenhagen, European Environment Agency.
FEMIA, A. and PANFILI, P. (2005), “Analytical applications of the NAMEA”, Paper pre-sented at the annual meeting of the Italian Statistics society, Rome.
FRANKEL, J.and ROSE, A. (2005), “Is trade good or bad for the environment?”, The Review of Economics and Statistics, vol. 87, n° 1, p. 85-91.
KOETSE, M. J., DE GROOT, H. L. F. and FLORAX, R. J. G. M. (2008), “Capital-energy substitution and shifts in factor demand: A meta analysis”, Energy Economics, vol. 30, p. 2236-51.
LIST, J. A. and GALLET, C. A. (1999), “Does one size fits all?”, Ecological Economics, vol. 31, p. 409-24.
MARTINEZ-ZARZOSO, I., BENGOCHEA-MORANCHO, A. and MORALES-LAGE, R. (2007), “The impact of population on CO2 emissions: evidence from European coun-tries”, Environmental and Resource Economics, vol. 38, p. 497-512.
MAZZANTI, M. and ZOBOLI, R. (2009a), “Environmental efficiency and labour produc-tivity: trade-off or joint dynamics?”, Ecological Economics, vol. 38, p. 1182-94.
MAZZANTI, M. and ZOBOLI, R. (2009b), “Embedding Environmental Innovation in Local Production Systems: SME strategies, networking and industrial relations”, Interna-tional Review of Applied Economics, vol. 23, n° 2, p. 169-95.
MAZZANTI, M. and ZOBOLI, R. (2008), “Complementarity, firm strategies and environ-mental innovations”, Environmental sciences, vol. 5, n° 1, p. 17-40.
MAZZANTI, M., MONTINI, A. and ZOBOLI, R. (2008), “Environmental Kuznets curve for air pollutant emissions in Italy: evidence from environmental accounts NAMEA panel data”, Economic System Research, vol. 20, n° 3, p. 279-305.
PEARCE, D. (1992), “Secondary Benefits of Greenhouse Gas Control”, CSERGE Work-ing Paper 92-12 (London).
PEARCE, D. (2000), “Policy Framework for the Ancillary Benefits of Climate Change Pol-icies”, Paper Presented at the IPCC Workshop on Assessing the Ancillary Benefits and Costs of Greenhouse Gas Mitigation Strategies (Washington DC).
PORTER, M. E. and VAN DER LINDE, C. (1995), “Toward a New Conception of the Environment-Competitiveness Relationship”, Journal of Economic Perspective, vol. 9, n° 4, p. 97-118.
PORTNEY, P. (2008), “The (not so) new corporate social responsability: an empirical per-spective”, Review of environmental economics and policy, vol. 2, p. 261-75.
SMITH, S. and SWIERZBINSKI, J. (2007), “Assessing the performance of the UK Emis-sion Trading Scheme”, Environmental and Resource Economics, vol. 37, p. 131-58.
STERN, D. (1998), “Progress on the environmental Kuznets curve?”, Environment and Development Economics, vol. 3, p. 173–96.
STERN, D. (2004), “Elasticities of Substitution and Complementarity”, Rensselaer Work-ing Papers in Economics, n° 20/2004.
UN, EUROSTAT, IMF, OECD, WORLD BANK (2003), “Integrated Environmental and Economic Accounting 2003 – Handbook of National Accounting”, Final Draft circulated for information prior to official editing, http://unstats.un.org/UNSD/envaccounting. WOOLDRIDGE, J. (2005), Introductory Econometrics – A Modern Approach, Mason (Ohio), Thomson South-Western, 2nd edition.
YORK, R., ROSA, E. A. and DIETZ, T. (2003), “STIRPAT, IPAT and ImPACT: analytic tools for unpacking the driving forces of environmental impacts”, Ecological Economics, n°
46, p. 351-65.
Fig. 1 – VA, VA/L, L, TO (1990=100 for VA, VA/L and L and 1995=100 for TO)
Fig. 2 – Emission/L trends (1990=100)
[image:23.454.59.384.70.606.2]Fig. 4 – Outlier DF in STIRPAT estimations for NOx
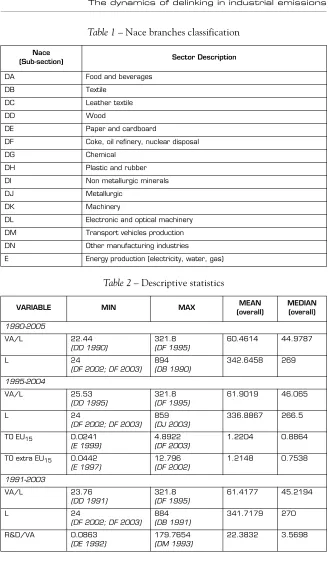
[image:24.454.80.388.70.499.2] [image:24.454.80.385.75.282.2]Table 1 – Nace branches classification
Table 2 – Descriptive statistics Nace
(Sub-section) Sector Description
DA Food and beverages
DB Textile
DC Leather textile
DD Wood
DE Paper and cardboard
DF Coke, oil refinery, nuclear disposal
DG Chemical
DH Plastic and rubber
DI Non metallurgic minerals
DJ Metallurgic
DK Machinery
DL Electronic and optical machinery
DM Transport vehicles production
DN Other manufacturing industries
E Energy production (electricity, water, gas)
VARIABLE MIN MAX MEAN
(overall) MEDIAN (overall) 1990-2005 VA/L 22.44 (DD 1990) 321.8 (DF 1995) 60.4614 44.9787 L 24
(DF 2002; DF 2003)
894 (DB 1990) 342.6458 269 1995-2004 VA/L 25.53 (DD 1995) 321.8 (DF 1995) 61.9019 46.065 L 24
(DF 2002; DF 2003)
859
(DJ 2003)
336.8867 266.5
TO EU15 0.0241
(E 1999)
4.8922
(DF 2003)
1.2204 0.8864
TO extra EU15 0.0442
(E 1997) 12.796 (DF 2002) 1.2148 0.7538 1991-2003 VA/L 23.76 (DD 1991) 321.8 (DF 1995) 61.4177 45.2194 L 24
(DF 2002; DF 2003)
Table 324 – Estimation results for CO 2
24. Notes (Tables 3 to 6): Coefficients are shown in cells: *10% significance, **5%, ***1%. For each column we present the best fitting specification (linear, quadratic, cubic) in terms of overall and coefficient significance. All specifications are estimated using FE model. Individual fixed effects coefficients are not shown for brevity. Below Kyoto coefficient, between brackets, average emissions in 1998-2005 given 1990-1997 average equal to 100% are shown. F test is the joint test of significance on all coefficients whereas F test fixed effect is the test of significance on indi-vidual fixed effects. TP both for VA/L (two for cubic and one for quadratic specifications) and L are shown: between brackets there is the percentile of each TP. Underlined TP are outside the range of the observations of VA/L or L
EKC Base
EKC R&D
STIRPAT Base
STIRPAT R&D
ln(VA/L) 1.2351*** 1.3142** 0.2747*** 0.28***
ln(VA/L)2 -0.0894* -0.0946*
ln(VA/L)3
ln(L) 0.4702*** 0.3581**
ln(L)2
ln(TOEU15)
ln(TOextraEU15)
ln(R&D/VA) 0.0314** 0.0331**
Kyoto 0.1059*** (111.17%)
0.0758*** (107.87%)
0.1068*** (111.27%)
0.0825*** (108.59%)
Constant 6.633*** 6.3653*** 11.9596*** 12.5232***
R2 (overall) 0.6517 0.5799 0.0093 0.0418
N*T 240 195 240 195
Period 1990-2005 1991-2003 1990-2005 1991-2003
Turning point(s) (VA/L)
995.9355 1035.681
Turning point (L)
Shape (VA/L) Inverted U shape Inverted U rela-tionship
The dynamics of delinking in industrial em issions Jo urna l of
Innovation Economics – 2009/
1 115 EKC Base EKC TOUE15 EKC TOextraUE15 EKC R&D STIRPAT Base STIRPAT TOextraUE15 STIRPAT R&D
ln(VA/L) -0.2353* -0.4356*** 17.5185*** 2.0343* 20.5051***
ln(VA/L)2 -4.1857*** -0.2136* -5.0256***
ln(VA/L)3 0.3198*** 0.3875***
ln(L) 1.7012*** 5.1037** 1.5873***
ln(L)2 -0.345*
ln(TOEU15) -0.1842*
ln(TOextraEU15) -0.1402*** -0.3675***
ln(R&D/VA) 0.0573** 0.0473*
Kyoto -0.281*** (75.5%) -0.1869*** (82.95%) -0.1402*** (86.92%) -0.2516*** (77.76%) -0.2369*** (78.91%) -0.1413*** (86.82%) -0.2003*** (81.85%)
Constant 4.9698*** 3.9319*** 3.7893*** 5.6613*** -23.4735*** -12.8072** -25.7964
R2 (overall) 0.2105 0.0962 0.0099 0.4508 0.0638 0.0104 0.1061
N*T 240 150 150 195 240 150 195
Period 1990-2005 1995-2004 1995-2004 1991-2003 1990-2005 1995-2004 1991-2003
Turning point(s) (VA/L) 32.5723*** (20) 188.9175*** (96) 116.9912** (87) 27.0493*** (6) 210.4844*** (96) Turning point (L) 1631.075
[image:27.454.55.623.71.386.2]A R IN, Ma s s imiliano M A ZZAN T I
Journal of Inno
vatio n Ec onomics – 20 0 9 /1
– n° 3
EKC Base EKC TOUE15 EKC TOextraUE15 EKC R&D STIRPAT Base STIRPAT TOUE15 STIRPAT TOextraUE15 STIRPAT R&D
ln(VA/L) -0.4132** -0.6327** -0.5669** -0.49** -24.5418** -53.5357*** -40.9568** -0.7507***
ln(VA/L)2 5.5087** 13.059*** 10.1738***
ln(VA/L)3 -0.4052** -1.0214*** -0.807***
ln(L) 1.267*** 1.5332*** 1.0075*
ln(L)2
ln(TOEU15) -0.9637*** -1.1893***
ln(TOextraEU15) -0.9358*** -1.0842***
ln(R&D/VA) -0.1139*** -0.1199***
Kyoto -1.0989*** (33.32%) -0.8174*** (44.16%) -0.7255*** (48.41%) -0.9505*** (38.66%) -1.0762*** (34.09%) -0.8569*** (42.45%) -0.7597*** (46.78%) -0.9647*** (38.11%)
Constant 5.6662*** 6.1581*** 5.6025*** 6.1292*** 38.3794*** 71.2995*** 56.0784** 12.7666***
R2 (overall) 0.005 0.0065 0.0167 0.0284 0.0164 0.1222 0.0662 0.0328
N*T 240 150 150 195 240 150 150 195
Period 1990-2005 1995-2004 1995-2004 1991-2003 1990-2005 1995-2004 1995-2004 1991-2003
Turning point(s) (VA/L) 51.5564*** (79) 167.4224*** (94) 30.8795*** (9) 162.9848*** (94) 28.2465*** (2) 158.1438*** (93) Turning point (L)
[image:28.454.62.626.81.355.2]The dynamics of delinking in industrial em issions Jo urna l of
Innovation Economics – 2009/
1 117 EKC Base EKC TOUE15 EKC TOextraUE15 EKC R&D STIRPAT Base STIRPAT TOUE15 STIRPAT TOextraUE15 STIRPAT R&D
ln(VA/L) 19.6917*** 23.0763*** 0.679*** 0.3187* 19.0652**
ln(VA/L)2 -4.5009*** -5.4313*** -4.4405**
ln(VA/L)3 0.3379*** 0.4138*** 0.339**
ln(L) 9.4668*** 9.6937*** 11.4679*** 5.7015***
ln(L)2 -0.6537*** -0.6788*** -0.8452*** -0.3604**
ln(TOEU15) -0.77*** -0.6694***
ln(TOextraEU15) -0.6756*** -0.521***
ln(R&D/VA) 0.0772*** 0.063**
Kyoto -0.3736*** (68.83%) -0.2269*** (79.7%) -0.1674*** (84.58%) -0.2688*** (76.43%) -0.3383*** (71.29%) -0.2153*** (80.63%) -0.1755*** (83.91%) -0.2624*** (76.92%)
Constant -26.3633*** 1.729*** 1.5335*** -30.0582*** -27.2291*** -25.2118*** -31.2168*** -39.8468***
R2 (overall) 0.0046 0.0957 0.0078 0.2382 0.014 0.0043 0.0108 0.0367
N*T 240 150 150 195 240 150 150 195
Period 1990-2005 1995-2004 1995-2004 1991-2003 1990-2005 1995-2004 1995-2004 1991-2003
Turning point(s) (VA/L) 49.6182*** (76) 144.7329*** (91) 37.784*** (29) 167.005*** (94) 44.8828*** (47) 138.017*** (91)
Turning point (L) 1396.108*** 1261.817* 884.0189*** 2721.959***
[image:29.454.67.617.69.353.2]