Visual Composition of Complex Queries on an Integrative
Genomic and Proteomic Data Warehouse
Francesco Pessina, Marco Masseroli, Arif Canakoglu Dipartimento di Elettronica e Informazione, Politecnico di Milano, Milan, Italy Email: [email protected], [email protected], [email protected]
Received December2012
ABSTRACT
Biomedical questions are usually complex and regard several different life science aspects. Numerous valuable and he- terogeneous data are increasingly available to answer such questions. Yet, they are dispersedly stored and difficult to be queried comprehensively. We created a Genomic and Proteomic Data Warehouse (GPDW) that integrates data provided by some of the main bioinformatics databases. It adopts a modular integrated data schema and several metadata to de- scribe the integrated data, their sources and their location in the GPDW. Here, we present the Web application that we developed to enable any user to easily compose queries, although complex, on all data integrated in the GPDW. It is publicly available at http://www.bioinformatics.dei.polimi.it/GPKB/. Through a visual interface, the user is only re- quired to select the types of data to be included in the query and the conditions on their values to be retrieved. Then, the Web application leverages the metadata and modular schema of the GPDW to automatically compose an efficient SQL query, run it on the GPDW and show the extracted requested data, enriched with links to external data sources. Per- formed tests demonstrated efficiency and usability of the developed Web application, and showed its and GPDW re- levance in supporting answering biomedical questions, also difficult.
Keywords: SQL Query Composition; Visual Interface; Integrated Data Extraction; Data Warehousing; Bioinformatics Database
1. Introduction
A great amount of valuable and heterogeneous biomedi- cal molecular data and information is increasingly pro- duced thanks to the modern high-throughput technolo- gies. It is stored in publicly accessible molecular biology databases that are continuously increasing in number and coverage of the included biomolecular entities, as well as of their described structural and functional biomedical features and associated phenotypes [1]. Such databases provide extremely valuable information to infer new knowledge and potentially answer biomedical questions, which are generally complex. To obtain enough evidence to support such answers, several different structural, functional and phenotypic annotations must be collected and comprehensively evaluated. Yet, even the informa- tion about a single biomolecular entity is often scattered across many different sources.
Several approaches have been proposed to integrate data from multiple heterogeneous data sources and query them comprehensively. Data warehousing well supports off-line processing to mine the integrated data towards knowledge discovery. Yet, the global schemas for bio- logical data warehousing that have been proposed are
quite complex [2-5]. Although they can support a com- plete representation of the underlying biological aspects described by the integrated data, they make it difficult to face the integration challenges of evolving data. Difficul- ties arise in both maintaining updated the data warehouse that adopts one of such data schemas and in expanding it with other data and data types from new sources.
2. Genomic and Proteomic Data Warehouse
2.1. Integrative Data Schema
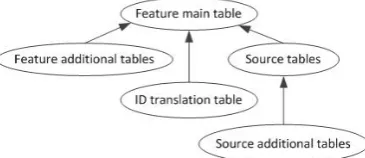
To integrate heterogeneous data available from many different sources, abstraction and generalization of con- cepts to be integrated are paramount. As well, modularity and customizability of global data schema are vital to support easy integration, data schema extension with the inclusion of new data types and sources, and mainten- ance with respect to data, format and schema evolution of the integrated original data sources. With such aims and with the goal of creating the GPDW, as illustrated in [6], we focused on biomedical molecular entities and features described by data to be integrated, provided by distinct sources. Briefly, we abstracted and generalized such features and defined our integrated relational data schema as composed of multiple interconnected modules. Each module represents a single feature, whose data are provided by one or more of the integrated data sources, and it is composed by a number of data tables that de- pends on the integrated data. Such tables are hierarchi- cally related as shown in the Directed Acyclic Graph (DAG) in Figure 1.
Feature modules can be pair wise associated; such as- sociations represent the valuable association/annotation data provided by the integrated data sources, which are stored in hierarchically related association tables (Figure 2).
[image:2.595.81.264.503.582.2]The feature modules and their associations contained in a specific instance/version of our generalized global data schema depend on the particular data sources and their provided data that are integrated in that specific data schema instance. To support the automatic construction
Figure 1. Directed acyclic graph of the tables in a GPDW feature module.
Figure 2. DAG of the association tables between two GPKB feature modules.
and updating of a database adopting such data schema, we defined a procedure to register the data sources and their feature data to be integrated, and to collect all the required metadata information about them and their as- sociations. We store these metadata in a specific metada- ta schema, useful to seamlessly and transparently access all data in the database regardless the specific database version.
2.2. Data Integrated in the GPDW
The GPDW adopts our defined modular data schema to integrate data provided by several of the main bioinfor- matics databases, including Entrez Gene, Homologene, MINT, IntAct, Expasy Enzyme, GO, GOA, BioCyc, KEGG, Reactome, eVOC and OMIM. Currently, data in the GPDW regard several features, including DNA se- quences, genes, transcripts, proteins, enzymes, protein domains, small molecules of biological interest, biologi- cal function features (i.e. Gene Ontology biological processes, molecular functions and cellular components), pathways, gene expression features, genetic disorders, clinical synopses and their association.
Among others, at time of writing the GPDW contains 9,537,645 genes of 9,631 organisms, 38,960,202 proteins of 338,004 species, 19,522 protein domains and 824,797 protein domains annotations, 28,889 biochemical path- ways and 171,372 pathway annotations (77,812 gene and 93,560 protein annotations), 35,252 Gene Ontology terms and 64,185,070 Gene Ontology annotations (1,272,168 gene and 62,912,902 protein annotations), 10,212 human genetic disorders and their 27,705 gene annotations. These figures demonstrate the valuable unique characte- ristics of the GPDW.
3. Dynamic Composition and Result
Visualization of GPDW Data Extraction
SQL Queries
To enable any user to easily compose queries, although complex, on all data integrated in the GPDW, we devel- oped a Web application in Java programming language using Servlets and Java Server Pages (JSP) technology. It is publicly available at
http://www.bioinformatics.dei.polimi.it/GPKB/. Through a visual interface (Figure 3), the user is only required to select, out of the features integrated in the GPDW, the ones and their attributes to be included in the query, to- gether with the conditions on the data values to be re- trieved. All information about the GPDW content re- quired to build the visual interface is taken from the GPDW metadata. Thus, transparently to the user, the visualized features and their attributes automatically adapt to the content of the specific GPDW instance.
[image:2.595.58.287.626.707.2]Figure 3. User interface for visual composition of a query on a single feature.
each feature attribute, enable the user to define filtering conditions on the data values to be retrieved. The content of each of these menus depends on the data contained in the particular attribute to which the menu refers. Fur- thermore, the user can also select some general options (Search Options) for the query, e.g. make a “distinct” SQL query, set the conjunctive logical clause to use for the defined filtering conditions (AND/OR), select the result counting mode and define how many results per page to show.
3.1. Query Composition Algorithm
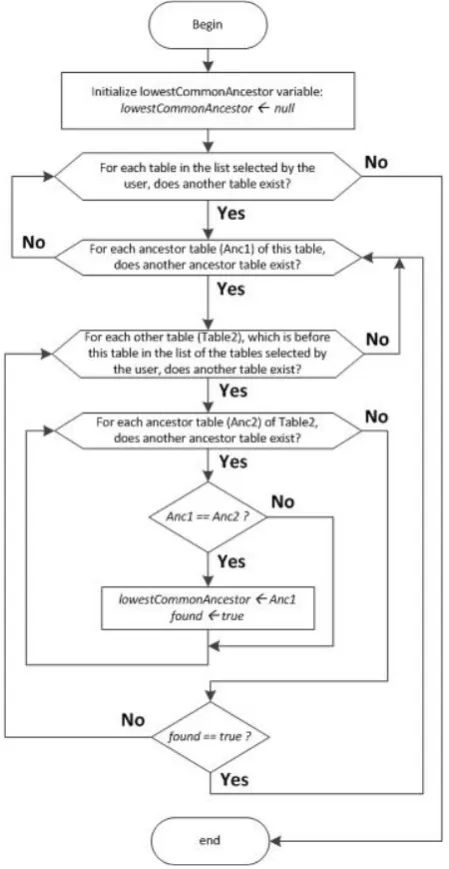
We designed a specific algorithm to automatically com- pose a SQL query that can efficiently extract data from any instance of the GPDW, according to any combina- tion of user selected feature attributes and filters. The core of the query composition algorithm leverages the metadata and modular structure of the GPDW. It is di- vided in two steps: 1) generation of a complete and or- dered list of tables to be included in the query and 2) generation of the query FROM, JOIN and WHERE clauses.
[image:3.595.312.537.86.521.2]The first step starts with the identification of the lowest common ancestor (LCA) between all the tables that con- tain the attributes selected by the user to be included in the query. This is performed as shown in Figure 4, ac- cording to the DAG structure in Figures 1 and 2. Through a recursive function, all the ancestors of each table are calculated and the LCA table between all of them is found. It completes the list of all tables involved in the query, which also includes the tables that contain the attributes selected by the user. Then, the tables in the list are ordered based on the feature module, or feature association they belong to and the order in which the user selected the features to query. If the user selected first the feature A and then the feature B, the feature A tables will be at the top of the list, then the association tables be-
Figure 4. Flowchart of the lowest common ancestor search over the list of all ancestor tables of each GPDW table con- taining user selected attributes.
tween feature A and feature B, and finally the feature B tables. In the list, the order of tables belonging to each feature module or association is then defined from top to bottom by the order of tables in the DAG of the feature module (Figure 1) or of the association (Figure 2).
into the query. If it is an association table, the two joins between this association table and each of the two feature tables (if present in the list) that it associates are added into the query. If the table is neither a feature nor an as- sociation table, the join between this table and the last reference table found is added into the query. Finally, all filters defined by the user are added to the WHERE clause of the query.
3.2. Query Result Visualization
The data extracted by the composed query are processed to be neatly visualized to the user. Furthermore, ID data are enriched with hyperlinks to external resources with more detailed information over the entity identified by the ID. Each of these hyperlinks is composed of the ID itself and a base URL stored in the GPDW metadata.
Counting of the extracted data is also provided. Since the counting query is generally much slower than the main data extraction query, initially an approximate count is shown to the user. It is obtained by the SQL EXPLAIN command, quickly executed over the main query, while the real counting query is executed in back- ground. When this query ends, in the user interface the approximate count is refreshed with the exact one.
4. System Performance
Performance of the created Web application was tested while running on a TomCat 6.0 Web Server installed on a computer with two Intel XEON CPU E5320 1.86 GHz, 32 GB RAM, and connected to the described GPDW instance implemented in a PostgreSQL DBMS. Genera- tion of the visual user interface for query composition, execution of the composed queries and query result visu- alization processing were evaluated.
4.1. Visual User Interface for Query Composition
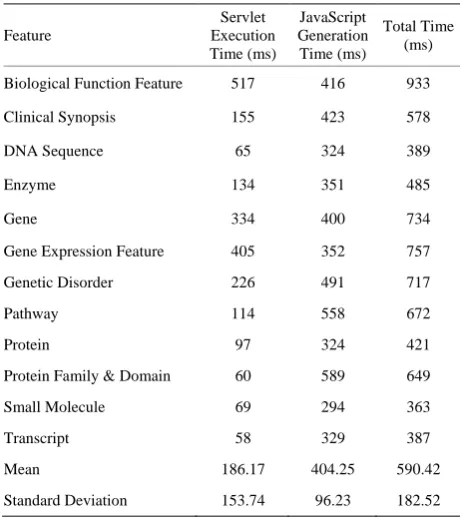
[image:4.595.307.539.110.369.2]The loading times of the visual interface for query com- position on a single feature are shown in Table 1. The “Servlet Execution Times” are those of a servlet created to retrieve from the GPDW metadata schema all the table names of the feature selected by the user and to create a Web page where showing them. The “JavaScript Execu- tion Times” refer to the tasks performed by some created AJAX calls to the server or client-side JavaScript rou- tines. This JavaScript processing shows the table field names in the user interface and populates their interactive menus for the definition of the query filtering conditions. In the default visualization, only the fields of the feature main table (and association table(s) in case of a search on more features) are immediately shown. The other table fields can be interactively opened by the user. This pena-
Table 1. Loading times of the visual user interface for single feature query composition.
Feature
Servlet Execution Time (ms)
JavaScript Generation Time (ms)
Total Time (ms)
Biological Function Feature 517 416 933
Clinical Synopsis 155 423 578
DNA Sequence 65 324 389
Enzyme 134 351 485
Gene 334 400 734
Gene Expression Feature 405 352 757
Genetic Disorder 226 491 717
Pathway 114 558 672
Protein 97 324 421
Protein Family & Domain 60 589 649
Small Molecule 69 294 363
Transcript 58 329 387
Mean 186.17 404.25 590.42
Standard Deviation 153.74 96.23 182.52
lizes slightly the total loading time of the query composi- tion Web page for a single feature with few tables. Yet, it makes the total loading time of the query composition Web page much lower in the case of more features, which involves many tables. The total loading times are always lower than 1 second, which represents an imme- diate response to the user according to [7], and show a very good performance.
4.2. Query Execution Performance
4.3. Result Processing and Visualization
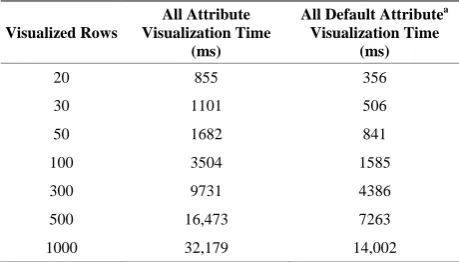
Processing times to visualize enriched the results re- turned by a query on the “transcript” feature, which se- lects all, or only the default, feature attributes, are re- ported in Table 2. As expected, the processing time is proportional to the number of attributes requested and result rows visualized. For all attributes, until 300 rows, the processing time stays under 10 seconds, which is an acceptable loading time according to [7] if a feedback to the user is shown (as it is). For more rows the time is greater, but still under a minute. In any case, the benefit of an enriched visualization of result data is much more worthy than the time the user has to wait to see the re- sults.
5. Usability Testing
[image:5.595.57.287.483.614.2]Usability of the created Web application was tested by 9 users with 3 different profiles: 4 computer scientists who knew the GPDW, 4 computer scientists who did not know before the GPDW and 1 biologist. All users were observed while doing some significant tasks over the Web application and were interviewed about their user experience. In the evaluation, for each task, the metrics used were the success rate, the time, the number of un- do/errors and the time perceived by each user. All users completed all tasks, some with assistance (success rate 80%). This is a strong indication that the Web applica- tion does not present any critical issue. The number of undo/errors was very low (in few tasks the users did
Table 2. Visualization processing time of data extracted with a query on the “transcript” feature.
Visualized Rows
All Attribute Visualization Time
(ms)
All Default Attributea
Visualization Time (ms)
20 855 356
30 1101 506
50 1682 841
100 3504 1585
300 9731 4386
500 16,473 7263
1000 32,179 14,002
aDefault attributes for Transcript feature are source_id, source_name, sym-
bol and taxonomy_id.
more than 1 undo/error). The perceived time, evaluated from 1 to 5, got a mean of 3, demonstrating the intui- tiveness of the interface despite of the complexity of some tasks. Overall, all users showed satisfaction for their user experience. Observing them to perform the tasks pointed out some little usability issues, mainly about navigation of query composition Web pages and results visualization that will be tackled in future work.
REFERENCES
[1] M. Y. Galperin and X. M. Fernández-Suárez, “The 2012 Nucleic Acids Research Database Issue and the Online Molecular Biology Database Collection,” Nucleic Acids Research, Vol. 40, Database Issue, 2012, pp. D1-D8.
[2] N. W. Paton, S. A. Khan, A. Hayes, F. Moussouni, A. Brass, K. Eilbeck, C. A. Goble, S. J. Hubbard and S. G. Oliver, “Conceptual Modeling of Genomic Information,”
Bioinformatics, Vol. 16, No. 6, 2000, pp. 548-557.
[3] E. Bornberg-Bauer and N. W. Paton, “Conceptual Data Modelling for Bioinformatics,” Briefings in Bioinformat- ics, Vol. 3, No. 2, 2002, pp. 166-180.
[4] M. Masseroli, D. Martucci and F. Pinciroli, “GFINDer: Genome Function INtegrated Discoverer through Dyna- mic Annotation, Statistical Analysis, and Mining,” Nu- cleic Acids Research, Vol. 32, 2004, pp. W293-W300.
[5] M. Masseroli, O. Galati and F. Pinciroli, “GFINDer: Ge- netic Disease and Phenotype Location Statistical Analysis and Mining of Dynamically Annotated Gene Lists,” Nu- cleic Acids Research, Vol. 33, 2005, pp. W717-W723.
[6] A. Canakoglu, G. Ghisalberti and M. Masseroli “Integra- tion of Biomolecular Interaction Data in a Genomic and Proteomic Data Warehouse to Support Biomedical Know- ledge Discovery,” In: E. Biganzoli, A. Vellido, F. Am- brogi and R. Tagliaferri, Eds., Computational Intelligence Methods for Bioinformatics and Biostatistics, Springer, Heidelberg, 2012, pp. 112-126.
![Welcome to the Naval Postgraduate School Centennial Kick-Off, and for alumni and friends of NPS, the first-ever Alumni Reunion Weekend! [program]](data:image/gif;base64,R0lGODlhAQABAIAAAP///wAAACH5BAEAAAAALAAAAAABAAEAAAICRAEAOw==)