Munich Personal RePEc Archive
Regional Liberalization of Trade in
Services
Park, Innwon and Park, Soonchan
Korea University
4 January 2010
1
Regional Liberalization of Trade in Services∗
Innwon Park∗∗ and Soonchan Park∗∗∗
January 2010
Abstract
As the impact of trade in services on the current global financial crisis appears to overtake that of trade in goods, we propose to examine liberalization of trade in services through regional trade agreements (RTAs). The regional liberalization of trade in services is expected to generate significant welfare gains both in the services and goods sectors. However, the quantitative effect of RTAs under GATS (General Agreement on Trade in Services) Article V has not been sufficiently investigated. We attempt to fill this gap by applying a gravity regression analysis to four major services sectors—financial services, business services, communication services, and transportation services—while controlling for both country-specific and time-varying importer and exporter fixed effects. We find that (i) the RTAs under GATS Article V create services trade among members and do not divert services trade from nonmembers, but the enhancing effect is sector-specific; (ii) the sector-specific trade-enhancing effect ranges from the highest in business services sector to the lowest in transportation services; (iii) the trade effect on aggregate services trade is weaker when we control for the time-varying multilateral trade resistance factor with the time-varying exporter and importer fixed effect, however, the sectoral effects show a reverse pattern; (iv) there is no anticipatory effect expected from services RTA negotiations, unlike the case of trade in goods; (v) there is a complementary relationship between goods and services imports; and (vi) the trade-enhancing effect of RTAs is stronger between developed members compared to the effect between developed and developing countries.
Keywords: trade in services, regional trade agreements, gravity, GATS
JEL Classification: C23, F13, F15
∗ Preliminary draft. Please do not quote without permission. ∗∗
Corresponding author: Professor, Division of International Studies, Korea University, 5-1 Anam-Dong, Sungbuk-Gu, Seoul 136-701, Korea; Telephone: 3290-2406; Fax: 82-2-929-0402; Email: iwpark@korea.ac.kr.
∗∗∗ Associate Professor, Department of Economics and International Trade, Kongju National
2
I. INTRODUCTION
Trade in services has been expanding rapidly as a result of innovations in telecommunication
and information technology, deregulations in public sectors, liberalization of capital flows,
and facilitation of services trade through proliferating free trade agreements (FTAs). The
volume of world trade in services increased 10 times from 387 billion US$ in 1980 to 3,730
billion US$ in 2008. The growth rate of trade in services (8.5 percent per year on average)
exceeded that of trade in goods (7.6 percent) for the last three decades (from 1981 to 2007).
The proportion of services trade, however, shows sluggish increase from 16.0% in 1980 to
18.8% in 2008.1
As the importance of trade in services increases, liberalization of the sector has received more
attention from international trade negotiations since the Uruguay Round in 1986. The
liberalization of trade in services has been adopted as a major issue in the Doha Development
Agenda (DDA) negotiations of the World Trade Organization (WTO).2 However, services
liberalization at the multilateral level has seen limited progress. In contrast, services
liberalization at the regional level has seen rapid progress through regional trade agreements
(RTAs), which go well beyond the achievements at the multilateral level.3 Of the 240 RTAs
notified to the WTO and in force as of December 2008, 58 cover trade in services under the
General Agreement on Trade in Services (GATS) Article V.4 Of that number, 51 RTAs (88
percent) were ratified between 2001 and 2008.
Trade in services is expected to contribute significantly to economic growth mainly through
enhanced productivity as services are basic inputs or intermediates for industrial production.5
RTAs in general have proven to be a welfare enhancing tool of commercial policy by creating
1
Data from UNCTAD.
2
For the service trade liberalization in the context of the DDA, see Fung and Siu (2008) and Gootiiz and Mattoo (2009).
3
For an informative benefit-cost analysis about the preferential trade agreements compared to the multilateral approach like GATS, see Roy, Marchetti, and Lim (2006). Stephenson (2002), Mattoo and Fink (2002), and Park (2002) argue that the regional liberalization of services is more efficient than multilateral liberalization.
4
In this paper, we define the RTAs notified under GATS Article V as “services RTAs.”
5
For a general introduction to services trade, see Copeland and Mattoo (2004). For the growth effect of trade in services, see Hoekman and Mattoo (2008). For the impact of services trade liberalization on developing countries and an informative survey on the issue, see
3
rowing
e and
ine the
more trade in services.6 However, the benefits of RTAs might be at risk in the face of g
demands for protectionist measures induced by the current global economic turbulenc
the increasing impact of trade in services on the crisis.7 This research proposes to exam
liberalizing effect of RTAs on trade in services.
So far, the quantitative effect of RTAs under the WTO’s GATS provision on trade in services
has not been extensively investigated. The existing studies investigate the trade effect of RTAs
without distinguishing the RTAs according to the legal provisions applied, such as GATS
Article V.8 We attempt to fill this gap by applying a gravity regression analysis to four major
services sectors9—financial services, business services, communication services, and
transportation services—controlling for both country-specific and time-varying importer and
exporter fixed effects. In addition, we compare trade effects of RTAs between North-North
and North-South countries under GATS Article V. We also examine whether there is a
complementary relationship between goods and services imports.10
The paper is organized as follows. Section II specifies data, gravity equations, and relevant
estimation techniques. Section III summarizes the empirical findings to support our argument
for regional liberalization of trade in services. Section IV summarizes our empirical findings.
II. TRADE EFFECTS OF SERVICES RTAs: A GRAVITY REGRESSION ANALYSIS
1. Model Specifications, Estimation Techniques, and Data
6
See Konan and Maskus (2006).
7
See Borchert and Mattoo (2009).
8
For the empirical evidence of services trade liberalization by using computable general equilibrium (CGE) model analysis, see Konan and Maskus (2006) for the Tunisian economy; Francois, Pindyuk, and Wörz (2008) for the European Union; Fritz and Streicher (2008) for Austria; and Chisari, Maquieyra, and Romero (2009) for South America. For empirical evidence using gravity regression analysis, see Park (2002), Kimura and Lee (2006), and Walsh (2006).
9
Travel services, construction services, insurance services, personal, cultural, and
recreational services, and government services are not separated from the aggregate services. Computer and information services, royalties and license fees, and other business services are included in business services.
10
We employ a standard gravity model of bilateral trade flows to estimate the trade effects of
RTAs.
[Equation 1]
1 2 3 1 2
ln ijt ij ln it ln jt ln ij ijt ijt ijt
t ijt
M GDP GDP Dist X SVRTA SVRTAout
Year
α β β β μ γ γ
δ ε
= + + + + + +
+ +
where i and j denote particular countries, and t denotes time,
z Mijtdenotes real imports in services from i to jat time t,
z GDPis real gross domestic product,
z Dist is the distance between i and j,
z Xis a set of control variables that includes border, common language, colony, and
landlocked dummy,
z SVRTA is a binary variable that is unity if i and j belong to the same RTA under
GATS Article V,
z SVRTA Out_ is a binary variable that is unity if ibelongs to an RTA and j does not,
or vice versa,
z Yeardenotes a set of binary variables that is unity in the specific year t .
Including the country-pair fixed effect (αij) in Equation (1) has the advantage of controlling
any factors that are specific to the country pair, such as distance, border, common language
and unobserved ties. However, this fixed effect does not capture the impact of factors that
vary over time. When we use a panel data set, the multilateral trade resistance factor of
Anderson and van Wincoop (2003) would vary over time. If there are time specific shocks
that affect the bilateral trade flows, the country-pair fixed effect could suffer from an omitted
variable bias, and consequently the estimates would be biased. Recent studies11 suggest that
this problem can be dealt with using time-varying exporter and importer fixed effects (αit and
αjt in the following Equation 2). Equation (1) thus becomes:
[Equation 2]
11
See Baldwin and Taglioni, 1996; Baier and Bergstrand, 2007; Magee, 2008
1 2
lnMijt =αij+αit+αjt +γ SVRTAijt+γ SVRTAoutijt+δYeart +εijt
Most previous studies estimate the trade effects of RTAs by using Equations (1) and (2).
However, as Magee (2008) points out, these estimations make an implicit assumption that the
impact of RTAs on trade does not vary over time and remains constant after the first year that
the RTA is in force. It would be more realistic if the trade effects of RTAs vary over time. To
reflect the dynamic effects of RTAs on trade and thus estimate the cumulative effects of RTAs
on trade, Equation (2) is modified as follows:
[Equation 3]
1, ( ) 2, ( )
0
ln ( )
k
ijt ij it jt s ij t s s ij t s t ijt s
M α α α γ SVRTA − γ SVRTAout − δYear ε
=
= + + +
∑
+ + +0
s= is the first year of the RTA.
The trade flows data for this study are drawn mainly from United Nations Service Trade
Statistics Database, which provides bilateral trade in services beginning in 2000. The
dependent variable in this paper is bilateral imports for trade flows from 2000 to 2005. These
data are deflated by importer GDP deflators to generate real imports. The list of the services
RTAs is obtained from the WTO. The data for real GDP at purchasing power parity (PPP) are
from the World Bank’s World Development Indicators. Data on country-pair specific variables,
such as distance, colonial ties, common land border, and common languages, are obtained
from the Central Intelligence Agency’s World Factbook. The following 19 bilateral RTAs
notified under GATS Article V are included in this research: Anzcerta (Australia New Zealand
Closer Economic Agreement), Canada-Chile, EC (European Community) 15, EC 25,
EC-Chile, EC-Mexico, EFTA (European Free Trade Association), EFTA-Singapore, EEA
(European Economic Area), India-Singapore, Japan-Mexico, Japan-Singapore, New
Zealand-Singapore, NAFTA (North American Free Trade Agreement), Singapore-Australia,
Thailand-Australia, US-Thailand-Australia, US-Chile, US-Singapore.12
2. Summary Statistics
12
WTO regards all of the EC enlargements—EC 9, EC 10, EC 12, EC 15 and EC 25—as separate RTAs. In this paper we include only EC 15 and EC 25 in our count of RTAs.
6
The gravity regression analysis in this study uses annual data consisting of 20,986 country
pairs in total. The number of observations varies per year. Summary statistics for the data used
in the estimations are presented in Table 1. Out of all observations, 2,271 country pairs (10.8
percent) belong to services RTAs (“insiders”), and 17,267 country pairs (82.3 percent) belong
to the member-nonmember (“outsiders”) relationship. The majority, 52.4 percent, of the 2,271
country pairs are services RTAs between developed countries, while 44.2 percent are RTAs
between developed and developing countries.13
In Table 1, we observe some notable findings. First, the bilateral aggregate services trade
between RTA members is more than twice as high as the average bilateral services trade in the
whole sample, and the trade creating effect of services RTAs is much stronger between
developed members. The bilateral services trade between members and nonmembers is also
higher than the average volume of the bilateral services trade in the whole sample. These
observations are valid for all four services sectors examined.
Second, the bilateral trade linkage through trade in services (2.1=5.02/2.42) between members
of services RTAs is stronger than the linkage through trade in goods (1.5=6.21/4.17), although
the absolute volume of services trade is smaller than that of goods trade.
From the previous observations, we may expect that services RTAs, especially RTAs between
developed countries, create more trade among members without diverting trade from
nonmembers. However, this is a casual observation because other important variables, such as
year and country size, are not controlled. In addition, self-selection may have played an
important role in generating a large services trade volume between RTA members because
countries that trade services more than goods are more likely to form services RTAs in the
first place.
Third, there is no significant difference in economic size for the membership of RTAs, but
13
7
geographical distance matters. Fourth, RTA membership seems to have been chosen after
taking account of specific, possibly exogenous, country characteristics. RTA member
countries are more likely to share a common land border and common language, but not
necessarily a common history. Whether the countries are landlocked does not appear to matter.
III. TRADE EFFECTS OF SERVICES RTAs: EMPIRICAL RESULTS
1. Trade Effects of Services RTAs in General
Columns (1) and (2) in Table 2 present the results of the impact of services RTAs on intra- and
extra-bloc membership as a whole. As we interpret the random effects in column (1), the
conventional variables behave the way the model predicts and the estimated coefficients are
statistically significant. To summarize, the estimated coefficients on log of both importer’s
and exporter’s GDP are significantly positive. The estimated coefficients on bilateral distance
and landlocked dummy are significantly negative. The adjacency, common language dummy,
and colony dummy are all significantly positive. This indicates that the market size,
transaction costs, and historical background matter for increasing bilateral trade in services.
From column (2) of the country-pair fixed effect estimation covering aggregate services trade,
estimated coefficient on the RTA membership dummy variable is positive and statistically
significant. The estimate on the intra-bloc membership implies that a pair of countries that
joins a service RTA experiences a 20.8 percent increase in imported services, with other
variables constant.14 The estimate on the extra-bloc dummy variable is also positive and
statistically significant. The estimate implies that RTA members’ trade with nonmembers is
estimated to rise by 12.6 percent. Hence, services RTAs as a whole increase trade among
members and do not divert trade from other countries that do not belong to the bloc.
The strong trade-enhancing effects of services RTAs are sector-specific as reported in
columns (3) through (6) in Table 2. The sector-specific effect ranges from the highest in
business services to the lowest in goods-related transportation services. In particular, the
14
8
current crisis-related financial services create significantly more imports from members, a
64.9 percent increase, without diverting imports from nonmembers.
The trade effects on aggregate services trade are weaker when we estimate the trade effects of
services RTAs to control a varying multilateral trade resistance factor with a
time-varying exporter and importer fixed effect in the gravity model specification 2 (Equation 2) as
shown in Table 3. In contrast, the sectoral effects show a reverse pattern, except for the
insignificant trade effects expected from the transportation services.
2. Additional Concerns in Services RTAs
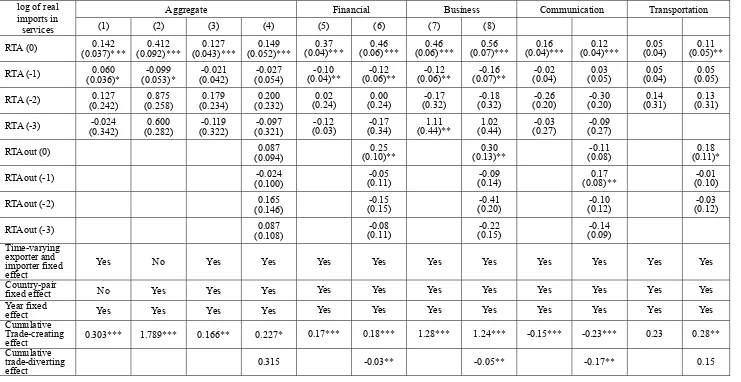
Anticipatory Effect: In order to examine whether there exists an anticipatory effect of services RTAs on trade, we estimate the cumulative effects of RTAs on trade using Equation (3). Table
4 summarizes the estimates. We limited our lags to three years because of the limitations of
our data set covering only six years, from 2000 to 2005. Most of the coefficients of lagged
RTA membership and nonmembership dummies are not statistically significant and have
unexpected signs. This means that there is no anticipatory effect expected from services RTA
negotiations, unlike the case of goods trade examined in Magee (2008).
Complementary Relationship between Trade in Goods and Trade in Services: Table 5 indicates that goods and services trade are complementary and that goods imports have a
much stronger trade effect on services imports. A 10 percent increase in imported goods raises
imported services by 1.6 percent with various specifications. Reciprocally, imported services
generate imported goods by 0.6 percent with various specifications.15 The estimated
coefficients of RTA membership and nonmembership in column (2) of Table 2 (0.189 and
0.119) are not significantly affected by the inclusion of goods imports when we compare
column (3) of Table 5 (0.183 and 0.116, respectively) with Table 2. The estimated elasticities
in columns (4) and (8) fall as we control the time-varying multilateral resistance.
15
9
Partnership Issues of Services RTAs: The trade-enhancing effect is stronger between developed members compared to the effect between developed and developing countries.
According to Table 2, the services RTAs between developed countries increase bilateral trade
in services by 22.4 percent between members, compared to a 20.8 percent increase for RTAs
as a whole; the RTAs between developed countries and developing countries increase the
bilateral services trade only by 7.7 percent. This means that services RTAs are strongly
recommended for developed countries to enhance their welfare.
IV. CONCLUDING REMARKS
Empirical evidence shows that the impact of the current global financial crisis on trade in
services is more stable than that of trade in goods. A number of studies argue that RTAs in
general have proven to be a welfare-enhancing tool of commercial policy by creating more
trade in services. Thus, we support liberalizing trade in services through RTAs, especially
services RTAs under GATS Article V, to revitalize the world economy.
In order to demonstrate that regional liberalization of trade in services is a suitable policy
option for the world economy to recover from the recent crisis, we apply a gravity regression
analysis to four major services sectors—financial services, business services, communication
services, and transportation services—while controlling for both country-specific and
time-varying importer and exporter fixed effects.
From the gravity regression analysis, we find that (i) the RTAs under GATS Article V create
services trade among members and do not divert services trade from nonmembers, but the
trade-enhancing effect is sector specific; (ii) the sector-specific trade-enhancing effect ranges
from the highest in business services sector to the lowest in transportation services; (iii) the
trade effect on aggregate services trade is weaker when we control for the time-varying
multilateral trade resistance factor with the time-varying exporter and importer fixed effect,
however, the sectoral effects show a reverse pattern; (iv) there is no anticipatory effect
expected from services RTA negotiations, unlike the case of trade in goods; (v) there is a
10
effect is stronger between developed members compared to the effect between developed and
11
REFERENCES
Anderson, James E., and Eric van Wincoop. 2003. “Gravity with Gravitas: A Solution to the
Border Puzzle.” American Economic Review 93: 170–192.
Baldwin, Richard, and Daria Taglioni. 2006. “Gravity for Dummies and Dummies for Gravity
Equations.” NBER Working Paper No. 12516. National Bureau of Economic
Research, Cambridge, MA, USA.
Baier, Scott L., and Jeffrey H. Bergstrand. 2007. “Do Free Trade Agreements Actually
Increase Members’ International Trade?” Journal of International Economics 71:
72-95.
Blyde, Juan, and Natalia Sinyavskaya. 2007. “The Impact of Liberalizing Trade in Services
on Trade in Goods: An Empirical Investigation.” Review of Development Economics
11(3): 566-583.
Borchert, Ingo, and Aaditya Mattoo. 2009. “The Crisis-Resilience of Services Trade.” Policy
Research Working Paper 4917. Washington, DC: The World Bank.
Central Intelligence Agency (CIA), World Factbook, Washington DC, USA.
Chisari, Omar O., Javier Maquieyra, and Carlos A. Romero. 2009. “Liberalization of Trade in
Services: A CGE Analysis for Argentina, Brazil and Uruguay.” MPRA Paper No.
15336, Munich: Munich Personal RePEc Archive.
Copeland, Brian, and Aaditya Mattoo. 2004. “The Basic Economics of Services Trade.”
Mimeo.
Francois, J., O. Pindyuk, and J. Wörz. 2008. “Trade Effects of Services Trade Liberalization
in the EU.” FIW Research Report No 004. Forschungsschwerpunkt Internationale
Wirtschaft, Vienna, Austria.
Fritz, O., and G. Streicher. 2008. “Trade Effects of Service Liberalization in the
EU-Simulation of Regional Macroeconomic Effects for Austria.” FIW Research Report
No 005. Forschungsschwerpunkt Internationale Wirtschaft, Vienna, Austria.
Fung, K. C., and Alan Siu. 2008. “Political Economy of Service Trade Liberalization and the
Doha Round.” Pacific Economic Review 13(1): 124-133.
Gootiiz, Batshur, and Aaditya Mattoo. 2009. “Services in Doha: What’s on the Table?” Policy
Research Working Paper 4903. Washington, DC: The World Bank.
Hoekman, Bernard, and Aaditya Mattoo. 2008. “Services Trade and Growth.” Policy
12
68
Kimura, Fukunari, and Hyun-Hoon Lee. 2006. “The Gravity Equation in International Trade
in Services,”Review of World Economics 142(1): 92-121.
Konan, Denis Eby, and Keith E. Maskus. 2006. “Quantifying the Impact of Services
Liberalization in a Developing Country.” Journal of Development Economics 81:
142-162.
Lennon, Carolina. 2006. “Trade in Services and Trade in Goods: Differences and
Complementarities.” Working Paper No. 2008-52. Paris: Paris-Jourdan Sciences
Economiques.
Magee, Christopher S. 2008. “New Measures of Trade Creation and Trade Diversion.”
Journal of International Economics 75: 340-362.
Mattoo, Aaditya, and Carsten Fink. 2002. “Regional Agreements and Trade in Services:
Policy Issues.” Policy Research Working Paper 2852. Washington, DC: The World
Bank.
Park, Soonchan. 2002. “Measuring Tariff Equivalents in Cross-Border Trade in Services.”
KIEP Working Paper 02-15. Seoul: Korea Institute for International Economic Policy.
Roy, Martin, Juan Marchetti, and Hoe Lim. 2006. “Services Liberalization in the New
Generation of Preferential Trade Agreements (PTAs): How Much Further than the
GATS?” Staff Working Paper ERSD-2006-07. Geneva: World Trade Organization.
Stephenson, Sherry M. 2002. “Regional versus Multilateral Liberalization of Services,” World
Trade Review 1(2): 187-209.
The World Bank, World Development Indicators, Washington DC, USA.
United Nations (UN), United Nations Service Trade Statistics Database. New York, USA.
United Nations Conference on Trade and Development
(UNCTAD), http://www.unctad.org/Templates/StartPage.asp?intItemID=20 ,
zerland. Geneva, Swit
Walsh, Keith. 2006. “Trade in Services: Does Gravity Hold? A Gravity Model Approach to
Estimating Barriers to Services Trade.” IIIS Discussion Paper No. 183. Dublin:
Institute for International Integration Studies (IIIS).
Whalley, John. 2004. “Assessing the Benefits to Developing Countries of Liberalisation in
Table 1. Summary Statistics
All (N=20,986)
RTA/insiders (N=2,271)
RTA/outsiders (N=17,267) RTA/North-North
insiders (N=1,191)
RTA/North- South insiders
(N=1,004)
log of imports in aggregate services 2.42 (3.39) 5.02 (2.46) 6.24 (1.90) 3.93 (2.06) 2.93 (3.11)
log of imports in financial services 0.38 (1.07) 1.01 (1.78) 1.64 (2.12) 0.34 (0.90) 0.43 (1.15)
log of imports in business services 1.12 (1.90) 2.23 (2.64) 3.36 (2.79) 1.02 (1.80) 1.27 (1.99)
log of imports in communication services 0.36 (0.94) 0.92 (1.53) 1.50 (1.79) 0.30 (0.78) 0.40 (0.99)
log of imports in transportation services 1.58 (2.13) 3.52 (2.24) 4.51 (2.06) 2.58 (1.89) 1.76 (2.21)
log of imports in goods 4.17 (2.71) 6.21 (2.41) 7.14 (2.16) 5.34 (2.19) 4.44 (2.69)
log of GDP(importer) 12.06 (1.74) 12.34 (1.50) 12.55 (1.43) 12.11 (1.56) 12.16 (1.76)
log of GDP(exporter) 12.11 (1.73) 12.34 (1.51) 12.52 (1.40) 12.16 (1.60) 12.21 (1.76)
log of distance 7.84 (0.94) 6.97 (0.87) 6.63 (0.63) 7.26 (0.91) 7.87 (0.92)
border 0.04 (0.19) 0.10 (0.31) 0.16 (0.37) 0.04 (0.20) 0.03 (0.17)
common language 0.11 (0.31) 0.08 (0.28) 0.11 (0.32) 0.05 (0.22) 0.12 (0.32)
colony 0.04 (0.19) 0.03 (0.17) 0.04 (0.20) 0.02 (0.14) 0.04 (0.20)
landlocked 0.34 (0.53) 0.35 (0.53) 0.35 (0.52) 0.37 (0.55) 0.30 (0.50)
Note: N is the number of observations, figures are mean, and the figures in parentheses are standard deviation.
Table 2. Trade Effects of Services RTAs: Standard panel estimation with year fixed effect
log of real imports in services
Random
Effect Country-Pair Fixed Effect
Aggregate (1) Aggregate (2) Financial (3) Business (4) Communication (5) Transportation (6)
ln(GDPi) 0.839 (0.019)*** 0.267 (0.123)** 0.91 (0.11)*** 2.19 (0.16)*** 1.06 (0.09)*** -0.00 (0.10)
ln(GDPj)
0.668 (0.019)*** 0.688 (0.122)*** 0.96 (0.11)*** 2.05 (0.16)*** 0.93 (0.09)*** 0.15 (0.02)***
ln(Distij)
-1.187 (0.043)*** ij border 0.923 (0.226)*** ij lang 1.574 (0.128)*** ij colony 0.625 (0.199)*** i landlock -0.640 (0.068)*** ij RTA 0.231 (0.023)*** 0.189 (0.023)*** 0.50 (0.02)*** 0.64 (0.03)*** 0.43 (0.02)*** 0.08 (0.02)*** i RTAout 0.281 (0.026)*** 0.119 (0.028)*** 0.04 (0.02) 0.20 (0.04)*** 0.05 (0.02)** 0.11 (0.04)***
Obs. 20,986 20,986 20,984 20.986 20.986 20.986
Notes: Standard errors are in parentheses. Intercept is included but not reported. *, **, and *** indicate that the estimated coefficients are statistically significant at 10 percent, 5 percent, and 1 percent, respectively.
Table 3. Trade Effects of Services RTAs:
Standard panel estimation with country-pair fixed effect, time-varying exporter and importer fixed effect, and year fixed effect
log of real imports in services
Aggregate Financial Business Communication Transportation
ij
RTA 0.137
(0.030)***
0.62 (0.03)***
0.81 (0.04)***
0.50 (0.02)***
-0.04 (0.04)
i
RTAout 0.026
(0.047)
0.31 (0.04)***
0.55 (0.06)***
0.18 (0.04)***
-0.24 (0.04)
Notes: Standard errors are in parentheses. Intercept is included but not reported. *, **, and *** indicate that the estimated coefficients are statistically significant at 10 percent, 5 percent, and 1 percent, respectively.
16
Table 4. Cumulative Trade Effects of Services RTAs
log of real imports in services
Aggregate Financial Business Communication Transportation (1) (2) (3) (4) (5) (6) (7) (8)
RTA (0) 0.142 (0.037)*** 0.412 (0.092)*** 0.127 (0.043)*** 0.149 (0.052)*** 0.37
(0.04)*** (0.06)***0.46 (0.06)***0.46 (0.07)***0.56 (0.04)***0.16 (0.04)***0.12 (0.04) 0.05 (0.05)** 0.11 RTA (-1) 0.060
(0.036)* -0.099 (0.053)* -0.021 (0.042) -0.027 (0.054) -0.10
(0.04)** (0.06)** -0.12 (0.06)** -0.12 (0.07)** -0.16 (0.04) -0.02 (0.05) 0.03 (0.04) 0.05 (0.05) 0.05 RTA (-2) 0.127
(0.242) 0.875 (0.258) 0.179 (0.234) 0.200 (0.232) 0.02
(0.24) (0.24) 0.00 (0.32) -0.17 (0.32) -0.18 (0.20) -0.26 (0.20) -0.30 (0.31) 0.14 (0.31) 0.13 RTA (-3) -0.024
(0.342) 0.600 (0.282) -0.119 (0.322) -0.097 (0.321) -0.12
(0.03) (0.34) -0.17 (0.44)** 1.11 (0.44) 1.02 (0.27) -0.03 (0.27) -0.09 RTAout (0) 0.087
(0.094)
0.25
(0.10)** (0.13)** 0.30 (0.08) -0.11 (0.11)* 0.18 RTAout (-1) -0.024
(0.100)
-0.05
(0.11) (0.14) -0.09 (0.08)** 0.17 (0.10) -0.01 RTAout (-2) 0.165
(0.146)
-0.15
(0.15) (0.20) -0.41 (0.12) -0.10 (0.12) -0.03 RTAout (-3) 0.087
(0.108)
-0.08
(0.11) (0.15) -0.22 (0.09) -0.14 Time-varying
exporter and importer fixed effect
Yes No Yes Yes Yes Yes Yes Yes Yes Yes Yes Yes
Country-pair
fixed effect No Yes Yes Yes Yes Yes Yes Yes Yes Yes Yes Yes Year fixed
effect Yes Yes Yes Yes Yes Yes Yes Yes Yes Yes Yes Yes Cumulative
Trade-creating
effect 0.303*** 1.789*** 0.166** 0.227* 0.17*** 0.18*** 1.28*** 1.24*** -0.15*** -0.23*** 0.23 0.28** Cumulative
trade-diverting
effect 0.315 -0.03** -0.05** -0.17** 0.15
Table 5. Complementary Relations
A. Trade in Goods to Trade in Services
log of real imports in
services ( lnMSVijt) (1) (2) (3) (4)
ln(GDPi)
0.358
(0.122)*** (0.122)** 0.304 (0.123)*** 0.234
ln(GDPj)
0.671
(0.121)*** (0.121)*** 0.618 (0.122)*** 0.546
lnMGijt
0.161
(0.013)*** (0.013)*** 0.159 (0.013)*** 0.158 (0.014)*** 0.043
ij
RTA (0.023)*** 0.178 (0.023)*** 0.183
i
RTAout (0.028)*** 0.116
Year fixed effect yes yes yes yes
Country-pair fixed effect yes yes yes yes
Time-varying exporter
and importer fixed effect no no no yes
Obs. 20,986 20,986 20,986 20,986
B. Trade in Services to Trade in Goods
log of real imports in goods ( lnMGijt)
(5) (6) (7) (8)
ln(GDPi) (0.073)*** 0.206 (0.073)*** 0.224 (0.073)*** 0.236
ln(GDPj) (0.072)*** 0.869 (0.072)*** 0.886 (0.073) 0.899
lnMSVijt (0.005)*** 0.058 (0.005)*** 0.057 (0.005)*** 0.057 (0.005)*** 0.016
ij
RTA (0.017)*** 0.064 (0.043) -0.014
i
RTAout (0.012)* -0.058
Year fixed effect yes yes yes yes
Country-pair fixed effect yes yes yes yes
Time-varying exporter
and importer fixed effect no no no yes
Obs. 20,986 20,986 20,986 20,986
Notes: Standard errors are in parentheses. Intercept is included but not reported. *, **, and *** indicate that the estimated coefficients are statistically significant at 10 percent, 5 percent, and 1 percent, respectively.
Table 6. Trade Effects of Services RTAs by Membership:
Standard panel estimation with country-pair fixed effect, time-varying exporter and importer fixed effect, and year fixed effect
log of real imports in services
( )
RTA north north− (0.050)*** 0.202
( )
RTA north−south (0.042)* 0.074
i
RTAout (0.047) -0.007
Obs. 20,986
Notes: Standard errors are in parentheses. Intercept is included but not reported. *, **, and *** indicate that the estimated coefficients are statistically significant at 10 percent, 5 percent, and 1 percent, respectively.