The Study of Overhead Line Fault Probability Model
Based on Fuzzy Theory
Jing Li1, Lijie Chen1, Donghong Zhao2, Yadi Luo1
1China Electric Power Research Institute, Beijing, China 2China Wuzhou Engineering Group Co., Ltd., Beijing, China
Email: [email protected], [email protected]
Received January, 2013
ABSTRACT
In the background of the design and construction of Smart Grid Operation Supporting System for District Power Net-works, this paper established the weighted fault probability model of the overhead line which is based on equipment operating status, utility theory and fuzzy theory. In this model, the proper membership function is adopted to describe the influence of lightning, wind speed, line ice and temperature, and the outage rate of overhead line, derived from his-torical statistics, is amended. Based on this model, the power supply risk analysis software is developed to calculate the online risk indicators of district grid, and provide real-time decision support information based on risk theory for sched-uling operations personnel.
Keywords: Power System; Fault Probability Mode; the Overhead Line; Risk Assessment
1. Introduction
Regional power grid plays an important role in transpor-tation and distribution of electric energy between high- voltage transmission grid and power consumer. It is closely linked with the country's economic development and people's living standards. With the development of social economics and power technology, the regional power grid is appearing the characteristic of more com-plex structures, more random load and more comcom-plex operational condition[1,3,5]. So, it is of great signifi-cance to study how to assess the security of district power grid.
In this paper, the overhead line fault probability model is established based on power system risk assessment theory and combined with the knowledge of fuzzy theory, and the forced outage rate of the lines is more in line with the actual operating conditions.
2. Overhead Line Fault Probability Model
Based on Fuzzy Theory
During the operation of the power system, overhead lines operation conditions are more complex and most se-verely affected by uncertain factors such as climate en-vironmental and so on, which have different influence characteristics to the overhead lines[2,4]. In this paper, a method of dealing with uncertainty information based on the fuzzy theory was adopted of appointment, and com-bined with the actual operation conditions of the power
system, the overhead line fault probability model is es-tablished.
2.1. Main Uncertain Factors
The overhead line unplanned outage causes in 2010(table C-3), released by the Electricity Reliability Management Center of the State Electricity Regulatory Commission, presented that the unplanned outage times caused by nat-ural disasters and climate factors is 632,accounting for 59.7% of the total number of the unplanned outage times; the unplanned downtime caused by natural disasters and climate factors is 6758.02 hours, accounting for 70.97% of the total time of non-planned outage. Therefore, the study of climate environmental factors for the impact of overhead lines and the prevention and control measures has far-reaching significance to ensure the safe and stable operation of the power system.
main study the Uncertainties factors affecting line outage rate as follows:
1) Temperature: The temperature changes will cause expansion and contraction of the line, and thus cause the lines sag and stress changes, and will affect the electrical parameters of the line. Higher temperatures, due to ther-mal expansion factors, the lines sag increase and the length elongate, which impact the safe distance of the wire-to-ground and cross across, and make the line resis-tance increases, and thus increasing the power loss in the line transfer power; When the temperature decreases, due to the cold shrink effect, the line length becomes shorter, the stress is increased, affecting the mechanical strength of the wire.
2) Wind: effects of wind on the overhead line are mainly in three aspects: Firstly, it will increase the load of wires and towers when the wind blows on the towers, conductors and its accessories; Secondly, with the action of the wind, the wire will deviate from the vertical plane, which will change the ground distance of the live wire, cross arm, towers, etc; Thirdly, the wire will vibrate and dancing in the wind, and the vibration will cause the wire fatigue, in severe condition it will cause broken stocks or short line, dancing makes chaos between the upper and lower rows of wire .
3) Lightning: line tripping caused by lightning can reach 70% of the total number of line tripping. And it can trigger a chain of reactions after being struck by lightning, such as wires blown, insulator broken, switch trip, etc. Being struck by lightning, over-voltage of overhead lines will result in flashover accident of insulation breakdown.
4) Line Icing: Line Icing cause wire and towers form-ing a vertical load, line load increasform-ing, may cause the disconnection and connection fittings destruction even down rod accident; Otherwise, ice-shedding difference or uneven may cause overhead lines jump, easily leading to flashover between parallels or between the wire and the lightning conductor, then burn wires or lightning conductor.
2.2. The Method of Fuzzy Theory to Deal with Uncertain Factors
The fuzzy uncertain factors are different from random factors, there is no exact probability distribution, and classical probability statistical methods can not be used to describe it. The fuzzy set theory introduced by Zadeh Professor is a powerful tool to deal with and descript the fuzzy uncertain factors. The fuzzy set allows for the de-scription of concepts in which the boundary is not sharp. Besides, a fuzzy set concerns whether an element be-longs to the set and to what degree it bebe-longs. It does not consider the situations where elements do not belong to. As a result, the range of fuzzy set is in [0,1]. A fuzzy set is mathematically defined by Zadeh as:
, A( )
A x x x X (1) where is the membership function of in A, and X is the universe of objects with elements x. In the case of the classical “crisp” set A, membership of x in A can be viewed as a characteristic function that can obtain two discrete values:
1; ( )
0;
A
ifx A x
ifx A
(2)
For the fuzzy set A, the value of the membership func-tion can be anywhere between 0 and 1, making it differ-ent from a crisp set. Membership function of a fuzzy set expresses to what degree the value of x is compatible with the concept of A.
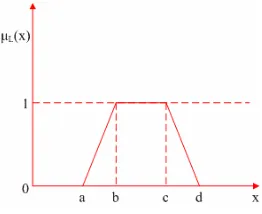
There is a wide variety of forms for fuzzy numbers, and triangular fuzzy numbers and trapezoidal fuzzy numbers are the most widely used in practical applica-tions. Trapezoidal fuzzy number is function based on left expand function L(x) and right expand function R(x). As shown in Figure 1, it is a L-R fuzzy numbers described
by the real parameters in (a, b, c, d), and the representa-tion of its membership funcrepresenta-tion as:
( ), 1.0, ( )
( ), 0,
L
L x a x b b x c x
R x c x d
others
(3)
where L(x) = (x-a) / (b-a) for [a, b] single increasing function; R(x) = (d-x)/(d-c) of [c,d] within a single reduc-tion funcreduc-tion; the trapezoidal fuzzy numbers center value is (b + c) / 2; a, d, respectively, is the left and right borders of the fuzzy numbers.
[image:2.595.358.489.617.724.2]Trapezoidal fuzzy numbers to characterize fuzzy fea-tures of the value have better usability. In power systems, the generator, load, and component failure status pa-rameters can be described by the trapezoidal fuzzy num-ber. For example, predict the maximum load of a system within a year, the fuzzy predictive method may conclude that: “the highest load will not be greater than 900 MW or less than 750 MW, more possibly from 800 MW to 850 MW”, then it is more appropriate to indicates it adopt-ing the trapezoidal fuzzy number, as Figure 1 shows.
2.3. Modeling Overhead Line Fault Probability Considering Fuzzy Uncertain Factors
1) Uncertainties membership function choice
The method of establishing the membership function include weighted method, fuzzy statistics, expert scoring method, interpolation ,standard function method and so on. There is strong uncertainty to the impact of climate change for overhead lines running. In this paper, based on the long-term experience of dispatcher to judge for these types of environmental factors and determine the membership function.
a) The membership function of lightning impact
The density of lightning is an important indicator to determine the lightning degree of a region. Lighting Lo-cation System (LLS) can automatically measure and re-cord the density of lightning. Lightning protection design standards also adopt lightning density as a reference. The membership function of the lightning effects identified here as shown in Figure 2:
The membership function of lightning disasters impact on overhead lines running as:
1
0,
( ) ,
1, x a x a
x a x b
b a x b
(4)
where in (4) a and b is the lightning density threshold determined according to the experiences of the dispatch-ing personnel, In other words, it does not affect while the lightning density is less than the lower limit threshold value a, and the influence coefficient is 0, otherwise, higher than the high limit threshold value b is considered a greater impact, influence coefficient is 1.
b) the membership function of wind speed and line Ic-ing
Wind speed can be obtained by the meteorological department forecast; while ice thickness for the line, air humidity, temperature and wind size the extent of ice damage has a larger impact, not yet theoretical or em-pirical model to predict the extent of ice cover based on meteorological conditions, we use the actual ice thick-ness measurement indicators to assess the severity of the ice storm. Wind speed and line of ice thickness with the fall line health density similar to lighting, the same form of the membership function μ2(x), μ3(x), shown in Fig-ure 3:
For the wind speed, in μ2 (x), A is the impact threshold value determined according to the experiences of the dispatching personnel, b is the critical value determined catastrophe occur; Line Icing μ3 (x), a and b are respec-tively the upper and lower critical value of ice thickness impact.
c) the membership function of temperature impact on
overhead lines
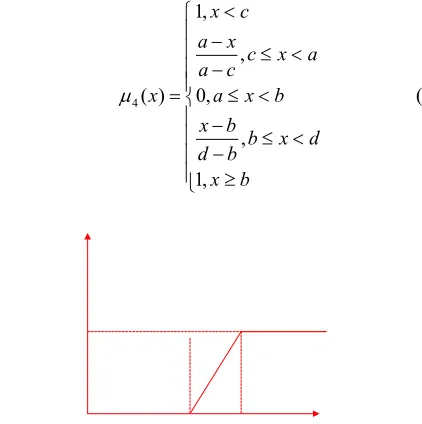
The temperature forecast information can be obtained by contact with the meteorological department. Within the normal temperature range, the temperature did not affect the line running, so the value is set at 0; when the temperature is too low or too high, its influence is large, and the function value is set to 1. The membership func-tion shown in Figure 4 below:
The membership function of temperature impact on overhead lines as:
4
1,
,
( ) 0,
,
1, x c
a x c x a
a c
x a x b
x b b x d
d b x b
[image:3.595.319.530.211.423.2](5)
[image:3.595.370.493.458.557.2]Figure 2. The membership function of the lightning effects.
Figure 3. The membership function of the wind speed and line Icing.
[image:3.595.359.501.608.709.2]where in formula 5, a, b, c and d determined according to the experiences of the dispatching personnel are the im-pact threshold value that air temperature imim-pact on over-head lines running.
2) overhead line fault possibility model
For any transmission lines, Generally, the span of overhead lines is larger, and different segments of the line in different climatic and environmental conditions. So first according to geographic information system (GIS) information,with the most complex of climatic factors that lines through as criteria for overhead line segment description, assume that the cross-regional temperature distribution of the most complex and divided into n stag-es, the definition:
[image:4.595.126.239.403.473.2] [image:4.595.307.538.469.573.2] [image:4.595.308.539.613.737.2]1 2 3
[ , , , , ]l l l ln
L (6)
where 1 2 3 n is segmented vector.
Any overhead line segmentation, the fuzzy number vector composed by the membership function of various impact factors is determined as follows
, , , ,
l l l l
1 2 3 4
[ , , , ]
r r r r
i i i i
r
(7)where ri1, ri2, ri3 and ri4 successively corresponds the fuzzy numbers that lightning, wind speed, line icing and temperature affect the segment i line outage probability , then the fuzzy number matrix as:
11 12 13 14
21 22 23 24
1 2 3 4
n n n n
r r r r
r r r r
r r r r
R
)
(8)
where, rij represents the fuzzy number of the j-th impact
factors impact on the i-th segment line. Definition B = [B1, B2, B3, B4] as the weight coefficients of line fault outage rate considering four influence factors, then:
1 2
[ , , , ]a a an
A R B (9)
where, ai is the impact factor of the i-th overhead lines
considering the four influential factors, thus four factors for the average impact factor of the whole of the line as:
1 1
( n i i) / (n i
i i
a l l
(10)Set the outage rate of overhead lines acquired from historical statistics is λ´, and after correction by the in-fluencing factors of overhead line outage rate is λ, then:
' '
'
(1 ) ,(1 ) 1
1,(1 ) 1
(11)
3. Analysis of Examples
According existing research results as defined in Section
2, this section defines the membership function coeffi-cient and the critical value of the influencing factors for a hypothetical transmission lines to create a its outages model. Line forced outage rate under normal operating conditions adopted “220 kV transmission line in 2010 forced outage rate”, released by the State Electricity Regulatory Commission, and it is 0.247. This section assumes the line running condition to correct its forced outage rate.
3.1. The Membership Function
The critical value of the membership function of light-ning, wind speed, line Icing and air temperature impact on overhead lines is shown in Table 1.
3.2. Line Segmentation
It is assumed that the total length of an overhead line is 100 km, and the wind speed change are maximum in its span area. The line is divided into four sections, namely l1 = 20 km, l2 = 30 km, l3 = 30 km, l4 = 20 km, its weather experienced can be shown as Table 2, this line
can be seen mainly effected by wind during the running.
3.3. The Correction Overhead Lines Forced Outage rate
The fuzzy numbers of various influencing factors ob-tained are shown in Table 3:
that:
Table 1. The critical value of the membership function.
The Influencing Factors
The Critical Value Of The Membership Function
Lightning
(number /(km2•a)) a1 = 1.05; b1 = 6.30
wind speed (m/s) a2 = 6; b2 = 15
line Icing (mm) a3 = 5 mm; b3 = 20 mm
Temperature (℃) a4 = -20; b4 = 40; c4 = -40; d4 = 60
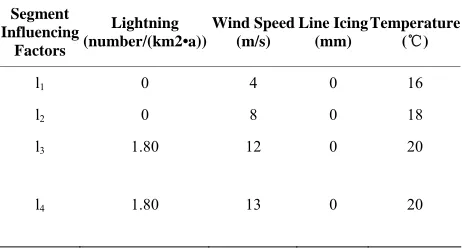
Table 2. The specific values of the overhead lines each seg-ment external factors.
Segment Influencing
Factors
Lightning (number/(km2•a))
Wind Speed (m/s)
Line Icing Temperature (mm) (℃)
l1 0 4 0 16
l2 0 8 0 18
l3 1.80 12 0 20
4. Conclusions
Table 3. The fuzzy numbers of various influencing factors.The Fuzzy
Numbers Lightning Wind Speed Line Icing Temperature
l1 0 0 0 0
l2 0 0.222 0 0
l3 0.143 0.333 0 0
l4 0.143 0.444 0 0
Based on power system risk assessment theory and com-bined with the knowledge of fuzzy theory, the overhead line fault probability model is established, by selecting the proper membership function to describe the influence of lightning, wind speed, line ice and temperature. In this model, the outage rate of overhead line, derived from historical statistics, is amended, and the forced outage rate of the lines is more in line with the actual operating conditions.
0 0 0
0 0.222 0 0 0.143 0.333 0 0 0.143 0.444 0 0
R
0
(12)
REFERENCES
[1] CIGRE Task Force 38.03.12. “Power System Security Assessment,” Electra, Vol. 175, 1997, pp. 49-77. [2] H. Wan, J. D. Mccalley and V. Vittal, “Increasing
Ther-mal Rating by Risk Analysis,” IEEE Transaci on Power Systems, Vol. 14, No. 3, 1999, pp. 815-828.
doi:10.1109/59.780891
Define the weight coefficient vector of four impact factors for line fault outage rate is: B = [0.2,0.4,0.2,0.2] T, then:
[0, 0.0888, 0.1618, 0.2062]
A R B (13) [3] W.-H. Fu, J. D. McCalley and V. Vittal, “Risk
Assess-ment for Transformer Loading,” IEEE Transacti on Power Systems, Vol. 16, No. 3, 2001, pp. 346-353. doi:10.1109/59.932267
By (10), four factors for the average impact factor of the whole line is μ = 0.1164.
By the formula (11) can be obtained the line forced
outage rate after the correction: [4] Y. Q. FengInvestigation on Power System Operation Risk Evalua-,W. C. Wu, H. B. Sun, et a1., “A Preliminary tion in the Modern Energy Control Center,” Proceedings of the CSEE, Vol. 25, No. 13, 2005, pp. 73-79.
(1 0.1164) 0.247 0.276
(14) As can be seen the line running is affected by exter-nal environmental factors, the forced outage rates is sig-nificantly increased compared to normal circumstances statistics value, so the in overhead lines outage modeling process can not overlooked the impact of environmental factors.