http://dx.doi.org/10.4236/jsea.2013.611067
Towards Developing Successful E-Government Websites
Osama Rababah1, Thair Hamtini2, Osama Harfoushi1, Bashar Al-Shboul1, Ruba Obiedat1, Sahem Nawafleh3
1
Department of Business Information Technology, King Abdullah II School for Information Technology, The University of Jordan, Amman, Jordan; 2Department of Computer Information System, King Abdullah II School for Information Technology, The Univer-sity of Jordan, Amman, Jordan; 3Department of Management Information System, University of Petra, Amman, Jordan.
Email: [email protected], [email protected], [email protected], [email protected], [email protected], [email protected]
Received September 30th, 2013; revised October 24th, 2013; accepted October 31st, 2013
Copyright © 2013 Osama Rababah et al. This is an open access article distributed under the Creative Commons Attribution License, which permits unrestricted use, distribution, and reproduction in any medium, provided the original work is properly cited.
ABSTRACT
Quality is a key factor to ensuring success of e-government websites. Therefore, a definition for high-quality e-gov- ernment website is required, as well as, an e-government system’s quality evaluation methodology. This paper identifies quality attributes that are required to assess the quality of an e-government website, which should be considered by de- velopers during the development of e-government applications. The primary goals are identifying, qualifying, catego- rizing, and ranking these factors, and then defining the interrelations among these quality factors.
Keywords: Web Application Development; E-Government; Quality Evaluation
1. Introduction
An e-government website forms a significant part of the government framework in advanced countries. It offers services to people in a context of advanced information technology, and new public management. Ensuring qual- ity through website evaluation arises from the fact that an e-government website is the most important channel for public services delivery, and citizen-government interac- tion. Furthermore, the need to justify government in- vestment that makes web-based service delivery possible is yet another reason for website quality assurance.
Past researches show that the website evaluation de- pends on multiple factors (e.g. download delay, errors in pages, broken links, server response time) that can be measured by web diagnostic [1,2]. Since government sites are becoming increasingly complex, an integral quantitative evaluation process regarding all relevant quality characteristics is also a complex issue. This is caused by the large amount of intervening characteristics, and by the complex logic relationships among attributes and characteristics. Besides, some relevant attributes to evaluate cannot objectively be measured so that they only can be included after a subjective measurement made by expert evaluators [3].
Most of the official government websites only offer basic information for visitors, without always paying
attention to the usability, accessibility, and content man- agement of the website. For example, making govern- ment services and information on the e-government web- sites is not equal to the successful access by users; es- pecially for persons with disability [4]. It is frequently the case for people to visit a website which is poorly structured, difficult to navigate and unfriendly for readers. Some sites take a long time to download content, which makes users become impatient and leave. Those sites are often developed by people who have the perception that a quality site is the one that demonstrates the latest multi- media and animation effects [5].
2. Identifying Quality Factor
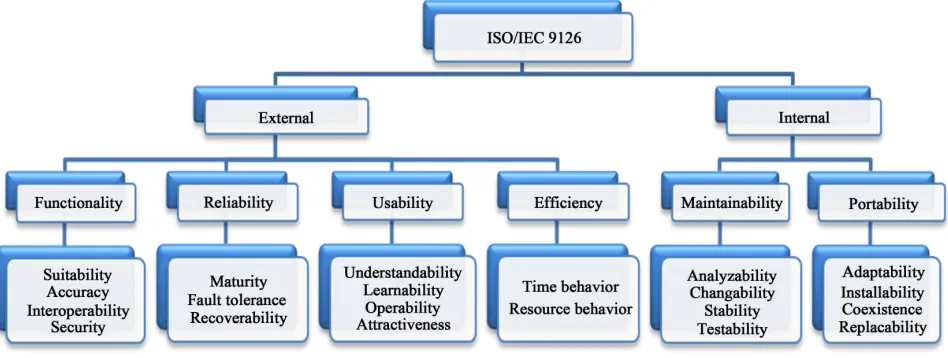
In this paper, the ISO/IEC 9126 was used as a base mo- del to identify the basic e-government website quality factors. The ISO/IEC 9126 standard was developed in 1991 to provide the framework for evaluating software quality [6].
tionality, portability, maintainability, efficiency, usability and reliability), each of which is further decomposed into sub-factors. The model is illustrated in Figure 1.
As the figure shows, modifications on the ISO/IEC 9126 hierarchy were done as our research shows the ne- cessity of including more characteristics and sub-char- acteristics after investigation, and receiving experts’ feedbacks through reviews and interviews. In particular, security, availability, readability, content, navigation and trustworthiness were added as main factors. Security sub- factor was removed from “Functionality” and was con- sidered as a “main” factor that contains many sub-factors (i.e. Authentication, Privacy, and Access Control) [7].
Website content is an important factor which deals with the characteristics of website information since it is the major source of value to customers [8]. Table 1 lists the factors used with a short explanation of each factor.
Based on the academic research exercised, it was thought that a list of twelve factors will satisfy an as- sessment of the quality of E-government websites. These factors then were extended with sub-factors. The com- plete list of those forty-nine sub-factors is displayed within quality factors in Table 1.
3. Qualifying and Rating
A rating system for the factors was built in order to re-
flect the relative importance of the different sub-factors within a main factor. The results were generated based on questionnaires from expert specialists in e-govern- ment website development.
The survey covered eighteen experts from IT compa- nies and government institutes in Jordan, most of them acquired development expertise, solid technical back- ground, and a wide experience in designing and devel- oping websites. Experts were distributed over five pri- vate companies and three government institutes. They
were basically asked to respond to the questionnaire by ordering the sub-factors within each factor according to the importance of their contribution towards their factor.
One randomly selected expert was identified to vali- date the content and style of the questionnaire to make sure that the questions were clear and complete, the ques- tionnaire’ response was excluded from further analysis.
Given factor S having four sub-factors, namely: SS1 to SS4, each participant was asked to rate each sub-factor according to its importance in influencing S, where 1 was the most important and 4 was the least. Sub-factors with fewer responses than 50% were removed from the analy- sis, and the average of received responses was calculated to fill in the gaps of any missing observations. Once all results were collected, a weighting scheme was applied to reflect the rating of the different sub-factors based on the following formula [9]:
Sub-factor Percent Importance100 M N 100 (1)
where M represents the average rating received on a sub- factor and N represents the total number of sub-factors for a given factor. The subtraction from 100 is to reverse the rating scale of the questionnaire so that the question- naire rating of “1” has the highest percentage importance. The final rating achieved has the highest percentage given to the most important sub-factor, proceeding to the least important in a descending fashion. One drawback to this method is that the final rating obtained for each sub-factor is dependent on the number of sub-factors in each group; therefore, it affects inter-factor correlations. To compensate for this problem, a second group of ex- perts were asked to assess the appropriateness of the cor- relations as explained in the next section.
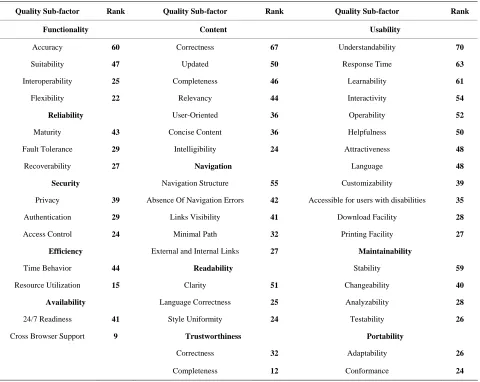
Table1 shows the rating received by each sub factor within each factor proceeding from the most important sub-factor to the least important in a descending fashion.
[image:2.595.62.536.533.712.2]Table 1. Identified quality sub-factors.
Quality Sub-factor Rank Quality Sub-factor Rank Quality Sub-factor Rank
Functionality Content Usability
Accuracy 60 Correctness 67 Understandability 70
Suitability 47 Updated 50 Response Time 63
Interoperability 25 Completeness 46 Learnability 61
Flexibility 22 Relevancy 44 Interactivity 54
Reliability User-Oriented 36 Operability 52
Maturity 43 Concise Content 36 Helpfulness 50
Fault Tolerance 29 Intelligibility 24 Attractiveness 48
Recoverability 27 Navigation Language 48
Security Navigation Structure 55 Customizability 39
Privacy 39 Absence Of Navigation Errors 42 Accessible for users with disabilities 35
Authentication 29 Links Visibility 41 Download Facility 28
Access Control 24 Minimal Path 32 Printing Facility 27
Efficiency External and Internal Links 27 Maintainability
Time Behavior 44 Readability Stability 59
Resource Utilization 15 Clarity 51 Changeability 40
Availability Language Correctness 25 Analyzability 28
24/7 Readiness 41 Style Uniformity 24 Testability 26
Cross Browser Support 9 Trustworthiness Portability
Correctness 32 Adaptability 26
Completeness 12 Conformance 24
4. Factors Relations
In order to build a reliable model, it is important to figure out the different inferences and causal relations between the quality factors [10]. Statistical correlation was used in analyzing the data obtained from the responses to the questionnaire to establish initial inter-factor relations. Correlation is not an indication of cause-and-effect rela- tionships [11] where changes in one variable impacts, and is the direct cause of changes in the correlated vari- able. Correlations merely indicate whether two variables are in harmony in terms of movement. However, a har- mony in movement in either the same direction or oppo- site (inverse) direction provides insight into possible cause-and-effect relationships. In this paper, correlations are used with rating scales, but with care. After the com- pletion of identifying the factors’ significant inter-rela- tions, the results were reviewed by a panel of experts to ensure they were comfortable with the results.
The validation of each possible relationship was car- ried out using a panel of experts to analyze the results of
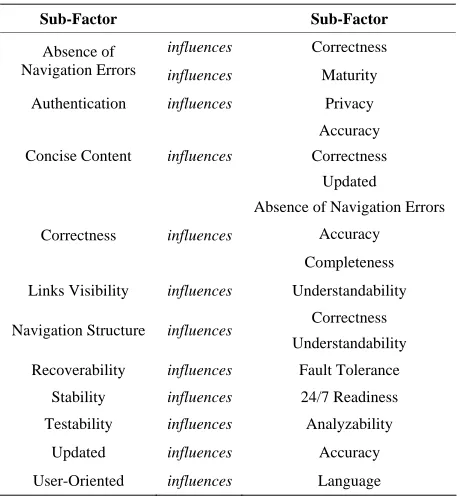
the correlation analysis to draw conclusions about which viable inter-dependencies exist amongst sub-factors. The panel members were invited to a group discussion on what would be the relevant and important relationships among the sub-factors. Using Martin’s approach [12], a stepwise model selection technique combining forward selection and backwards elimination was used. Every panel member was asked to select the best causal rela- tionship, in their view. The selection was iterated one relationship at a time in a round-robin approach. Not knowing when a cessation would be reached in this process, the members continued till their own point of satisfaction was reached and no further selection was added to their derived list. At that point a reversal elimi- nation process started where each member was asked to return the least desired relation from their possession. The process continued in a round-robin fashion until the panel collectively retained 50% of the initially selected relations. The exercise was concluded at that point. Ta-
Table 2. Final selection f sub-factor interdependencies iden-tified quality sub-factors.
Sub-Factor Sub-Factor
influences Correctness Absence of
Navigation Errors influences Maturity
Authentication influences Privacy Accuracy
Correctness Concise Content influences
Updated
Absence of Navigation Errors
Accuracy Correctness influences
Completeness
Links Visibility influences Understandability Correctness Navigation Structure influences
Understandability
Recoverability influences Fault Tolerance Stability influences 24/7 Readiness Testability influences Analyzability
Updated influences Accuracy User-Oriented influences Language
The same panel of three experts was invited to another exercise to perform interrelation analysis at the quality factors level. All the possible factor relationships, as shown in Table3, were projected at a display wall. The panel members were asked to assess the relation “cells” and provide a score of 0 to 2 where “2” indicates the presence of strong causal relations and a “0” the lack of such a relationship. Table 3 lists possible relations among factors and the rating results received. Table 4
shows the resultant relations inferred.
5. Conclusion
[image:4.595.58.288.110.360.2]This paper has identified and ranked the factors and sub- factors that contribute towards the quality of an e-gov- ernment website. Furthermore, the relationships among these factors showing which factors influence others have been derived. The results provide an important foundation for the understanding of quality in e-govern- ment websites that will allow developers to assess the strengths and weaknesses of their sites in order to know where to focus further development to achieve the high quality for e-government success [13,14].
Table 3. Factors polled relations.
External
F
unct
ionalit
y
Reliability Availability Usability Efficiency Readability Content Navigability Security
Trustwo
rthin
ess
Internal
Maintainability
Portability
External
Functionality
Reliability 4
Availability 1 5
Usability 4 1 1
Efficiency 2 2 3 3
Readability 4 1 0 6 3
Content 2 2 0 5 4 6
Navigability 3 1 1 4 4 5 3
Security 3 4 1 3 3 0 3 2
Trustworthiness 3 6 6 4 2 3 5 3 6
Internal
Maintainability 2 4 4 0 0 0 0 2 2 1
Portability 1 3 3 2 1 3 0 4 0 1 4
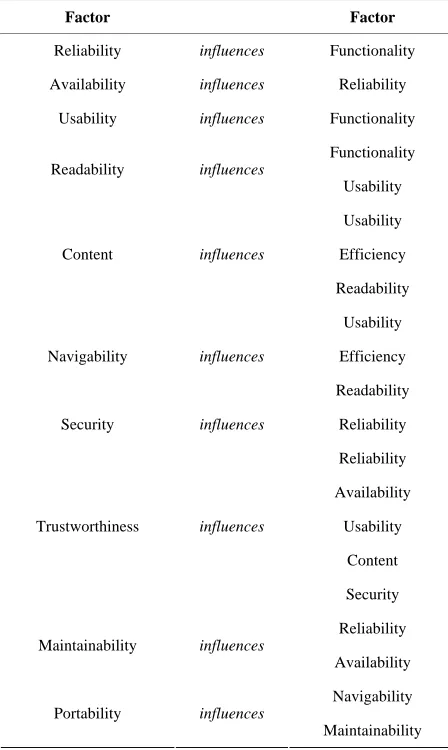
Table 4. Finalized selection of factor interdependencies.
Factor Factor
Reliability influences Functionality
Availability influences Reliability
Usability influences Functionality
Functionality Readability influences
Usability
Usability
Efficiency Content influences
Readability
Usability
Efficiency Navigability influences
Readability
Security influences Reliability
Reliability
Availability
Usability
Content Trustworthiness influences
Security
Reliability Maintainability influences
Availability
Navigability Portability influences
Maintainability
6. Acknowledgements
This work was supported by The University of Jordan.
REFERENCES
[1] Y. Rogers, H. Sharp and J. Preece, “Interaction Design: Beyond Human Computer Interaction,” 2nd Edition, Wily, New Jersey, 2007.
[2] H. Jati and D. Dominic, “Quality Evaluation of e-Govern- ment Website Using Web Diagnostic Tools: Asian Case,”
International Conference on Information Management and Engineering (ICIME), Kuala Lumpur, 3-5 April 2009, pp. 85-89.
[3] D. T. Green and J. M. Pearson, “Integrating Website Us- ability with the Electronic Commerce Acceptance Model,”
Behaviour & Information Technology, Vol. 30, No. 2, 2011, pp. 181-199.
http://dx.doi.org/10.1080/01449291003793785
[4] Georgia Tech Research Institute, “Overview of State Ac- cessibility Laws, Policies, Standards and Other Resources,” 2012.
http://accessibility.gtri.gatech.edu/sitid/stateLawAtGlance .php
[5] A. Olalere and J. Lazar, “Accessibility of US Federal Gov- ernment Home Pages: Section 508 Compliance and Site Accessibility Statements,” Government Information Quar- terly, Vol. 28, No. 3, 2011, pp. 303-309.
http://dx.doi.org/10.1016/j.giq.2011.02.002
[6] ISO, “ISO/IEC IS 9126: Software Product Evaluation- Quality Characteristics and Guidelines for Their Use,” In- ternational Organizational for Standardization, Geneva, 1991.
[7] D. L. Baker, “Advancing E-Government Performance in the United States through Enhanced Usability Benchmarks,”
Government Information Quarterly, Vol. 26, No. 1, 2009, pp. 82-88. http://dx.doi.org/10.1016/j.giq.2008.01.004 [8] L. Hasan and E. Abuelrub, “Assessing the Quality of Web-
sites,” Applied Computing and Informatics, Vol. 9, No. 1, 2011, pp. 11-29.
http://dx.doi.org/10.1016/j.aci.2009.03.001
[9] O. Rababah, “Quality Assessment of E-Commerce Web- sites Using Bayesian Belief Network,” Loughborough Uni- versity, Leicestershire, 2007.
[10] T. L. Eleanor, “A Measure of Web Site Quality,” Man- agement Department, Washburn Hall-WebQual™, 1999. [11] StatSoft, “Basic Statistics Introduction,” 2012.
http://www.statsoft.com/textbook/stbasic.htm
[12] M. Martin, “It’s Like...You Know: The Use of Analogies and Heuristics in Teaching Introductory Statistical Meth- ods,” Journal of Statistics Education, Vol. 11, No. 2, 2003.
[13] M. J. Kargar, A. R. Ramli, H. Ibrahim and S. B. Noor, “To- wards a Practical and Valid Model for Assessing Quality of Information on the Web,” International Review on Computers and Software,Vol. 2, No. 2, 2007, pp. 80-88. [14] T. Hamtini and O. Rababa, “A Graphical Model for As-