2013. Vol.1, No.2, 1-6
Published Online October 2013 in SciRes (http://www.scirp.org/journal/gep)
Research and Application of Pollution Control in the Middle
Reach of Ashe River by Multi-Objective Optimization
Yuanyuan Wang
1, Liang Guo
1,2, Yi Wang
1, Meng Ran
1, Jie Liu
1, Peng Wang
1,2*1
School of Municipal and Environmental Engineering, Harbin Institute of Technology, Harbin, China 2State Key Laboratory of Urban Water Resource and Environment,
Harbin Institute of Technology, Harbin, China Email: [email protected]
Received July 2013
Based on one-dimensional water quality model and nonlinear programming, the point source pollution reduction model with multi-objective optimization has been established. To achieve cost effective and best water quality, for us to optimize the process, we set pollutant concentration and total amount control as constraints and put forward the optimal pollution reduction control strategy by simulating and optimiz-ing water quality monitoroptimiz-ing data from the target section. Integrated with scenario analysis, COD and ammonia nitrogen pollution optimization was studied in objective function area from Mountain Maan of Acheng to Fuerjia Bridge along Ashe River. The results showed that COD and NH3-N contribution has been greatly reduced to Ashe River by 49.6% and 32.7% respectively. Therefore, multi-objective optimi-zation by nonlinear programming for water pollution control can make source sewage optimioptimi-zation fairly and reasonably, and the optimal strategies of pollution emission are presented.
Keywords: One-Dimensional Water Quality Model; Point Source Pollution Reduction; Multi-Objective Optimization; Middle reach of Ashe River
Introduction
With the rapid development of China’s economy and the speeding up of urbanization, water pollution and shortage of water resources have become very serious, so water pollution management is imperative. However, in our country, river basin pollution control is incompatible with social economic devel-opment, and economic decisions often run counter to the envi-ronment (http://wfs.mep.gov.cn/zdlyshew/), so the protection of the water environment should be in the social, economic and environmental system. Water pollution control is a multi-ob- jective optimization problem, which can make the river water quality standard and pollution control cost effective without af-fecting the premise of social and economic development. Ac-cording to the types of pollution source, the discharge of pollu-tants and emissions have great difference, sewage treatment fee is difficult to quantify, so from the perspective of the water environmental capacity control (Qian et al., 2008), and the river water quality reaching the water requirements under the pmise of function planning, we carried out water pollution re-duction control of pollution points sources in the river, consi-dering minimizing the sum of squares routine index of rate as economic target. We study the middle heavy pollution reduction zone of Ashe River basin as an example, consider the coupling comprehensive multi-objective linear programming and genetic algorithm with global optimization characteristics (S.A.B. et al., 2007; Sun et al., 2007; R.Z. et al., 2007), combined with a one dimensional water quality model, and use the theory of scenario analysis to make strong concentration control of the pollution source, and provide technical support for river basin water pol-lution control.
Methods
Study Area
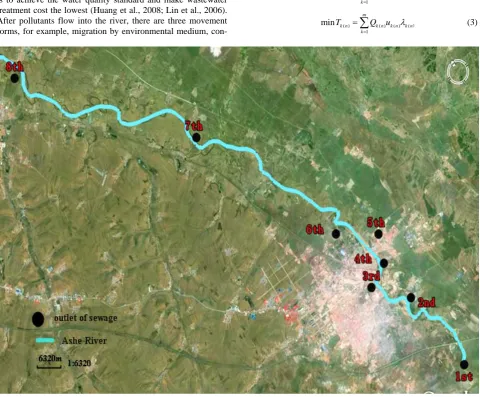
Ashe River(Li et al., 2007; Li et al., 2011) locates in Hei-longjiang Province, as an important tributary of the right bank of the Songhua River, which originates in MaoEr hills of ShangZhiShi, and flows through ShangZhiShi, following by Harbin city, XiangFangOu, DaoWaiOu, finally into the Song-hua River. Ashe River, known as “Gold River”, has received a large number of industrial wastewater and sewage in the rapid development of local economy and the water ecological envi-ronment of river has been completely damaged, which posed a serious threat to water quality of Songhua River. Ashe River belongs to the mountain river, whose water supply is given priority to atmospheric rainfall that mainly concentrated in 6 ~ 9 month, and accounted for about 70% ~ 80% of the total an-nual precipitation, besides river frozen winter period generally lasts more than four months. There are two environment func-tion areas in Ashe River, respectively maanshan stafunc-tion-Ashe River and west spring reservoir-ma a shan station. We mainly focus on maanshan station-tuerjia bridge function area covering Acheng qu as the study area, with total length of 113 km, whose direct pollution sources are Yeast enterprise, pharmaceutical company, sewage plant and so on. There are many tributaries in the middle of Ashe River, such as Yuquan River, Nandagou, Chengnangou, Haigou River and Miaotaizigou. All of them received sewage and industrial waste water from city. So, we should view these tributaries as pollution outlet in order to carry on pollution control strategy research.
factory’s waste water, and coastal agricultural non-point waste-water; Nandagou and Chengnangou, originally small seasonal rivers, mostly received through storm water from double fung street and Acheng City; A pharmaceutical company, a yeast and a sewage plant’s pollution concentration and the mass is con-stant throughout the year; Haigou River and Miaotaizigou are seasonal rivers, which received the sewage flowing through the town. The dynamic emission mass of corresponding index of every pollution outlets can be obtained by multiplying the con-centration (mg/L) and emissions (m3/s) with conversing the unit. Based on villages and towns sewage discharge of pollutants characteristics, we choose COD and NH3-N as main pollution
[image:2.595.60.541.298.695.2]index to have water environment quality research, as shown in
Figure 1.
The Establishment of Pollution Reduction Based on
Multi-Objective Linear Optimization Model
Water environmental planning involves the ecological, envi-ronmental, economic, technical and social life, whose main goal is to achieve the water quality standard and make wastewater treatment cost the lowest (Huang et al., 2008; Lin et al., 2006). After pollutants flow into the river, there are three movement forms, for example, migration by environmental medium, con-
taminant particle dispersion, and pollutants transformation and attenuation. Therefore, we think that pollutants from sewage plants have fully combined with vertical and horizontal process of the river. Then, we simulate river pollution sources by one- dimensional water quality model, which can make pollution emission wonderfully linked with water environmental capacity of functions, so as to improve the operability of pollution re-duction optimization.
The model is composed of objective function and constraints conditions. Firstly, we should set corresponding reduction rate
λk (0 < λk < 1) to k pollution sources intensities, that means it
can be become Qk(1 −λk) after reduction. Constraint conditions
are that pollutants from every pollution outlets combined well with river should be achieved with water index standards (Tian et al., 2010). So, the model is shown as the following:
(1) (1) (1) (1 1
min
m
k k k k
k
T Q u λ
=
=
∑
) (1)( 2) ( 2) ( 2) ( 2 1
min
m
k k k k
k
T Q u λ
=
=
∑
) (2)( ) ( ) ( ) ( 1
min
m
k n k n k n k n k
T Q u λ
=
=
∑
) (3)Note: 1st outlet of sewage is Yuquan River; 2nd outlet of sewage is Nandagou; 3rd outlet of sewage is Chengnangou; 4th outlet of sewage is Harbin yeast company; 5th outlet of sewage is a pharmaceutical factory; 6th outlet of sewage is a sewage treatment plant; 7th outlet of sewage is Haigoi River; 8th outlet of sewage is Miaotaizigou.
Figure 1.
(n) *
(n) 0
(n) (n) (n) * (n) -1( ) -1 (n)
-1
( -1, ) (n) (n) -1 0 =1 (k=1) (k=2,3,4...) = (1- )
+C =
+ . .
= exp (- ) 86400 Q =Q +
0 (n)<1
k s
k
k k k
k k k n k
k
k k
n k k
k k k k i i k C C C C u u
Q u Q
C Q Q s t K l C C v Q λ λ ∗ ∗ ∗ ≤ ≤ ∆ ∆ ≤
∑
(4) Where:Tk(n)—the total mass needed to be managed of nth pollution
index from k pollution outlets in the drain, kg/min;
Ck(n)—the concentration of nth pollution index mixed well
with the river when it reached kth pollution emission, mg/L;
U*k(n)—the concentration of nth pollution index of kth sewage
plants, mg/L;
ΔQk—the total mass of kth pollution emission, m 3
/s;
Qk—the river flow mass of kth pollution emission after
se-wage water mixed in the study area, m3/s;
C*k(n)—the background concentration of nth pollution index
of kth pollution emission, mg/L;
Kn—the degradation coefficient of nth pollution index, 1/d;
l(k−1,k)—the distance from (k−1)th pollution emission to kth
pollution emission, m;
v—the mean flow rate of the study river, m/s;
λk(n)—the management coefficient of nth pollution index of kth
pollution emission.
It is known that sewage treatment fee increased with the im-proving of emission water quality, and the water self-purifica- tion ability is linked with the economic effect of sewage treat-ment efficiency. Besides, it is hard to quantify, so we viewed concentration control and total amount control of pollutants as constraint condition, the minimum each pollutant reduction rate of the discharge outlet as economic target, then, we set up mul-ti-objective optimization pollution reduction model. In the study, we choose COD and ammonia nitrogen as the overall amount control index, and obtained initial control section monitoring data of real time, COD and NH3-N and corresponding sources
intensity index of the outlet of the emission source Q (mg/s). Finally, we can get each coefficient, which make pollution in- dex of the outlet of every discharge achieves water quality stan- dard.
Emission Reduction and Control Optimization
Set emission Scenarios
1) Identify pollution sources We study the decentralized points sources, including Industry pollution sources and life pollution sources in Ashe River pollution management.
2) List planning object According to the research pollution sources, we think the discharge of major pollution indicators as the pollution reduction control object, which means COD and ammonia nitrogen.
3) Build scenario In study area, Non-point source pollution refers to large area, wide range, the factors such as livestock
breeding, arable land and pesticide use, compared with the point source pollution emissions small, is always negligible; Supposing that the concentration and total mass of sewage wa-ter from each emissions is constant; pollutants diffusion meets one-dimensional water quality model delete; COD concentra-tion of Mountain Maan staconcentra-tion-Fuerjia Bridge control secconcentra-tion accords with Ⅳ function area standard, when CCOD < 30 mg/L,
CNH3-N < 1.5 mg/L, there is no need to be reduced, however,
when CCOD > 30 mg/L, CNH3-N > 1.5 mg/L (Zhao et al., 2010), it
will be necessary to have optimal reduction by multi-objective optimization model.
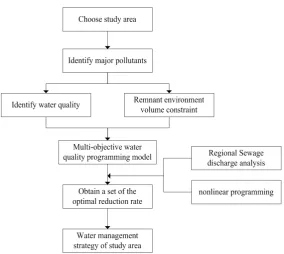
Pollution Reduction Control Technology Framework in River
The calculating methods and implementation process of mul-ti-objective planning pollution reduction model in view of de-centralized point sources are as follows:
1) Determine the study area, make a survey about the river blow-down circumstance through the local environmental mon-itoring station, and identify the characteristics pollutants needed to be controlled and its concentration.
2) According to basin hydraulic conditions and mixing-di- luted-diffusion characteristics of characteristic pollutants in water body, select the appropriate model to simulate the pollu-tants concentration change after flowing into the river, and set up multi-objective optimization pollution reduction model as-sociated with the function of water environment capacity in or- der to minimize pollution in rivers.
3) Set the reduction rate with random value in initial of the outlet, and obtain minimum rate combination that could satisfy the requirement of water quality in water function area by mul-ti-objective optimization.
4) Continue to search and do overalls of optimization, until the optimal combination of cutting rate conforming to the con-ditions, then the result could be output, according to the results, put forward corresponding water environmental management strategy (http://datacenter.mep.gov.cn/trs/query.action).
Model Application
Regional Drainage Analysis
In this paper, water quality management was carried out in the middle heavy pollution reduction zone of Ashe River by using the multi-objective planning model, and proposed pollu-tion prevenpollu-tion and control countermeasures according to the results of the simulation. There are eight main outlets in the Acheng section of Ashe River, and we can set up efficient eco-nomic sewage treatment facilities with high efficiency to im-prove water quality through the reduction rate of each outlet whose main pollution indicators are COD and NH3-N. We found
that the total annual COD contribution from eight main outlets to Ashe River is 13332.83 t/a, the NH3-N is 433.13 t/a, and the total amount contribution of 6th sewage plant is 1825 m3/a; from Table 1, the 2nd drain outlet to Ashe River has the max-imum contribution of COD each year, accounting for about 40%; the 6th has a large amount of ammonia nitrogen pollution contribution to Ashe River, whose ammonia nitrogen contribu-tion to Ashe River accounts for more than 33% of all outlet. Finally, pollution contribution of COD and ammonia nitrogen emissions from various sources to Ashe River are shown in
Figure 2.
[image:4.595.55.540.400.543.2]The calculating methods and implementation process of using multi-objective planning pollution reduction model.
Table 1.
Emission of water pollutants from every pollution source of Ashe River in 2012.
Pollution Sources Sewage Discharge Volume (million m3/a) Emission of Water Pollutants of Ashe River (t/a)
COD NH3-N
1st 890 1335 76.60
2nd 650 5453.5 22.56
3rd 460 1573.2 75.44
4th 35.3 92.48 6.35
5th 38.64 32.92 1.06
6th 1825 1095 146
7th 1200 1440.73 55.36
8th 1600 2310 59.76
Total 6698.94 13332.83 433.13
Case Analysis
The eight outlet information of Mountain Mana station-Fu- erjia Bridge monitoring section in the middle reaches of Ashe River has been described in Section 1.1. Now, we simplified the pollution discharge process, as shown in Figure 3. Accord-ing to the available Harbin environmental monitorAccord-ing central station monitoring data in 2012, we got that the COD concen-tration of the upstream water outlet of the 1st (CCOD) is 12.5
mg/L, ammonia nitrogen concentration (CNH3-N) is .20 mg/L.
Considering water function zone, the water quality of Acheng section in Ashe River needs to meet water quality standards of GB3838-2002 class IV, so, we set CCOD with 30 mg/L and
CNH3-N with .15 mg/L in the model. In the analysis, we firstly
choose the Mountain Maan station monitoring average flow rate for many years as the middle-up flow parameters in emis-sion reduction model, according to Ashe River years monitor-ing data combined with local actual situation. Then, accordmonitor-ing
to related data of water environmental quality status in the Ashe River middle reaches, we calculate and determine that self- purification coefficient of COD emissions from various sources is .1, and ammonia nitrogen’s self-purification coefficient is .06.
Based on monitoring data, we established the multi-objective programming function viewing the minimal total mass of pol-lutants index reduction as the objective and the function is as the following:
1 2 3 4 5 6 7 8
min
2.5 10.4 3 0.2 0.06 2.1 2.7 4.4
COD T
λ λ λ λ λ λ λ λ
= + + + + + + +
(5)
3
1 2 3 4 5 6 7 8
min
0.14 0.04 0.1 0.01 0.002 0.3 0.1 0.1 NH N
T
λ λ λ λ λ λ λ λ
−
= + + + + + + +
Figure 3.
Procedure of Discharge of 8 outlets around Acheng Section of Ashe River. λ1 = 1, λ2 = .7, λ3 = 1, λ4 = 0, λ5 = 1, λ6 = .39, λ7 = .68, λ8 = .86.
Then, we put the values of λ1 ~ λ8 into multi-objective
mode{(5)-(6)}to obtain total minimum governance mass of COD and ammonia nitrogen indicators of 8 outlets: minT COD =
6620.5 t/a, minT NH3-N = 142.4 t/a. According to the planning
sewage outlets data, we obtained the COD and NH3-N
contri-butions to Ashe River after corresponding reduction rates of COD and ammonia nitrogen pollution indicators, as shown in
Table 2.
Results and Discussion
In the model application process, the 1st, the 3rd and the 5th sewage outlets water treatment coefficient have to be 1, which indicates that these three sewage outlets should be improved significantly, so that COD and NH3-N can be achieved Grade
IV water quality standard before they flew into the Ashe River. Among them, the amount of the 1st outfall and the 3rd outfall waste water are much more, which are mainly from rural enter-prises (including a beer company and liquor companies), se-wage and agricultural waste water, and the concentration of the main pollution indicators is bigger, so both of them need to be strengthened governance. The 5th outlet is from a pharmaceut-ical company, although there are relatively small discharges, the concentration of pollution indicators is greatly larger: CCOD
= 85.2 mg/L, CNH3-N = 2.73 mg/L, far exceeded IV water
quali-ty standard. Besides, perennial rivers flowing through this sec-tion subjected to severely pollusec-tion, and water purificasec-tion ca-pacity is weak, so the study area needs to be emphasized for governing. In addition, the 4th outfall flow is small and sewage treatment equipment improved the enterprise itself, so the total source strength is negligible. As a result, from an economic and
environmental point of view, the outfall abatement rate of 0 is deleting reasonable. Through multi-objective optimization model, each outfall COD and NH3-N indicators have been greatly
re-duced the contribution rate, decreased by 49.6% and 32.7%. With these reduction strategies, Ashe River water quality will be greatly improved.
Conclusions
In the case of information scarcity or lack of historical data, this method can be used to simplify the water environmental system, then, we establish pollution reduction model based on multi-objective linear programming combined with one-dimen- sional water quality model, considering the optimal economic and optimal water quality as the goal, concentration control and total amount control as constraint conditions, to manage pollu-tion source in the Ashe River middle reaches. In addipollu-tion, we used multi-objective optimization with overall search function, and simulated or optimized the monitoring data from outlet or the target section in order to put forward the optimal control strategy to make the target functional areas standard. Compared with other single objective planning methods, this method is more flexible and practicable.
Combining with scenario analysis, we study and analyze of the COD and NH3-N reduction of Maanshan station-Fuerjia
bridge monitoring section in the middle reaches of Ashe River was carried out, where water quality is performed class IV wa-ter quality standard. Afwa-ter model application, we found that COD and NH3-N contribution to Ashe River of each outlet has
greatly reduced by 49.6% and 32.7% respectively. Therefore, the plan was realized with cost effective and environmental friendly.
Table 2.
The contribution to river and quality needs to be reduced of the key water indices. Pollution
Sources
Pollution Control Coefficient
Emission Concentration of COD (mg/L)
Emission Concentration of NH3-N (mg/L)
Emission of COD of Ashe River (t/a)
Emission of NH3-N of Ashe River (t/a)
1st 1.00 0 0 0 0
2nd .7 25.17 1.04 5071.7 20.9
3rd 1.00 0 0 0 0
4th 0 98.3 12.6 92.48 6.35
5th 1.00 0 0 0 0
6th .39 21.41 .66 667.9 89.06
7th .68 35.6 .54 465 17.7
8th .86 53.9 1.40 323.4 8.4
Total - - - 6620.5 142.4
C C
1*
C1 C2 C2* C3 C3* C4 C4* C5 C5* C6 C6* C7 C7* C8 C8*
ΔQ1
ΔQ2 ΔQ3 ΔQ4
U7
U7*
U6
U6*
U1*
U1
U8*
U8
U5
U5*
U4
U4*
U3
U3*
U2
U2*
ΔQ6
ΔQ5 ΔQ7
ΔQ8
Q
Zhujia
1st
7th 6th
5th 4th
3rd 2nd
8th
[image:5.595.55.539.602.736.2]Acknowledgements
We thank Harbin Environmental Monitoring Station for the help of the monitoring data. We acknowledge the Research Fund for “scatter point source treatment technology and demo- nstration of heavy pollution reduction in the middle reach of Ashe River” (2012ZX07201003-002).
REFERENCES
Chinese Ministry of Environmental Protection (2010). National “Twelve Five” plan of focus on water pollution prevention (2011-2015). http://wfs.mep.gov.cn/zdlyshew/
Rongsun, Q. (2008). Further strengthen the control and management of water environment capacity. China Construction News.
Momtahen, S., & Dariane, A. B. (2007). Direct search approaches using genetic algorithms for optimization of water reservoir operating poli-cies. Journal of Water Resources Planning and Management-Asce, 133, 202-209.
Dong, S., & Yang, W. (2007). Genetic algorithm solution of a gray nonlinear water environment management model developed for the liming river in Daqing, China. Journal of Environmental Engineer- ing Asce, 133, 287-293.
Zou, R. (2007). An adaptive neural network embedded genetic algori- thm approach for inverse water quality modeling. Water Resources
Research
Hua, L. B. (2011). Water quality monitoring survey of Ashe River. Hei- longjiang Science and Technology Information, 8, 81-85.
Fei, L. J., Qiang, F., & Guo, M. Q. (2012). Basin pollution situation analysis and discussion of Ashe River. Water Conservancy Science and Technology and Economy, 3, 50-54.
Feng, H. X., Guo, S. D., & Quan, G. W. (2008). Research of rivers emission rights allocation model by multi-objective optimization. Journal of Hydraulic Engineering, 1, 75-80.
Feng, L. G. (2006). Based on fairness, efficiency and multi-objective optimization method of river pollution load distribution. D. Thesis, Guangzhou: Zhongshan University.
Gang, T. X., Ting, J. M., & Jian, H. (2010). Multi-objective program- ming model for sewage pollution control programs in the riparian Application—Minjiang River in Yibin City as an example. Resour- ces and Environment in the Yangtze Basin, 10, 156-162.
GB3838-2002, Surface water quality standards. http://datacenter.mep.gov.cn/trs/query.action