© 2016, IRJET | Impact Factor value: 4.45 | ISO 9001:2008 Certified Journal
| Page 1169
COLOR BASED IMAGE SEGMENTATION USING CLASSIFICATION OF K-NN
WITH CONTOUR ANALYSIS METHOD
Ramaraj.M
*1, Dr.S.Niraimathi*
21
Research Scholar Department of Computer Science,
NGM College, Pollachi, India.
[email protected].
2
Assistant Professor, Department of Computer Science,
NGM College, Pollachi India,
---***---
ABSTRACT
Recent advances in computer technology have
made it possible to create database for large number of images. A major approach directed towards achieving CBIR is the use of low-level visual features of the image data to segment, index and retrieve relevant images from the image database. Segmentation is the partition of a digital image into regions to simplify the image representation into something that is more meaningful and easier to analyze. Considering that an image can be regarded as a dataset in which each pixel has a spatial location and a color value, color image segmentation can be obtained by clustering these pixels into different groups of coherent spatial connectivity and color. Color based segmentation is significantly affected by the choice of color space. In different color spaces, such known as HSV, L*a*b, YBRC and more number of color methods available here. And one of the concept as CONTOUR ANALYSIS is used to segment the object and shapes into the different region of the colors. The main goal of segmentation is to partition an image into regions. Some segmentation methods such as thresholding achieve this goal by looking for the boundaries between regions based on discontinuities in grayscale or color properties. This paper proposes a color-based segmentation method that uses K-means clustering technique. The K-means algorithm is an iterative technique used to partition an image into K-means clusters. The pixels are clustered based on their color attributes and spatial features, where the clustering process is accomplished.
Key words: Segmentation, Clustering, Color Methods, Contour Analysis, K-NN, K-means.
INTRODUCTION
© 2016, IRJET | Impact Factor value: 4.45 | ISO 9001:2008 Certified Journal
| Page 1170
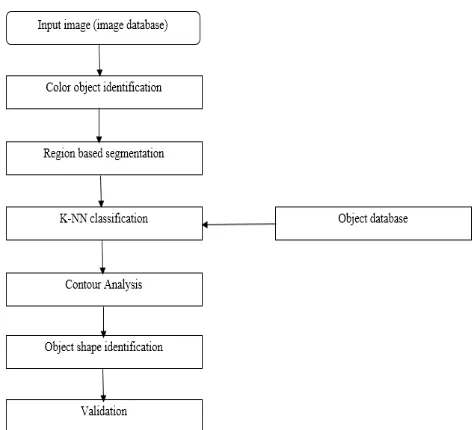
Figure 1: block diagram of color classification usingK-NN
Figure 1 is represents the retrieval of an image from the image database, which helps on the query image processing (CBIR), the color classification using K-NN will be applied for color image. The role of contour analysis is to draw the object in the same color pixels in the image to various object shapes, which will be generated.
Colored images mainly represent the color information of each pixel composing them. Image processing can be said to increase the perception properties of an image, may it be noise removal, enhancement and segmentation, all these features are well attained by the image processing techniques [9]. Image segmentation consists of dividing the input image into several regions having similar pixel properties within a single region. The goal of segmentation is to simplify and/or change the representation of an image into something that is more meaningful and easier to analyze. Image segmentation is mainly used to form a set of segments that collectively cover the entire image. Only certain parts of the image attract the researcher and they explore those parts.
Image segmentation is the basis of image analysis and understanding and is a crucial part and an oldest and hardest problem of image processing. Clustering, a vital element of model identification field means distinguishing
and classifying things that are provided with similar properties. Clustering technique classifies the pixels with the same characteristics into one cluster, thus forming different clusters according to coherence between the pixels in a cluster. Clustering analysis assigns a set of observations into subsets called as cluster so that the observations in the same cluster are similar in some sense. It is a method of unsupervised learning and a common technique for statistical data analysis used in many fields, including machine learning, pattern recognition, image analysis and bioinformatics.
RELATED WORK
Amanpreet Kaur Bhogal et al (2010) [15], describes image segmentation as the basis of image processing, comprehension and model identification and a hot research subject of image processing technologies. Color image segmentation using the neural networks, K-means clustering algorithm has yielded fruitful results. An advantage resulting from the choice of color space representation could be taken to enhance the performance of segmentation processes. Namrata et al (2013) [14], describes Contour Analysis as a method to describe, store, compare and find the object presented in the form of exterior outlines, solve the main problems of a pattern recognition - transposition, turn and a rescaling of the image of object. CA methods are invariant to these transformations. It provides more realistic interaction. It is an advance method and could be a promising technology for motivating users to engage in learning systems.
[image:2.595.43.281.99.314.2]© 2016, IRJET | Impact Factor value: 4.45 | ISO 9001:2008 Certified Journal
| Page 1171
corresponds directly to the concept of intensity/brightnessin the color basics section.
Loai AbedAllah et al the K-Nearest Neighbor (K-NN) algorithm depends critically on its being given a good metric over the input space. The K-Nearest Neighbor (K-NN) algorithm uses only the geometric distance to measure the similarity and the dissimilarity between the objects without using any statistical regularities in the data, which could help convey the inter-class distance. Poonam Panwar et al (2013) [13], image segmentation is a set of segments that collectively cover the entire image or a set of contours extracted from the image. The quality of segmentation depends upon the quality of image. The segmentation is based upon the measurement taken from the image and might be grey level, texture, color, depth or motion [8]. Models are computer generated curves that move within the image to find object boundaries under the influence of forces of curve and image itself. One may visualize the active contour as a band or rubber band of arbitrary shape that is deforming with time trying to get as close as possible to the object contour.
IMAGE SEGMENTATION
Segmentation is a process by which an image is partitioned into multiple regions (pixel clusters). The aim of segmentation is to obtain a new image in which it is easy to detect regions of interest, localize objects, or determine characteristic features such as edges [3]. As a result, the image obtained by the segmentation process is a collection of disjoint regions covering the entire image whereby all the pixels of a particular region share some characteristic or property such as color, intensity, or texture. Furthermore, a standard digital camera captures the spectrum in three dimensions corresponding to the three primary colors: red (R) (in the range of wavelengths from 560 to 700 nm), green (G) (480 to 600 nm) and blue (B) (380 to 480 nm), which make up the final RGB image. Normally each pixel is coded using 24 bits, which implies 8 pixels per RGB plane, by which
it is possible to code 256 intensities per pixel in each plane [4].
K-NN CLASSIFICATION
K-NN Classification is dose an important task in process of object extraction. After extracting the features each object from the image is classified on the object based features. Classification and segmentation an closely related. But classification leads to segmentation, and vice versa. Classifying can be done by two ways
1). Supervised classification 2). Un-supervised classification
Supervised classification: Supervised classification does not require knowledge of any priori probability distribution functions and are based on reasoning and heuristics. Decision tree classification and K-NN classifications are examples of supervised classification techniques [2]. Un-supervised classification:
Un-supervised classification attempts to identify clusters or groupings in the feature space. Similarity based approach classification is one of the Un-supervised classification technique [7]. K-NN Classification (K-NN) is a technique for extracting the object. The process is followed by pattern recognition. K-NN is a nonparametric method. Based on the majority vote of its neighbors the objects are classified. For single nearest neighbor k=1,k is always positive.
This technique employs standardized Euclidean distance for classifying purpose or Euclidean distance used. Calculate the distance between the query data point and training dataset. The equation employed for calculating Euclidean distance is:
Standardized Euclidean distance:
© 2016, IRJET | Impact Factor value: 4.45 | ISO 9001:2008 Certified Journal
| Page 1172
COLOR CLASSIFICATION
This color classification of Newton is relevant even today. The color spectrum he had arrived at is parallel to the color spectrum of a rainbow. The light is radiant but a visible energy of electromagnetic wave motion, which moves through space at an incredible speed of 186,000 miles per second [1]. Like X-rays, or, radio signals it is transmitted through electric vibrations and magnetic fields, though, of course, at different frequencies. It moves in waves and the measure for lights wavelength is Amstrong Units (AU). Primary color
Red, Blue and Yellow are considered the primary colors because they are pure colors, which are beyond production by mixing other colors. Since we can arrive at any color by mixing these three colors in different proportions, these are rightly identified as primary colors.
Secondary Colors
[image:4.595.312.550.203.423.2]If we mix two primary colors in equal parts, we get the secondary colors viz., violet, green and orange. (violet = blue + red, green = blue + yellow, orange = yellow + red). Tertiary color: By mixing a primary color and a secondary color in equal proportion, we get tertiary colors.
Figure 2: classification of various color components
CONTOUR ANALYSIS
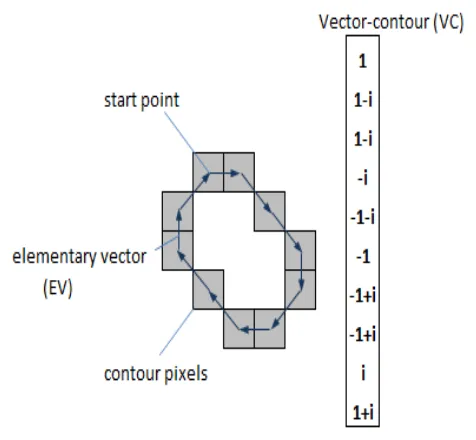
The contour is the boundary of an object. It is the population of points or pixels, separating object from the background. In a CA the contour is encoded by the sequence consisting of complex numbers. On a contour, the starting point is fixed.
[image:4.595.37.255.488.651.2]Then, the contour is scanned and each vector of offset is noted by a complex number a+ib. Where a - point offset on x axis, and b - offset on y axis. Offset is noted concerning the previous point of i. Owing to the physical nature of three- dimensional objects, their contours are always closed and cannot have self-intersection [11].
Figure 3: Contour Analysis diagram
Hence we can define unambiguously a way of bypass of a contour. The last vector of a contour always leads to the starting point. Each vector of a contour name elementary
vector (EV). And sequence of complex-valued numbers -
vector-contour (VC). Normalized scalar product (NSP) of a
contour can be defined as
Practical Application of the Contour Analysis
© 2016, IRJET | Impact Factor value: 4.45 | ISO 9001:2008 Certified Journal
| Page 1173
Among them - contour square, perimeter, the ratio ofquadrate of perimeter to squares. Thus, there is enough simple and effective mechanism of a preliminary filtration of parts of the image. The CA allows to process the image in a progressive mode. It means that we can sort contours on any to an indicators (for example, by square or on a gradient of boundaries, or on brightness, etc.)[10]. as contours are independent from each other algorithms of pattern recognition are easy to parallelize and simple. It can be executed on graphic processors C.
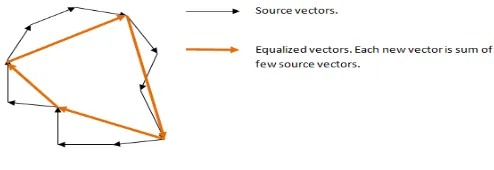
Equalization of Contours
[image:5.595.39.286.472.557.2]In the real image contours have arbitrary length. Therefore, for searching and comparing of contours, all of them should be led to uniform length. This process is called equalization. At first, we fix length of a VC which we will use in our system of a recognition. We designate it k. Then, for each initial contour A, to create a vector-contour N in length k. Further probably two variants - or the initial contour has greater number of an EV than k, or smaller number than k.
Figure 4: Sample contour analysis diagram
K-MEANS CLUSTERING
K-means is one of the simplest unsupervised learning algorithm that solve the well-known clustering problem. This clustering is convergent and its aim is to optimize the partitioning decisions based on a user-defined initial set of clustering that is updated after each iteration. This procedure is computationally efficient and can be applied to multidimensional data. K-means cluster is an iterative technique that is used to partition an image into clusters [5]. Clustering algorithm which is frequently used in image
processing. It follows a simple and easy way to classify a given data set through a certain number of clusters (assume
k-means clusters). Let be
attributes of n-dimensional vectors and be each data of A. The K-means
clustering separates X into k partitions called clusters
where M ∈ X is
as members of , where
is number of members for . Each cluster has cluster
center of .
METHODOLOGY
COLOR BASED IMAGE SEGMENTATION (CBIS)
Segmentation is subdividing an image into its constituent regions or object. The level up to which the subdivision is carried out depends on the problem being solved. While different ethnic groups have different levels of the melanin and pigmentation, the range of colors on is clearly a subspace of the total color space, assuming that a person framed is not having face with any unnatural color. There are many color based image segmentation algorithms but the proposed algorithm uses the more color spaces only namely, HIS, YCbCr and Lab. The bounding ranges calculated for the values of H, Y, Cb and Cr were used to generate the binary images.Color segmentation and pattern matching
© 2016, IRJET | Impact Factor value: 4.45 | ISO 9001:2008 Certified Journal
| Page 1174
positives. Nonetheless, there are many situations wherecolor segmentation can be directly used on natural scenes from the darkest to the lightest individual, can be easily tracked in HSI space, by constructing a model 2D histogram of the Hue (H) and saturation (S) (intensity (I) can be ignored) of skin tone in an image. Color images, however, provide an RGB color representation. For the above example, a conversion from RGB to HSI is required. There are other benefits of this conversion. The main advantage of the HSI representation stems from the observation that RGB vectors can be completely redirected under additive or multiplicative transformations. Hence, color recognition using RGB can fail under simple conditions such as turning on the light (assume a white source; colored sources manipulate the color components in a more profound way). HS components, however, are invariant under these transformations, and hence are more robust to variations in ambient intensity levels. Equation (1) shows how HSI components are derived from RGB.
Pattern Matching
The pattern matching is consists of a set of pattern elements, and it is continuously duplicated for a complete print pattern. If the distributions of pattern elements with identical color, shape, and orientation can be identified, the repeat patterns in a complete printed pattern can be obtained. To do that, first, set the color that covers the greatest measure of area on the polychromatic pattern image as the background color. Color categories with fore-ground colors, i.e. color categories of the pattern elements.
Figure 5: pattern matching based color image segmentation
(1) From the polychromatic pattern image, select the largest independent pattern element as the template.
(2) Conduct the similarity coefficient calculation for the template and the polychromatic pattern image.
(3) Using the threshold value, then locate the pattern element that is similar to the template image to derive the threshold points.
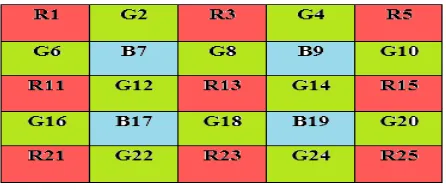
[image:6.595.311.534.239.334.2]Pattern Threshold Value
Figure 6: calculate the average RGB in subset region Set of gradients is determined by color value of 5x5 neighborhood pixel. Each gradient correspond to each difference direction. Threshold value is determined by each set of gradients. And this threshold value is used to select subset of gradients. Low gradient value indicates that pixels have similar color value. On the other hand, high gradient value in any image presents detail or edge. Subset of gradients is used to present region of the most similar pixel. Pixels in this region are used to determine average difference between measured actual color and lost color in central pixel. And then S, W, NE, SE also as subset of gradient variable names.
Table 1: Average color value in RGB
© 2016, IRJET | Impact Factor value: 4.45 | ISO 9001:2008 Certified Journal
| Page 1175
RESULT AND DISCUSSION
Data set
In order to check the performance of our color image segmentation approach, the benchmark image data sets has been used. The data sets are collected from various resources on the web page and store the data are spread in the image database and the different types of size of images and different images are collected from the color based image where all the images are in a different format as .gif, .jpg, .png, .trf.
Implementation Process
Image segmentation process is carried out and demonstrated using matlab tool is then implemented. The version of Matlab tool is 8.6(2015b) and corei3 processor, graphics card on nvidia and support for other system facilities as to use.
[image:7.595.314.579.385.612.2]Color classification using K-NN Rule
Figure 7: original color image (N-number of colors in the original image)
In this figure 7 is represented by the original image and its N-number of colors will be used on this image and then Nearest Neighbor Rule is applied for the original color image to split the individual color classification on an image.
Code for K-NN classifier
Figure 8: sample code for color classification on K-NN using Matlab
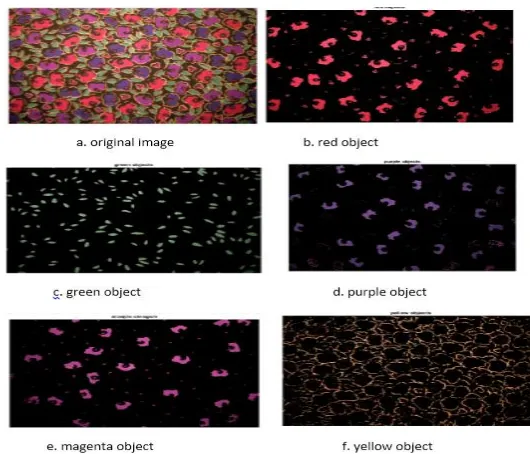
Figure 9: color image segmentation to segmentation of various color object
[image:7.595.39.281.501.684.2]© 2016, IRJET | Impact Factor value: 4.45 | ISO 9001:2008 Certified Journal
| Page 1176
used for K-NN classification. There are number colors in theoriginal image and it is classified each of the color in the original image of (a) based on K-NN method and different colors of image as (b) (c) (d) (e) (f) as given the images of figure 9.
[image:8.595.61.275.274.462.2]The nearest neighbor classification separate the different color populations by plotting the 'a*' and 'b*' values of pixels that were classified into separate colors. For display purposes, label each point with its color label is shown in the figure 10.
Figure 10: over all segmentation of pixel in the color image segmentation
Figure 11: sample code for overall pixel color segmentation
CONCLUSION
This paper proposes a color based image segmentation that uses K-means clustering technique. It is also discusses image
segmentation based on K-NN classification. Then supervised and unsupervised learning process is also applied. Color classification is also applied to the images. Contour Analysis and its application are deeply discussed. The benchmark image datasets are used to check the performance of color image segmentation approach and Matlab is used for implementation. Contour Analysis is used to segment the object and shapes into different region of the colors. The main here is to classify a particular image into a number of region or classes. And thus for each pixel in the image, we need to some decide or estimate which class it belongs to. The colors are classified using K-NN classification and further work will be implemented in the future.
REFERENCE
[1]. Qixiang Ye et al “Color Image Segmentation Using Density-Based Clustering” ICASSP IEEE 2003
[2]. K. Eranna et al “2-Dimentional Object Extraction by using Color feature and KNN Classification” International Journal of Engineering Research & Technology (IJERT) ISSN: 2278-0181 Vol. 3 Issue 10, October- 2014.
[3]. Angela Ribeiro et al “An Image Segmentation Based on a Genetic Algorithm for Determining Soil Coverage by Crop Residues” Sensors 2011 ISSN 1424-8220.
[4]. Mantas Paulinas et al “A Survey Of Genetic Algorithms Applications for Image enhancement And Segmentation” ISSN 1392 – 124x Information Technology And Control, 2007, Vol.36, No.3
[5]. Ms.Chinki Chandhok et al “ An Approach to Image Segmentation using K-means Clustering Algorithm” IJIT, Volume – 1, Issue – 1, August 2012 ISSN 2279 – 008X. [6]. Jitendra Malik et al “Contour and Texture Analysis for Image Segmentation” International Journal of Computer Vision 43(1), 7–27, 2001.
© 2016, IRJET | Impact Factor value: 4.45 | ISO 9001:2008 Certified Journal
| Page 1177
[8]. Jinping Fan et al “ Color Cell Image Segmentation Basedon Chan-Vese Model for Vector-Valued Images” Journal of Software Engineering and Applications, 2013, 6, 554-558. [9]. Nguyen Tran Lan Anh et al “color image segmentation using a morphological gradient-based active contour model” ICIC ISSN 1349-4198 PP 4471-4481 vol 9 No 11 Nov 2013. [10]. Rajivkumar Mente et al “Color Image Segmentation and Recognition based on Shape and Color Features” nternational Journal of Computer Science Engineering (IJCSE) 2012.
[11]. Kumary R Soumya et al “License Plate Detection and Character Recognition Using Contour Analysis” International Journal of Advanced Trends in Computer Science and Engineering ISSN 2278-3091 Volume 3, No.1, January – February 2014.
[12]. Vijay Jumb et al “Color Image Segmentation Using K-Means Clustering and Otsu’s Adaptive Thresholding” International Journal of Innovative Technology and Exploring Engineering (IJITEE) ISSN: 2278-3075, Volume-3, Issue-9, February 2014.
[13]. Poonam Panwar et al “Genetic Algorithms For Image Segmentation Using Active Contours” JGRCS Volume 4, No. 1, January 2013.
[14]. Mrs. Namrata et al “Augmented Reality Using Contour Analysis In E-Learning” International Journal of Innovative Research in Science, Engineering and Technology ISSN: 2319-8753Vol. 2, Issue 5, May 2013
[15]. Amanpreet Kaur Bhogal et al “Color image segmentation using k-means clustering algorithm” International Journal on Emerging Technologies 1(2): 18-20(2010) ISSN 0975-8364
BIOGRAPHIES
M.Ramaraj has received a Bachelor Degree in Computer Application at NGM College in 2011 and Master Degree in Computer at STC College from Bharathiar Univerrstiy Coimbatore in 2013. And Master of Computer Application (MCA) from School of Bharathiar University