© 2016, IRJET ISO 9001:2008 Certified Journal Page 646
Improving Voltage Profile in Distribution Systems using Custom Power
Devices (CPD)
K Swaroop Paul Kumar
1, M Mani Susanna
2, P Manjusha
3, N Suneel
4
---***---Abstract -
This paper reports Matlab Simulink test results obtained on different radial distribution systems with and without DVR. At the customer end, maintaining good voltage profile is prominent. Power quality problems decreases the efficiency of the distribution system and makes unhealthy relations between the customer and sending end. Power quality problems such as voltage sag and poor voltage profile are the important problems to control and mitigate so that user equipment works healthily. In this paper, custom power devices (CPD) are proposed for mitigating these power quality problems. Dynamic voltage restorer (DVR) and distribution static compensator (D-STATCOM) are the two examples custom power device that serves the purpose of voltage sag or swell mitigation. These devices which enhance the voltage stability in the system without effecting the normal operation of the system even at the fault conditions in the distribution system. In the sense, it maintains the quality of power by its deliberate action of operation with respective to the voltage sag or voltage swell and improve the voltage profile. DVR is accomplished with Vector control technique for its control for IEEE 11 bus 33 bus and 69 bus radial distribution system in this paper.Key Words: Custom power devices (CPD), Dynamic voltage restorer (DVR), vector control technique.
1. INTRODUCTION
With the increase of more sensitive and non-linear loads day by day, there is demand for the production. Along with the production and supply in the power system the power quality is the important aspect that is to be considered. Power quality is the term that can be defined as a set of electrical boundaries that can be considered or allowed for an equipment to function in its intended manner without significant loss of performance or life expectancy. Power quality problems like voltage sag, voltage swell, voltage fluctuations, etc., are frequent in the system [6]. For obtaining good power quality, power quality problems are to be controlled.
Here the custom power devices (CPD) are placed at the point of common coupling or also at the bus where there is lesser voltage than it is intended to be. In this
paper mitigating voltage sag and boosting the dropped voltage in to the buses by custom power devices (CPD) using vector control technique is modelled for IEEE 11 bus, 33 bus and 69 bus radial distribution system. Vector control technique is the simplest control technique. The proposed systems are modelled in MATLAB software and the results were discussed about the operation of custom power devices (CPD) for IEEE 11 bus, 33 bus and 69 bus radial distribution system that helped in improving the voltage profile in the system.
2. CUSTOM POWER DEVICES (CPD):
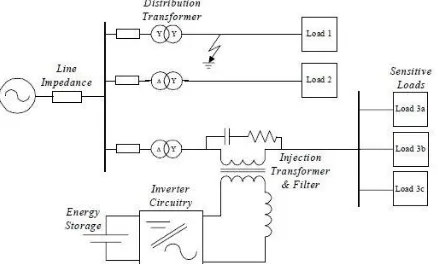
A DVR consists of a voltage source converter (VSC) [3]– [10]. A DVR is primarily for use at the distribution level. The basic principle is to inject a voltage in series with the line. DC power bank or a battery system and a booster or injection transformer connected along with the
distribution line in series so as to induce or compensates for the lower voltage on the distribution bus bar [9]. From the Fig.1, the operation of DVR mitigating the voltage sag is observed [3].
The Distribution Static Compensator (D-STATCOM) induces variable shunt compensation when there is voltage fluctuation in the system. An ideal application of D-STATCOM is to prevent disturbing loads from polluting the rest of the distribution system.
Fig 1: A Dynamic voltage restorer (DVR) connected to load
3. WORKING PRINCIPLE OF DVR:
[image:1.595.313.532.558.690.2]© 2016, IRJET ISO 9001:2008 Certified Journal Page 647 cases that occur when faults occur in the supply. The
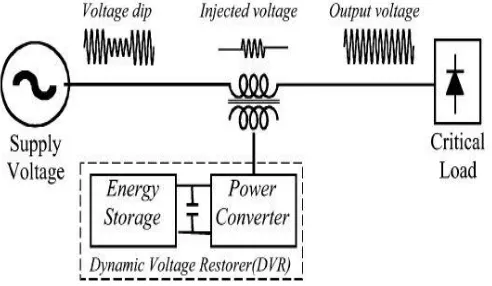
[image:2.595.39.285.215.358.2]supply voltage is VS and load voltage is VL, dynamically controlled voltage VDVR is generated by the converter which is in series with the line voltage. This is induced using the booster transformer. The hysteresis voltage control which operates and controls the VSC with the triggering pulses [7], [8].
Fig 2: Schematic diagram of DVR
4. OPERATING MODES OF A DVR:
DVR has three modes of operations. The operation modes are protection mode, standby mode and boost mode. In the case of protection mode, if there is an occurrence of fault which DVR cannot operate and with stand then DVR turns to protection with the isolation switch which is connected with the line. If there is no fault or voltage drop in the system then DVR start to act in the standby mode. At this moment VDVR is zero. The booster transformer does not inject voltage in to the line at this mode. As there is no sag condition in the line. Most of the time DVR will be in this standby mode only. In the boost mode, VDVR is greater than zero. When the drop in supply voltage is observed, DVR comes in to operation dynamically and boosts up the drop voltage in to the line [5].
5. VECTOR CONTROL TECHNIQUE:
Different voltage injection methods are associated with the operation of custom power devices (CPD) with the distribution system. Some of the methods are [2]-[4] Monitoring peak values of supply voltage, Phase locked-loop (PLL) for each phase, Monitoring of Vd in a vector controller, Fourier Transform, Wavelet Transformer method to each phase.
Fig.3 represents the Simulink model of control technique and generating of the triggering pulses that are used to operate and control the voltage source converter (VSC) [9]. The control technique that is
[image:2.595.330.546.390.467.2]system voltage with the injected voltage by the DVR. The control technique that is used is voltage vector control with decoupling approach. The custom power devices (CPD) have the ability of voltage sag/swell compensation to effectively protect sensitive loads at the customer end. This depends on the time required by the detection strategy along with the time required to inject the voltage. The detection scheme is an algorithm which extracts amplitude, phase and angle status data from point of common coupling or at the customer end voltages. The angle theta of the utility is observer by implementing three phase Phase-Locked Loop (PLL) method. This data is imported to an algorithm for detection and reference generation, as represented in Fig. 3. By comparing these voltages of reference with the system voltage the obtained command signal is generated using PWM technique and is used to trigger the VSC in order to generate the required compensating voltage that is to be induced in the system using the custom power devices (CPD).
Fig 3: Reference generation and detection model
6. TEST SYSTEM:
© 2016, IRJET ISO 9001:2008 Certified Journal Page 648 Fig.4. Schematic model of IEEE 11 Bus Radial
Distribution System
Fig.5. Schematic model of IEEE 33 Bus Radial Distribution System
Fig.6. Schematic model of IEEE 33 Bus Radial Distribution System
7. RESULTS:
Case-I: IEEE 11 Bus Radial Distribution System:
The Fig.7 gives the comparison of Voltage response of IEEE 11 Bus Radial Distribution System without and with the custom power devices (CPD). The number of buses i.e. Bus 1 to bus 11 are plotted in the x axis and the voltage values in per units (pu) are represented in another axis. The improvement in the voltage can be seen in Fig.7.
Fig.7.Comparision of Voltage response of IEEE 11
Bus Radial Distribution System without and with the custom power devices (CPD)
Case-II: IEEE 33 Bus Radial Distribution System:
© 2016, IRJET ISO 9001:2008 Certified Journal Page 649 Distribution System and IEEE-69 Bus Radial Distribution System using CPD:
IEEE 11Bus Radial Distribution System IEEE 33 Bus Radial Distribution
System IEEE 69 Bus Radial Distribution System
Bus
No. Normal Voltage With DSTATCOM With DVR Normal Voltage With DSTAT COM
With
DVR Normal Voltage With DSTATCOM With DVR
1 0.9095 0.9111 0.9185 0.9967 0.9969 0.9969 1 1 1
2 0.9025 0.9041 0.9114 0.9942 0.9944 0.9945 1 1 1
3 0.9024 0.9040 0.9113 0.9810 0.9812 0.9816 0.9999 0.9999 0.9999
4 0.9057 0.9073 0.9146 0.9724 0.9727 0.9728 0.9999 0.9999 0.9999
5 0.9055 0.9070 0.9144 0.9653 0.9655 0.9655 0.9993 0.9993 0.9997
6 0.9025 0.9040 0.9114 0.9492 0.9497 0.9497 0.995 0.9965 0.9959
7 0.9068 0.9084 0.9157 0.9172 1.0101 1.0118 0.9875 0.9875 0.9895
8 0.9041 0.9057 0.9130 0.9964 1.0051 1.0071 0.9861 0.9861 0.9891
9 0.8932 0.8948 0.9158 0.9599 0.9983 0.9983 0.9854 0.9854 0.9873
10 0.8925 0.8941 0.9151 0.9550 0.9933 0.9966 0.9804 0.9804 0.9884
11 0.9021 0.9037 0.9110 0.9543 0.9925 0.9955 0.9794 0.9794 0.9794
12 0.9540 0.9922 0.9946 0.9762 0.9762 0.9784
13 0.9490 0.9870 0.9895 0.9733 0.9733 0.9776
14 0.9471 0.9850 0.9876 0.9704 0.9704 0.9767
15 0.9457 0.9835 0.9875 0.9676 0.9676 0.9694
16 0.9447 0.9825 0.9845 0.9671 0.9671 0.9686
17 0.9436 0.9814 0.9854 0.9662 0.9662 0.9686
18 0.9433 0.9811 0.9841 0.9662 0.9662 0.9692
19 0.9805 0.9807 0.9837 0.9657 0.9657 0.9687
20 0.9770 0.9772 0.9752 0.9654 0.9654 0.9684
21 0.9763 0.9765 0.9765 0.965 0.965 0.9676
22 0.9757 0.9759 0.9749 0.965 0.965 0.9676
23 0.9702 0.9705 0.9725 0.9649 0.9649 0.9679
24 0.9664 0.9666 0.9648 0.9647 0.9647 0.9687
25 0.9633 0.9635 0.9658 0.9644 0.9644 0.9646
26 0.9472 0.9477 0.9477 0.9645 0.9645 0.9666
27 0.9453 0.9458 0.9458 0.9645 0.9645 0.9685
28 0.9377 0.9382 0.9375 0.9999 0.9999 0.9999
29 0.9323 0.9328 0.9386 0.9999 0.9999 0.9999
30 0.9295 0.9300 0.9345 0.9997 0.9997 0.9997
31 0.9243 0.9248 0.9248 0.9996 0.9996 0.9996
32 0.9231 0.9236 0.9247 0.9994 0.9994 0.9994
33 0.9221 0.9226 0.9256 0.9990 0.9990 0.9990
34 0.9990 0.9990 0.9990
35 0.9999 0.9999 0.9999
36 0.9998 0.9998 0.9998
37 0.9996 0.9996 0.9996
38 0.9996 0.9996 0.9996
39 0.9996 0.9996 0.9996
40 0.9996 0.9996 0.9996
41 0.9989 0.9989 0.9989
42 0.9986 0.9986 0.9986
43 0.9985 0.9985 0.9985
44 0.9985 0.9985 0.9985
45 0.9984 0.9984 0.9984
46 0.9984 0.9984 0.9984
47 0.9998 0.9998 0.9998
48 0.9986 0.9986 0.9986
49 0.9947 0.9947 0.9967
50 0.9942 0.9942 0.9972
51 0.9861 0.9861 0.9871
52 0.9861 0.9861 0.9861
53 0.9841 0.9841 0.9867
54 0.9826 0.9826 0.9848
55 0.9806 0.9806 0.9836
56 0.9787 0.9787 0.9787
57 0.9699 0.9699 0.9699
58 0.9656 0.9656 0.9656
© 2016, IRJET ISO 9001:2008 Certified Journal Page 650
60 0.9623 0.9623 0.9623
61 0.9593 0.9593 0.9593
62 0.9598 0.9598 0.9598
63 0.9606 0.9606 0.9626
64 0.9588 0.9588 0.9588
65 0.983 0.983 0.983
66 0.9793 0.9793 0.9793
67 0.9793 0.9793 0.9793
68 0.9759 0.9759 0.9770
69 0.9763 0.9801 0.9815
Table.1 Comparison of Voltage Profiles of both systems at each bus
Fig.8. Comparison of Voltage response of IEEE 33 Bus Radial Distribution System without and with the custom power devices (CPD)
Here the custom power devices (CPD) is placed at bus 9 for 11 bus system and at the bus 7 for 33 bus system in order to get good voltage profile in the corresponding buses.
Case-III: IEEE 69 Bus Radial Distribution System:
The Fig.9 gives the comparison of Voltage response of IEEE 69 Bus Radial Distribution System without and with the custom power devices (CPD). The number of buses i.e. Bus 1 to bus 69 are plotted in the x axis and the voltage values in per units (pu) are represented in another axis. The improvement in the voltage can be seen in Fig.9.
Fig.9. Comparison of Voltage response of IEEE 69 Bus RadialDistribution System without and with the custom power devices (CPD)
Hence it can be said as an optimal location for the placement of DVR in the system because by placing DVR better voltage profile at every bus in the concern system is obtained than placing the DVR at other bus locations. From the obtained results tabulated in the nextsection validates the above discussed statement.
8. CONCLUSION:
© 2016, IRJET ISO 9001:2008 Certified Journal Page 651 the objective of DVR compared to other conventional methods by dynamically inducing the required voltage. The following conclusions are drawn from the modeling of Without DVR with DVR system and their comparison of Voltage values. From the results obtained and from the tabulated values of voltage profile at each bus for the three cases (11 bus, 33 bus and 69 bus) in table.1 it can be concluded that by placing DVR at optimum location, significant improvement in voltage profile can be achieved. Introducing DVR improves voltage profile and reduces voltage sag. The above tables for the practical values of IEEE 11-bus, 33-bus and 69 bus proved this statement.
9. REFERENCES:
[1] Benachaiba Chellali, FERDI Brahim, “Voltage Quality Improvement Using DVR,” Electrical Power Quality and Utilizations, Journal Vol. XIV, No. 1, 2008
[2] C. Fitzer, M. Barnes and P. Green, “Voltage Sag Detection Technique for a Dynamic Voltage Restorer”, IEEE Trans. Industry Applications Vol. 40(1), Jan. 2004, pp. 203 - 212.
[3] Arindam Ghosh, Avinash Joshi “Design of a Capacitor-Supported Dynamic Voltage Restorer (DVR) for Unbalanced and Distorted Loads” IEEE Transactions on Power Delivery, Vol. 19, No. 1, January 2004. [4] Fawzi AL Jowder “Modeling and Simulation of Dynamic Voltage Restorer (DVR) Based on Hysteresis Voltage
Control” The 33rd Annual Conference of the IEEE Industrial Electronics Society (IECON) Nov. 5-8, 2007. [5] N.H Woodley, A. Sundaram, B. Coulter, and D. Mom's, "Dynamic Voltage Restorer Demonstration Project
Experience," presented at the Proc.12th Conf. Elect. Power Supply Ind., Pattaya, Thailand, 1998.
[6] John Godsk Nielsen, Frede Blaabjerg and Ned Mohan," Control Strategies for Dynamic Voltage Restorer Compensating Voltage Sags with Phase Jump."in Proc. IEEE 16th AppI. Power Electron. Conf. Expo., Anaheim, C.A, 2001,pp. 1267-1273.
[7] Anindam Ghosh, Amit Kumar Jindal and Avinash Joshi. "Design of a Capacitor-Supported Dynamic Voltage Restorer (DVR) for Unbalanced and Distorted Loads," IEEE Trans. Power Delivery, vol. 19, No.1 pp. 405-413, January 2004.
[8] Poh Chiang, D Mahinda Vilathgamuwa, Seng Khai Tang and Hian Lih Long, "Multilevel Dynamic Voltage Restorer," IEEE Trans. Power Electronics Letters, vol. 2, No.4 pp. 125-130, December 2004.
[9]D. D Solin, T. E. Grebe, M. F. Granaghan and A. Sundarm," Statistical Analysis of Voltage DIP's and Interruption-Final results from the EPRI distribution system power quality monitoring survey.," in Proc. CIRED'99,ch.2 1999.
[10]Chnis Fitzer, Mike Barns and Peter Green, "Voltage Sag Detection Technique for a Dynamic Voltage Restorer," IEEE Trans. Power Delivery, vol. 40, No.1 pp. 203-212, January/February 2004.
[11]IEEE recommended practices and requirements for harmonic control in electrical power systems, IEEE Standard 519-1992, 1002.1730
[12]Krischonme Bhumkittipich and Nadarajah Mithulananthan, “Performance enhancement of DVR for mitigating voltage sag/swell using vectorcontrolstrategy”,www.sciencedirect.com, Energy Procedia 9 ( 2011 ) 366 – 379 379 Energy Procedia 9 ( 2011 ) 366 – 379 379
[13]D. M. Vilathgamuwa, A.A.D.R. Perera, and S.S.Choi, “Performance improvement of the dynamic voltage restorer withclosed-loop load voltage and current-mode control,” IEEE Trans. On Power Electronics, vol.17, np.5, pp. 824-834, Sept.2002.
[14]I. Etxeberria-Otadui, U. Viscarret, S. Bacha, M. Caballero, and R. Reyero, “Evaluation of different strategies for series voltage sag compensation,” Conf. Rec IEEE PESC 2002, pp. 1797-1802.
[15]A. Ghosh, and A. Joshi, “A new algorithm for the generation of reference voltage of a DVR using the method of instantaneous sysmmetrical components,” IEEE Power Engineering Review, vol. 22, no.1, pp. 63-65, Jan. 2002.
[16] Liu, J. W., Choi,S. S., & Chen, S. “Design of step dynamic voltage regulator for power quality enhancement,” IEEE Transactions on Power Delivery, vol. 18, no.4, pp. 1403 – 1409, 2002.
[17]Nielsen, J.G.; Blaabjerg, F.; Mohan,; N., “Control strategies for dynamic voltage restorer compensating voltage sags with phase jump,” Applied Power Electronics Conference and Exposition, 2001. APEC 2001. Sixteenth Annual IEEE, vol.2, pp. 1267 - 1273, 4-8 March 2001
© 2016, IRJET ISO 9001:2008 Certified Journal Page 652 [19]Awad,H., Svensson,J., & Bollen, M. H. “Static series compensator for voltage dips mitigation,” IEEE Bologna
PowerTech Conf, Bologna, 2003.
[20]S. M. Silva, L.N. Arruda and B. de J. Cardoso Filho, “Wide bandwidth single and three-phase PLL structure for utility connected systemd”, 9th European conference on power electronics and applications. EPE2001. Graz, Austria. August 2001.
[21]G. Hsieh, and J.C. Hung, “Phase-looked Loop techniques –a survey”, IEEE Trans. On Industrial Electronics, vol. 43, no. 6, pp.609-915. 1996.
[22]Ghosh,A.,Jindal,A.K., & Joshi,A. “Inverter control using output feedback for power compensating devices,” TENCON 2003. Conference on Convergent Technologies for Asia-Pacific Region, pp.48 – 52, 2003.