© 2016, IRJET | Impact Factor value: 4.45 | ISO 9001:2008 Certified Journal | Page 2973
Improving Process Capability Through Inline Measurement In
Automobile Industry: Case Study
Ganesh M Kalkutaki
1, M.R.Nagre
21
M.Tech Student Veermata Jijabai Techonological institute, Mumbai, Maharashtra
2Associate professor Veermata Jijabai Techonological institute, Mumbai, Maharashtra
---***---Abstract -
Process capability and measurement is thebuilding block to any organisation for ensuring the quality on which the customer thrives and establishing a good relationship between a manufacturer and a customer. Improvement of a process is a long term task which includes problem definition, source of the problem, root causes both primary and secondary as well what suggestion can be provided in order to improve the process.
This desertion includes process optimization on various stations in the bodyshop through the constant monitoring of data through various software, This article presents the overview of use of process capability indices along related to improving the quality of certain processes with a case study of an automobile industry. A variety of quality tools including flowcharts, cause and effects diagrams, control charts, process capability indices and experimental design are illustrated throughout the manuscript
Key Words: Process, Optimization, Process capability, Quality, Process capability indices
1.INTRODUCTION
The multiple quality characteristics with varied tolerance limits challenges for producing good quality end products. It is said that good quality product is a result of a capable process. The software being employed by the company was capable enough to cope with all problems provided to it regarding the quality of the product coming out of it after measurement since each and every car body had to undergo a scrutiny of points at two different stages to conclude the car stands worth the company quality standards or whether it is fit and safe enough to delivered to the customers. The main purpose of our work was process quality where in we had a constant monitoring on each and every process along with maintaining and improving the process capability of the different section of a body frame. Variation is part of life. The concept of variation states that no two products will be perfectly identical even if extreme care is taken to make them identical in some aspect.
For calculating process capability and maintaining the data we used two software namely X and Z. Z is one type of software used for calibration and measurement of deviation
from master piece in the form of control chart, X is used for storing the data and assessing the information of each part. Z software measure PMP’s and FMK’s
PMP’s: These are single point on car body or underbody Which used for fitment of the parts.
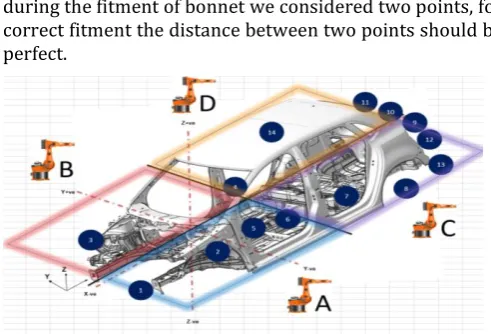
[image:1.595.307.553.341.508.2]FMK’s: These are specified between the two points that means it gives the distance between two points. For e.g. during the fitment of bonnet we considered two points, for correct fitment the distance between two points should be perfect.
Figure 1 Inline Measurement station with robot placements Inline station is the place where 4 robots namely A,B,C,D use the technology of image processing to measure the deviations in the car body or underbody by comparing the actual values of a particular points or distances with the nominal value fed in the software named ‘Z’ in form of a CAD model and difference is reflected in the form deviation which are represented on the control charts with the basics statistics such as the Cp, Cpk, sigma value, actual deviation of a particular car maximum and minimum values over a span of production and the range of deviations.
2. Literature Review
© 2016, IRJET | Impact Factor value: 4.45 | ISO 9001:2008 Certified Journal | Page 2974 process capability study helps in designing the product,
deciding the acceptance norms, process and operators selections in the operations management. Juran J.M, (1991) [3] The evaluation of process capability is an important step in process quality improvement. There is considerable theoretical and experimental research work on improving product quality and process efficiency using a process-capability analysis. Kane,VE [4] described six areas of application for capability indices: the prevention of the production of nonconforming products, the continuous measure of improvement, communication, prioritization, the identification of directions for improvement, and the auditing of the quality system . It is to take the six sigma prime spread in the distribution of the product quality characteristic as a measure of process capability. In process capability study of particular process, six sigma prime spread is compared with the difference of Upper Specification Limit (USL) and the Lower Specification Limit (LSL).
The following are the three possible cases.
1. 6s ` > (USL – LSL): In this case, the process spread is greater than the tolerance. So the
Process is incapable of meeting the specification.
2. 6s `= (USL – LSL): In this case, the process spread is exactly equal to the tolerance. So
The process is exactly capable of meeting the specifications.
3. 6s ` < (USL – LSL): In this case, the process spread is less than the tolerance. So the process is capable of meeting the specifications.
It is frequently convenient way to have a simple, quantitative way to express process capability. One way to do so is through process capability indices. Chen et al 2001 [5] Process capability indices (PCI) are powerful means of studying the process ability for manufacturing a product that meets specifications. PCI is defined as the ratio of tolerances to the process spread. If the PCI is greater than or equal to one, then the process is capable of meeting the specification limits. If the PCI is less than one, then the process is incapable of meeting the specification limits.
[image:2.595.322.552.121.215.2]Edwin R. Van den Heuvel and Roxana Ion 2003 [6] There exists no standard calculation for process capability in the case of non-normal data. We have used normal distribution functions to illustrate the adaptiveness of their capability indices in relation to standard capability indices.
Table -1: Quantifying equations for process capability
Index Estimated Equation Usage
Cp (USL-LSL)/6ε Process capability for two sided specification limit, irrespective of process center.
Cpk Min{(USL-mean)/3ε
,(mean-LSL)/3ε } Process capability for two sided specification limits accounting for process centering
Note. Adapted From” Improving the Process Capability of a
Boring Operation by the Application of Statistical Techniques”, by Parvesh Kumar Rajvanshi, Dr. R.M.Belokar, 2012, International Journal of Scientific & Engineering Research Volume 3, Issue 5.
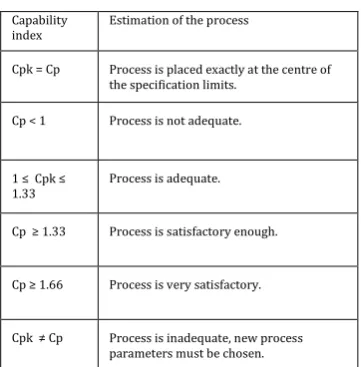
Table -2: Process Estimation
Capability
index Estimation of the process
Cpk = Cp Process is placed exactly at the centre of the specification limits.
Cp < 1 Process is not adequate.
1 ≤ Cpk ≤
1.33 Process is adequate.
Cp ≥ 1.33 Process is satisfactory enough.
Cp ≥ 1.66 Process is very satisfactory.
Cpk ≠ Cp Process is inadequate, new process parameters must be chosen.
Note. Adapted From” Improving the Process Capability of a
Boring Operation by the Application of Statistical Techniques”, by Parvesh Kumar Rajvanshi, Dr. R.M.Belokar, 2012, International Journal of Scientific & Engineering Research Volume 3, Issue 5.
[image:2.595.344.525.303.487.2]© 2016, IRJET | Impact Factor value: 4.45 | ISO 9001:2008 Certified Journal | Page 2975
3.
Case Study
Problem Definition:
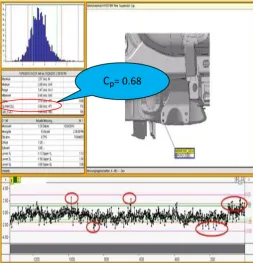
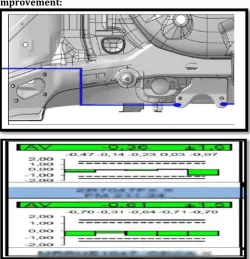
[image:3.595.308.559.109.348.2]Deviation in the form of offshoots was occurring in inline measurement report at Rear wheel housing fuel filter bracket in ‘X’ direction and also in CMM report one point deviated in red zone. The value of Cp which is to be below the company standards that is 0.80. Hence the problem was taken into consideration and work on its improvement has been mentioned in the manuscript.
Figure 1: fuel filter bracket inline report before improvement
Figure 1 shows Fuel filter bracket inline report which shows offshoots and various ups and downs in process and the process capability value is less than 0.8. For this purpose we take it for improvisation.
B. CMM report for corresponding point before improvement:
Figure 1 and 2 respectively shows inline measurement and coordinate measuring machine (CMM) report for fuel filter bracket. Inline measurement is a robotic station which measures the point with the help of camera. In bodyshop three inline station are Underbody, car body and offline. In these stations four robots are mounted with camera, camera capture the image. These robots are connected to software which convert captured image into control chart. From this we can catch deviations of each and every point on the car body.
Figure 2: fuel filter bracket CMM report before improvement
In CMM touch probe sensors are used for measurement and as compare to inline CMM measure more points on car body so it required lot of time for measurement, due to this only some parts are measured. According to weekly plan these parts were measured.
C. Probable Cause:
Fixture not ok.
Improper handling of the weld gun by Team
member.
Clamp cylinder pressure not ok.
Robot didn’t measure the point correctly.
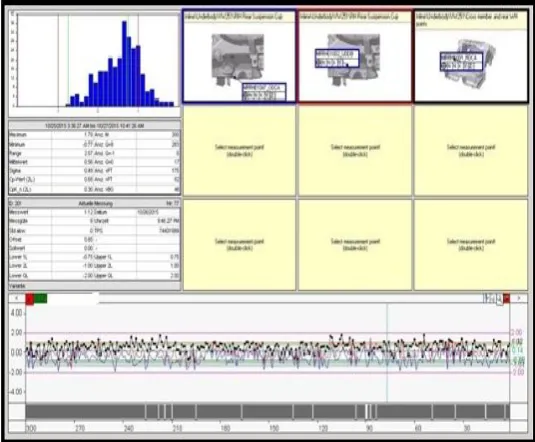
[image:3.595.38.292.255.519.2]D. Preliminary Analysis:
Figure 3: comparison of three points on rear wheel housing for ‘X’ direction before improvement
Figure 3 shows comparison of three points on rear wheel housing for X direction. X software have analysis tool which compare more than one points. We took three points on rear
[image:3.595.310.569.548.716.2]© 2016, IRJET | Impact Factor value: 4.45 | ISO 9001:2008 Certified Journal | Page 2976 wheel housing which can be measured by the robots. We
have problem in X directions for fuel filter bracket which shown by blue colour in figure 3, similarly another point on fuel filter bracket which shown by red colour in figure 3.And third point is taken on rear wheel housing which shown by black colour in figure 3. Fuel filter bracket is assembled at different station and all other rear housing component assembled at different station, so we have to find out on which station problem is occurring.
At station 2810 rear wheel housing assembled to underbody, and at station 2235 RH only fuel filter bracket assembled to it so we have to find out whether problem is at station 2810 or station 2235 RH , For that purpose we made comparison between three points. If for three points ups and downs are in similar fashion then there will be no problem at station 2235 RH but in our case that won’t happened. In figure 3 the blue curve is not going in similar fashion that as red and black is going (for certain offshoots)
From the analysis we made conclusion that there
will be no problem on station 2810.
That means Problem occurring at station 2235 RH
E. Preliminary Analysis for station 2235 RH:
Fixture condition checked and found to be not ok.
Bracket fixture loose, it can be easily movable by
hand in X direction.
After clamping there was 2 to 3mm gap between
bracket and rear wheel housing.
Clamping sequence found OK for stations
Clamp cylinder pressure checked and found to be
ok.
On station 2235 RH proper clamping is done but
spot plan is not followed by Team member.
F. Standard Procedure for station 2235 RH:
Walk to the operating panel and press two hand push button for locating pins.
Pick up the rear wheel housing assembly and load it
on the fixture.
Pick up the fuel filler neck support and load on the
fixture.
Clamp it manually.
Walk to the operating panel and press two hand push button for clamping
Pick the gun and do spot welding as per plan.
Walk to the operating panel and press two hand push button for declamping
Finally place in trolley
G. Permanent Action:
Concern with pilot hall and made correction in the
fixture.
Instructions given to the operator regarding proper
execution of standard work process.
Make sure that there should be full contact between
bracket and Rear wheel housing.
4. Results and discussion
[image:4.595.308.579.158.444.2]Process capability after improvement: Cp=0.87
Figure 5Fuel filter bracket inline report after improvement
[image:4.595.310.578.473.694.2]© 2016, IRJET | Impact Factor value: 4.45 | ISO 9001:2008 Certified Journal | Page 2977
[image:5.595.39.290.115.375.2]CMM Report in X direction for corresponding point after improvement:
Figure 7: fuel filter bracket CMM report after improvement
Figure 5 shows results after improvement of inline measurement report for fuel filter bracket. Inline report shows removing the offshoots of points and also quite stable process occurring, also process capability is improved from 0.68 to 0.87. Figure 6 shows three points on rear wheel housing which ups and downs in similar fashion its means that whatever problem is occurring at station 2235 RH is removed. Figure 7 shows the cmm report after improvement, in this all the points to be occurred in Green zone that means in safe zone.
5. Conclusion
Henceforth, the case study in the automobile industry based on process capability has come to a conclusion. In this case study we selected the bodyshop production wherein the main area of analysis was the measurement department. The focus then switched on to the Quality of the product which was calculated based on the trend reports also known as the control charts generated by the measurement departments through its robotic station which are installed in 3 areas Underbody, Carbody and Off-line station. The process capability became main driving parameter which was to increased as the desired output. Finding the root causes of the different parts in the automobile in different areas was the daily routine which included in depth one to one conformation and discussions with the operators and their leaders and guidance from the senior authorities for the approval and in the end the change in the value of Cp before and after the correction suggested is the pivotal point of the entire case study.
This case study not only lets us understands the basic concepts related to the statistical analysis and quality control but also teaches us how it can be implemented over a large scale to see the magnified effects in an automobile industry. Such concepts can also be applied in any industry which is a six sigma organisation who are willing to succeed in the ever-growing competitive market.
REFERENCES
[1] English, J.R and Taylor G.D., (1993), “Process capability analysis: a robustness study”, International Journal of Production Research, Vol. 31, pp.1621-1635.
[2] Feigenbaum A.V, (1994), “Quality education and America’s competitiveness”, Quality progress, 27, 9, P83-84.
[3] Juran J.M, (1991), “Strategies for world class quality”, Quality progress 24, 2, P81-85.
[4] Kane,VE. Process capability indices. Journal of Quality
Technology18 (1986), 41–52.
[5] Chen, K.S. Huang, M.L. and Li, R.K (2001), “Process capability analysis for an entire product”, International Journal of Production Research, Vol. 39, No. 17, pp. 4077-4087.
[6] Edwin R. Van den Heuvel, and Roxana A Ion, (2003), “Capability Indices and the proportion of nonconforming items”, Quality Engineering, Vol 15, No 3, pp 427-439.
[7] Mc Cormack, Iar R Harris, Arnon M Hurwitz, Patrick D Spagon, (2000), “Capability Indices for non normal data”, Quality Engineering, Vol 12, No 4, pp 489-495.
[8] Jaju S B, Lakhe. R R & Gupta.B.M, (April 2002) “Process Capability Study of Bought OutComponents for Tractor Manufacturing Industry”, Industrial Engineering Journal, Vol 31, No 4, pp 13-18.
[9] Karl Majestic and Richard Andrews, (2002-2003), “Evaluating Measurement System and Manufacturing Process using Three Quality Measures”, Quality Engineering, Vol 15, No. 2 , pp 243-251.