Identification of Hodgkin and Reed-Sternberg
cell-specific genes by gene expression profiling
Ralf Küppers, … , Martin-Leo Hansmann, Riccardo
Dalla-Favera
J Clin Invest.
2003;
111(4)
:529-537.
https://doi.org/10.1172/JCI16624
.
Hodgkin lymphoma (HL) is a malignancy of unknown pathogenesis. The malignant Hodgkin
and Reed/Sternberg (HRS) cells derive from germinal center B cells (or rarely, T cells) but
have a heterogeneous and largely uncharacterized phenotype. Using microarrays, we
compared the gene expression profile of four HL cell lines with profiles of the main B cell
subsets and B cell non-HLs to find out whether HRS cells, despite their described
heterogeneity, show a distinct gene expression, to study their relationship to other normal
and malignant B cells, and to identify genes aberrantly or overexpressed by HRS cells. The
HL lines indeed clustered as a distinct entity, irrespective of their B or T cell derivation, and
their gene expression was most similar to that of EBV-transformed B cells and cell lines
derived from diffuse large cell lymphomas showing features of in vitro–activated B cells.
Twenty-seven genes, most of which were previously unknown to be expressed by HRS
cells, showed aberrant expression specifically in these cells, e.g., the transcription factors
GATA-3
,
ABF1
,
EAR3
, and
Nrf3
. For five genes, expression in primary HRS cells was
confirmed. The newly identified HL-specific genes may play important roles in the
pathogenesis of HL, potentially represent novel diagnostic markers, and can be considered
for therapeutic targeting.
Article
Oncology
Find the latest version:
Introduction
The hallmark of Hodgkin lymphoma (HL) is the presence of large, mononucleated Hodgkin and multinucleated Reed/Sternberg cells. These cells represent the tumor cells, but usually comprise less than 1% of the cellular infiltrate in the lymphoma tissue (1). Due to the rarity of the Hodgkin and Reed/Sternberg (HRS) cells and their unusual phenotype, the origin of these cells from germi-nal center (GC) B cells in both the lymphocyte predomi-nant (LP) and the classical subtype of HL could be clari-fied only recently (reviewed in ref. 2). Only in very rare cases, HRS cells of classical HL represent transformed T
cells (3, 4). In classical HL, which accounts for 95% of the cases, the pattern of somatic mutations in the rearranged Ig genes suggests that the cells derive from GC B cells that normally would have undergone apoptosis as they acquired unfavorable somatic mutations (5, 6).
Despite their GC B cell origin, HRS cells have lost expression of many B cell markers (reviewed in ref. 2). Moreover, expression of markers typical for other hematopoietic lineages is often observed, such as the myelocytic antigen CD15, the cytotoxic T cell/NK cell marker granzyme B, and the dendritic cell–specific chemokine TARC (7–10). Thus, the phenotype of HRS cells in classical HL does not resemble any nor-mal cell type in the body.
Besides these and some other reports on selected mark-ers expressed by HRS cells, there is so far no systematic large scale analysis of genes specifically expressed by these cells. A large number of expressed sequence tags was sequenced in a study from HL lines and single HRS cells (11). However, the collection of cells used to generate the expressed sequence tag profile represented a mixture of HRS cells from the classical and LP type of HL, which dif-fer in many aspects (12). Moreover, since only GC B cells were used to analyze differential gene expression, this study was not well suited to identify genes specifically expressed by HRS cells of classical HL in comparison with other normal and malignant B cell populations.
Identification of Hodgkin and Reed-Sternberg cell-specific
genes by gene expression profiling
Ralf Küppers,
1,2Ulf Klein,
3Ines Schwering,
1,2Verena Distler,
1,4Andreas Bräuninger,
4Giorgio Cattoretti,
3Yuhai Tu,
5Gustavo A. Stolovitzky,
5Andrea Califano,
6Martin-Leo Hansmann,
4and Riccardo Dalla-Favera
31Institute for Genetics, and
2Department of Internal Medicine I, University of Cologne, Cologne, Germany 3Institute for Cancer Genetics, Columbia University, New York, New York, USA 4Department of Pathology, University of Frankfurt, Frankfurt/Main, Germany 5IBM T.J. Watson Research Center, Yorktown Heights, New York, New York, USA 6First Genetic Trust Inc., Lyndhurst, New Jersey, USA
Hodgkin lymphoma (HL) is a malignancy of unknown pathogenesis. The malignant Hodgkin and Reed/Sternberg (HRS) cells derive from germinal center B cells (or rarely, T cells) but have a hetero-geneous and largely uncharacterized phenotype. Using microarrays, we compared the gene expres-sion profile of four HL cell lines with profiles of the main B cell subsets and B cell non-HLs to find out whether HRS cells, despite their described heterogeneity, show a distinct gene expression, to study their relationship to other normal and malignant B cells, and to identify genes aberrantly or overex-pressed by HRS cells. The HL lines indeed clustered as a distinct entity, irrespective of their B or T cell derivation, and their gene expression was most similar to that of EBV-transformed B cells and cell lines derived from diffuse large cell lymphomas showing features of in vitro–activated B cells. Twen-ty-seven genes, most of which were previously unknown to be expressed by HRS cells, showed aber-rant expression specifically in these cells, e.g., the transcription factors GATA-3, ABF1, EAR3, and Nrf3. For five genes, expression in primary HRS cells was confirmed. The newly identified HL-specific genes may play important roles in the pathogenesis of HL, potentially represent novel diagnostic markers, and can be considered for therapeutic targeting.
J. Clin. Invest.111:529–537 (2003). doi:10.1172/JCI200316624.
Received for publication August 9, 2002, and accepted in revised form December 17, 2002.
Address correspondence to:Ralf Küppers, University of Cologne, Department of Internal Medicine I, LFI E4 R706, Joseph-Stelzmannstrasse 9, D-50931 Cologne, Germany. Phone: 49 221 478 4490; Fax: 49 221 478 6383; E-mail: ralf.kuppers@uni-koeln.de.
Ralf Küppers, Ulf Klein, and Ines Schwering contributed equally to this work.
Conflict of interest:The authors have declared that no conflict of interest exists.
Based on the GC B cell origin of HRS cells in most cases, it is reasonable to perform the analysis of differ-ential gene expression between these cells and normal mature B cells as well as other types of B cell non-Hodgkin lymphomas (B-NHLs). Since it is not yet technically feasible to create large-scale gene expres-sion profiles from the rare primary HRS cells, we gen-erated the gene expression profiles (approximately 9,000 genes) of a number of HL-derived cell lines and compared them with the main subsets of normal mature B cells and various types of B-NHLs. Expres-sion of several markers identified in the analysis was confirmed in HL cell lines at the protein level and in primary HRS cells by RT-PCR. With the analysis, we wanted to address three main questions: (a) Given the reported phenotypic heterogeneity of HRS cells, do the gene expression profiles define HRS cells as a distinct entity? (b) To which other normal or malignant B cells are HRS cells most closely related in terms of gene expression? (c) Can we identify HRS cell–specific genes? With this last aspect, we aimed to identify genes involved in the pathogenesis of HL and genes that may represent potential diagnostic or therapeutic markers.
Methods
Cell lines and culture conditions.The HL cell lines used orig-inate from patients with HL of the nodular sclerosis (L428 and HDLM2) or mixed cellularity subtype (KMH2 and L1236). HDLM2 is of T cell origin, and the three other HL cell lines are of B cell origin, as shown by South-ern blot analysis of antigen-receptor gene rearrangements (13–15). All cell lines were grown in RPMI-1640 with Glu-tamax-1 (Invitrogen, Karlsruhe, Germany), supplement-ed with 10% FCS and 100 U/ml penicillin/streptomycin at 37°C in an atmosphere containing 5% CO2.
Purification of primary cells.The isolation of the pri-mary cells used in this analysis has been described in detail elsewhere (16). Briefly, normal B cell subsets were isolated by magnetic cell separation using the MACS system (Miltenyi Biotech, Bergisch Gladbach, Ger-many) according to the following marker expression: naive B cells (CD27–, CD10–, CD3–, CD38low, CD14–,
IgD+), centroblasts (CD77+, CD38high), centrocytes
(CD77–, CD38high, CD39–, CD3–, CD10+), and memory
B cells (CD10–, CD3–, CD38low, CD14–, CD27+).
Because gene expression profiles for CD77+GC B cells
and CD77–GC B cells showed surprisingly few
differ-ences (17), these cell populations were collectively des-ignated GC B cells. An explanation for the few differ-ences may be that CD77 staining does not completely distinguish between these two cell populations, although it is commonly used as a centroblast marker.
Generation of cRNA and microarray hybridization.
Microarray hybridization was performed as described (16), starting from 5 µg of purified total RNA and hybridizing each 15-µg biotin-labeled cRNA to U95A microarrays (Affymetrix Inc., High Wycombe, United Kingdom). After scanning, the expression values for the genes were determined using Affymetrix Microarray
Suite 4.0 software and its Global Scaling option. The expression data (average differences) were processed as follows: small and negative expression levels were clipped-off to be equal to a cutoff value arbitrarily cho-sen as 20. The logarithm of this clipped-off data was subsequently used throughout the analyses.
Biostatistical analysis.The hierarchical clustering algo-rithm used to generate the dendrogram is based on the average-linkage method (18). To construct the dendro-gram, a subset of genes on the microarray was used, whose expression levels vary the most among the 23 samples and thus are most informative (see ref. 16). The expression values of each selected gene is normal-ized to have zero mean and unit SD. The distance between two individual samples is calculated by Pear-son distance with the normalized expression values.
For supervised hierarchical clustering, we used the Genes@Work software platform, which is a gene expression analysis tool based on the pattern discovery algorithm SPLASH (structural pattern localization analysis by sequential histograms) (19). For details, see ref. 16. The primary data are available through http://ICG.cpmc.columbia.edu/faculty.htm.
Western blotting. Immunoblotting was performed using standard methods. The amount of protein was quantified using the DcProtein Assay (Bio-Rad
Labo-ratories, Munich, Germany). The following Ab’s were used: Neogenin, sc-6536; Gas1, sc-9585; anti-GATA-3, sc-268 (all from Santa Cruz Biotechnology Inc., Santa Cruz, California, USA); ABF1 anti-serum (a kind gift of C. Murre).
Flow cytometry.Cells were incubated with anti–IL-1R2 Ab (HyCult Biotechnology BV, Uden, the Netherlands), followed by staining with FITC-coupled anti-mouse Ab’s and analyzed on a FACSCalibur (Becton Dickinson Biosources, Franklin Lakes, New Jersey, USA).
Characteristics of cases used for RT-PCR analysis of microdis-sected HRS cells.Lymph nodes of seven classical and two LP HL patients were analyzed. The biopsy from patient 4 was obtained at relapse; the lymph nodes of the other classical HL patients were from first presentation (no information is available for the two other patients).
Staining of frozen sections and microdissection. Five-microm-eter-thick frozen sections were mounted on membrane-covered slides and incubated with hematoxylin contain-ing RNase inhibitor (200 U/ml; Roche, Mannheim, Germany) for 4 min. Sections were washed in diethylpy-rocarbonate-treated water for 2 min, incubated in 2% eosin for 15 s, washed again, and then dried at 37°C for 3 h. HRS and non-HRS cells were catapulted into 20 µl of Purescript lysis buffer (Biozym, Hamburg, Germany) using an UV-laser beam (PALM, Bernried, Germany) (20) and pooled in groups of 25 or 50 cells.
performed because of the existence of processed
pseudogenes. Isolated RNA and 0.6 µM of
gene-spe-cific reverse primer (PRAMEreva, 5′-AGG GCA AGG AGC TGA TCA TCC G-3′; IPLUTRrev, 5′-CTA GCC TCGG TCC GAC TCG TCC-3′; rab13rev, 5′-CTC ATC CGT GAT GTC GTA TAC TAG G-3′; EAR3rev,5′-TGG ATT GGG CTG GGT TGG AGG C-3′; FERrev, 5′-CGG ACA AAC CCC TAA GCT GAA GG-3′) were heat denatured at 70°C for 10 min. T4 gene 32 protein (Ambion Inc., Austin, Texas, USA) was added at a concentration of 1.5 µg per sample dur-ing the initial denaturation. Reverse transcription was performed using the OneStep RT-PCR Kit compo-nents (QIAGEN Inc., Hilden, Germany), including 10 U of RNase inhibitor. The reaction mixture was pre-heated to 50°C for 2 min, after which 2 µl of QIAGEN OneStep RT-PCR enzyme mix was added. The cDNA synthesis was performed at 50°C for 30 min.
PCR amplification of cDNA products. One round of PCR was performed applying the reverse primers used for cDNA synthesis and the corresponding forward primers (PRAMEfor, 5′-GCA GTA TAT CGC CCA GTT CAC C-3′;
IPLfor, 5′-GAG CCC TCG GAG CCC TCC AGG-3′; rab13fora, 5′-GTC TGA TCA TTC GCT TTG CAG AGG-3′; EAR3fora, 5′ -CCA ATT CAC CTG CGA GGG CTG C-3′; FERfora, 5′-GCT GCA AGA AAC TGC CTG GTA GG-3′). All primer pairs were intron-spanning. For amplification of a 352-bp product of the PRAMEgene, samples were adjusted to 50-µl
reac-tion mixes supplemented with 2 mM MgCl2, 200 µM
dNTP, and 0.125 µM of each primer, and the HotStar-Taq DNA polymerase system was used. Cycling condi-tions were 15 min at 95°C, 60 s at 65°C, 60 s at 72°C, and 39 cycles of 30 s at 95°C, 30 s at 65°C, and 45 s at 72°C, followed by a final 5-min incubation at 72°C. For analysis of PRAMEin patients 4, 6, 8, and 9, a second round of PCR (additional 30 cycles with the same PCR conditions) was needed. A seminested PCR was per-formed using an internal reverse primer (PRAMErevi, 5′ -GGT TTC CAA GGG GTT CAT CAC G-3′) and the forward primer. For amplification of a 98-bp fragment of IPL, PCR conditions were as described above (except the annealing temperature was 67°C and MgCl2
concentra-tion was 1.5 mM). Two rounds of PCR were performed to analyze the expression of rab13, EAR3, and FER. The first round comprised 20 cycles; the second round of PCR, applying the corresponding internal forward primers (rab13fori, 5′-CTA CAA GTC TGG GAC ACG GCT GG-3′; EAR3fori, 5′-CTT ACA CAT GCC GTG CCA ACA GG -3′; FERfori, 5′-CAT TAA ATG GAC AGC ACC GGA AGC-3′), comprised 30 cycles. For amplification of a 211-bp frag-ment of rab13 in the first round, PCR conditions were as described above, except the annealing temperature was 61°C, and the MgCl2concentration was 1.5 mM). In the
second round a 104-bp fragment was amplified (anneal-ing temperature 61°C, MgCl2concentration 2 mM). For
amplification of a 210-bp fragment of EAR3 or a 227-bp fragment of FER, in the first-round PCR conditions were as described above. In the second round a 151-bp frag-ment of EAR3 or a 114-bp fragfrag-ment of FER was ampli-fied. PCR conditions were as described above (MgCl2
concentration was 2.5 mM for the analysis of FER). Sam-ples of HRS cells and control cells were analyzed in par-allel, together with controls containing only Purescript lysis buffer. Some PCR products were gel purified and directly sequenced. No processed pseudogenes for
PRAMEand IPLwere detectable in the patients’ genome.
Results
Gene expression profiling of HL lines defines them as a distinct entity that is related to EBV-transformed B cell lines and a subset of diffuse large cell lymphoma cell lines. Four classical HL cell lines were used for the present study. Except for HDLM2, which is of T cell origin, the other three lines are B cell derived. To generate gene expression profiles, Affymetrix U95A oligonucleotide microarrays comprising approxi-mately 12,000 human mRNAs were used. The data sets were compared with the profiles of a large collection of normal B cell subsets (GC B cells, naive and memory B cells), B cell malignancies (diffuse large cell lymphoma; DLCL), Burkitt lymphoma (BL), follicular lymphoma (FL), and B cell chronic lymphocytic leukemia (B-CLL), as well as EBV-transformed peripheral blood B cell lines (LCL) and BL and DLCL cell lines. Unsupervised hierar-chical clustering revealed that the gene expression pro-files of the four HL cell lines were more similar to each other than to any other normal or malignant B cell (data not shown), implying that, with regard to their gene expression, the HL cell lines represent a distinct group among the various B cell types analyzed.
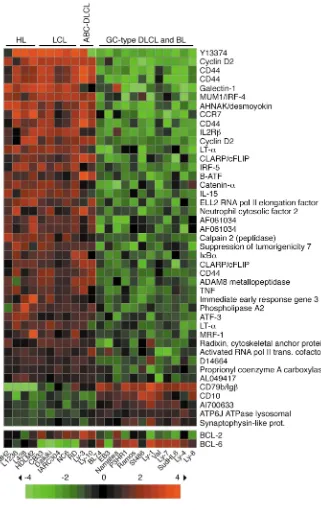
The unsupervised clustering divided the 71 samples into two main groups, one comprising the normal B cell subsets and the tumor biopsies, the other the cell lines (not shown). To more specifically determine the related-ness of the HL lines to the other cell lines, we examined the corresponding gene expression profiles of the four HL cell lines, five LCLs, six BL and eight DLCL cell lines by unsupervised analysis (Figure 1). The analysis revealed that the HL lines, the LCLs, and two DLCL lines that have been proposed to be derived from a subset of DLCL that shows features of in vitro–activated B cells (ABC-type DLCL) (21, 22) together form a separate branch. In the second branch, the BL lines appear intermingled with the remaining DLCL cell lines, four of which have been assigned to a subset of DLCL that resembles GC B cells (GC-type DLCL) (21, 22). It should be noted that the EBV-status of the cell lines has no influence on the clustering: the EBV+BL lines cluster separate from the
(EBV+) LCL, and the four HL cell lines are EBV–.
IKBα, CLARP(c FLIP), TNF, and activated RNA polymerase II transcriptional cofactor 4(21, 22). On the other hand,
mRNA encoding the GC B cell marker CD10was
upreg-ulated in the BL and GC-type DLCL, consistent with their proposed derivation from GC B cells. Differential expression of the BCL-2and BCL-6genes between the two groups could be detected by relaxing the criteria of the supervised analysis (see bottom of Figure 2). Over-all, BCL-2and BCL-6showed a reciprocal expression pattern between the two groups of cell lines, with low BCL-2 and high BCL-6 expression in the cell lines with a GC phenotype, as expected.
The results of the clustering analyses show that HL lines represent a distinct entity independent from a B or T cell derivation and imply that the HL, LCL, and ABC-type DLCL lines express a common set of genes that dis-tinguish them from cell lines that are derived from tumor types likely corresponding to transformed GC B cells.
Identification of genes specifically expressed in HL cell lines.
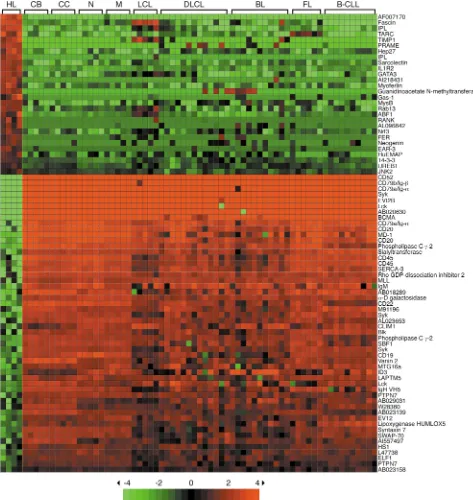
To identify genes specifically up- or downregulated in HRS cells, supervised clustering was used to compare the gene expression profile of the four HL cell lines
with those of the normal B cell subsets (naive, memo-ry, centroblasts, centrocytes), the LCL, and the various B cell NHL (FL, BL, DLCL, and B-CLL). As shown in Figure 3, 27 genes are specifically and consistently upregulated in the HL cell lines, and 45 genes are downregulated. Three of the genes upregulated in HRS cells are still unnamed and/or only described as cDNA sequences. Among the 24 distinct named genes upreg-ulated in HRS cells, two genes were found that are well known for their expression in HRS cells, namely the actin-bundling protein Fascinand the chemokine TARC
(9, 10). Also, expression of the TNF receptor family
member RANKand the metalloproteinase TIMP1by
HRS cells has been described recently (23, 24). The HRS cell marker CD30, another TNF receptor family mem-ber, was not identified as an upregulated gene with the stringent criteria used here, due to its expression in LCL and low-level transcription in some B-NHL.
The other 20 known upregulated genes have not been previously reported to be expressed in HRS cells. These 20 genes include four transcription factors, namely
GATA-3, ABF1, Nrf3, and EAR3, the imprinted gene IPL, the tumor antigen PRAME, the tyrosine kinase FER, two genes implicated in growth arrest (Hep27and Gas1), the decoy receptor IL-1R2, sarcolectin, which stimulates DNA synthesis, and the GTPase Rab13(Figure 3).
Somewhat surprisingly, the majority of the 27 genes identified here were not found in a previous study comparing HRS and GC B cells (11). Limited sensi-tivity could at least partly explain this finding, because the cDNA library of HRS cells was restricted to 6,000 transcripts in that study.
The genes downregulated in HRS cells include many B cell lineage-specific genes (e.g., CD19, CD20, CD52,
BCMA), two phosphatases (SBF1and PTPN7), and sev-eral genes involved in the regulation of the cytoskeleton and/or cell migration (HSRHO2, MSF, Vanin2) (Figure 2). A detailed analysis of the downregulation of B line-age markers in HL cell lines is presented elsewhere (25).
Protein expression of HRS cell–specific genes in HL cell lines.To investigate whether the upregulated mRNA levels of HRS cell–specific genes correspond to elevat-ed protein levels, we investigatelevat-ed HL cell lines for pro-tein expression of these genes. ABF1, neogenin, Gas-1, and GATA-3 were analyzed by immunoblotting (see supplementary Figure 2, http://www.jci.org/cgi/con-tent/full/111/4/529/DC1). The expression of IL-1R2 was evaluated by FACS analysis.
[image:5.576.107.236.50.335.2]ABF1 protein is present in three out of four HL cell lines (L1236, L428, KMH2), HDLM2 being negative or below detection limit for ABF1 expression. Two BL cell lines and Jurkat as a T cell line do not show ABF1 expression. The N-cam family member neogenin is strongly expressed in the L1236, L428, and KMH2 cell lines. Only very low protein levels were observed in the HDLM2 cell line, in two BL cell lines, and in the Jurkat cell line. No significant difference in Gas-1 protein level was detected comparing the four HL cell lines with BL2, BL41, and Jurkat, suggesting that the increased Figure 1
mRNA levels for this gene in HL lines does not result in increased protein levels. The T cell–specific transcrip-tion factor GATA-3 is present in Jurkat cells, as expect-ed, but also in L1236, L428, and KMH2. The HDLM2 and the two BL lines seem to be negative. Thus, for three of the four genes analyzed, protein expression could be demonstrated in at least three of the four HL lines. The lack of GATA-3 expression in the HDLM2 cell line might be surprising, but is in line with previ-ous data showing that T cell–derived HL cases may lack expression of individual T cell markers (4, 26).
FACS analysis revealed that IL-1R2 protein expres-sion can be detected only in the L1236 cell line, the three other HL cell lines being negative or below
detection level (not shown), although high mRNA lev-els were detected in all cell lines in the array analysis.
Analysis of primary HL cases by RT-PCR of microdissected HRS cells.Initially, we tried to confirm protein expres-sion of several upregulated genes by HRS cells in tumor tissues by immunohistochemistry on frozen and paraf-fin-embedded tissues. Unfortunately, none of the avail-able Ab’s tested (against GATA-3, ABF1, EAR3, neogenin, GAS1, and IL-1R2) stained reliably on tissue sections. For five of the upregulated genes, namely
[image:6.576.204.525.231.741.2]PRAME, IPL, FER, Rab13, and EAR3, expression in HRS cells in the tissue was analyzed by RT-PCR of microdis-sected HRS cells, using a laser-based microdissection system. Single HRS cells from seven cases of classical
Figure 2
Identification of genes differentially expressed between HL lines, LCL, and ABC-type DLCL lines versus BL and GC-type DLCL. The gene expres-sion profiles of four HL, five LCL, and two ABC-type DLCL lines that clustered together in the unsuper-vised analysis (see Figure 1) were compared with those generated from six BL and six DLCL (non–ABC-type) cell lines by supervised hierar-chical clustering using Genes@Work (see Methods). Columns represent individual cell lines, and rows corre-spond to genes. Color changes with-in a row with-indicate expression relative to the average of the sample popu-lation. Values are quantified by the scale bar that visualizes the differ-ence in the ζ-score (expression dif-ference/SD) relative to the mean. Genes are ranked based on the z-score (mean expression difference of the respective gene between phe-notype and control group/SD). The support value for supervised analy-sis was chosen as n =n0 – 1, where n0
HL were pooled in groups of 25 or 50 cells, and three such samples per case were analyzed in parallel with groups of non-HRS cells (mainly lymphocytes) from the same sections. For each of the five genes, all or at least most samples of HRS cells per case were positive in the PCR (except PRAMEin cases 4 and 6, and EAR3
[image:7.576.58.531.51.551.2]in cases 1 and 7), including EBV-positive and -negative cases, while nearly all control samples were negative (Table 1). We also analyzed two cases of LP HL, reveal-ing that four of the five genes are also consistently tran-scribed by HRS cells of this type of HL (Table 1). Thus, we confirmed expression of five genes in primary HRS Figure 3
Identification of genes specifically expressed or downregulated in HL cell lines. Supervised cluster analysis using Genes@Work. Gene expres-sion profiles of four HL cell lines were compared with four normal B cell subsets (five each of naive B cells, memory B cells, CBs and CCs), five LCL, seven DLCL cases, seven DLCL lines, four BL cases, eight BL lines, six FL, ten B-CLL. Matrices and gene ranking are as in Figure 2. The support value for supervised analysis was chosen as n =n0, where n0is the number of cells in the given phenotype set, allowing for no
unclustered sample per pattern in the phenotype set. Gene names are indicated. Twenty-seven distinct genes are significantly upregulated in the HL lines, and 45 distinct genes are downregulated (for one upregulated [IPL] and seven downregulated [Igα, Syk, Lck, CD20, PLCγ2, CD45,
cells, further supporting that the results obtained with the HL cell lines reliably reflect the gene expression pro-file of HRS cells in HL tissues.
Discussion
In the present study, large-scale gene expression profiling was performed to compare the gene expression profiles of HL cell lines with those of the main normal B cell sub-sets and B-NHL. A concern might be that the HL cell lines differ in several aspects from primary HRS cells in the tis-sue. Nevertheless, for several reasons we are confident that HRS cell-specific genes can be reliably identified using HL cell lines. First, a number of genes identified here as HRS cell specific are known to be expressed by HRS cells, i.e., Fascin, TARC, RANK, and TIMP1. The iden-tification of these markers hence supports the reliability of the approach. Second, by including a number of other B cell–derived cell lines in the comparison (LCL, BL lines, DLCL lines), common putative cell culture–associated changes in gene expression will not be falsely scored as being HRS cell-specific. Third, for five of the upregulat-ed genes, expression in primary HRS cells in the tissue was confirmed by analyzing microdissected HRS cells.
Gene expression profiling identifies HL cell lines as a distinct entity.Unsupervised hierarchical clustering revealed that the HL cell lines are more similar to each other than to
any other normal and malignant B cell sub-set (Figure 1). Since one of the four lines (HDLM2) is of T cell origin, this finding may indicate that the development of HRS cells results in a particular gene expression profile largely independent from their derivation of either B or T cells. This raises the intriguing possibility that–opposed to most other lym-phomas–the cell of origin is not the main determinant for the phenotype of the HRS cells, but that B cell–derived as well as T cell–derived HRS cells undergo (common?) transforming events resulting in an HRS cell-typical gene expression signature.
HL lines display an activated B cell signature similar to LCL and ABC-type DLCL. Hierar-chical clustering of the data sets from the HL lines and the various B cell–derived lines revealed two major branches in the corresponding dendrogram, one compris-ing the BL as well as GC-type DLCL lines, the other containing the HL lines, LCLs, and the recently described ABC-type DLCL lines (Figure 1). BL and the GC-type DLCL are thought to represent trans-formed GC B cells, which is also support-ed by the finding that both entities show active somatic hypermutation (27, 28). The present study shows that HL cell lines, although (in most cases) also derived from GC B cells, do not show a GC B cell phe-notype. This was already indicated from the lack of several typical GC B cell mark-ers (e.g., BCL-6, CD10) (29, 30) and the lack of ongo-ing hypermutation in HRS cells (5, 31, 32). The lack of the GC B cell phenotype may be part of a general loss of the B lineage phenotype of HRS cells, as reported recently (25). It is an open question whether this loss of the GC B cell phenotype is somehow relat-ed to the proposrelat-ed origin of HRS cells from preapop-totic GC B cells, is associated with the phenotypic changes during malignant transformation, or reflects, at least in part, a stage of GC B cell develop-ment where GC B cell markers are downregulated.
[image:8.576.58.333.90.309.2]The distinction between GC- and ABC-type DLCL was based on the observation that a GC and an (in vitro–) activated B cell signature can be defined by genes specifically upregulated in these cell types and that DLCL can be clustered according to either of these signatures (21). Notably, in contrast to the GC signa-ture, which includes several GC B cell–specific genes, the ABC-type signature is mainly composed of general activation markers (21). Most of the 37 genes that dif-ferentiate HL lines, LCL, and ABC-type DLCL lines from BL lines and GC-type DLCL lines showed upreg-ulation in the first group of cell lines (Figure 2). Eight of these upregulated genes are part of the ABC signa-ture. Hence, HL lines show an activated phenotype unrelated to the GC B cell phenotype. A part of this Table 1
RT-PCR analysis of microdissected HRS cells for expression of PRAME, IPL, FER,
Rab13, and EAR3
Case Subtype EBV Samples positive/Samples analyzed
status PRAME IPL FER Rab13 EAR3
Classical HL
1 NS – 3/3 3/3 3/3 3/3 1/3
2 MC + 3/3 3/3 nd nd nd
3 NS – 4/4 3/3 2/3 3/3 3/3
4 NS + 2/4A 3/3 3/3 3/3 3/3
5 NS – 3/3 3/3 2/3 3/3 3/3
6 MC + 0/3A 2/3 3/3 3/3 2/3
7 MC – 3/3 3/3 3/3 3/3 1/3
LP HL
8 LP – 1/2A 2/2 2/2 2/2 0/2
9 LP – 2/2A 2/2 2/2 2/2 1/2
Controls
Positive controls 15/16 11/12 13/13 10/10 11/13 Non-HRS cells
1–9 1/27 0/25 0/22 3/22 1/22
Buffer controls
1-9 0/27 0/25 0/22 0/22 0/22
Groups of 25 or 50 HRS cells and non-HRS cells (small cells isolated from the same tissue sections as the HRS cells) were analyzed. Overall, 37 samples with 25 HRS cells and 81 sam-ples with 50 HRS cells and 26 samsam-ples with 25 HRS cells and 92 samsam-ples with 50 non-HRS cells were analyzed. Buffer controls represent reaction tubes with buffer but without cells. The few positive control non-HRS cell samples may be due to cellular contamination of the samples by fragments from HRS cells or expression of the respective genes by some cells among the non-HRS cells. Groups of 10 FACS-sorted KMH2 cells served as positive con-trols. PCR for PRAMEand IPLconsisted of one round with 40 cycles, the three other genes were analyzed by two rounds of PCR with 20 and 30 cycles. AIn each of cases 4, 8, and 9, one HRS cell sample became positive only after two rounds of amplification; control cells remained negative after two rounds of PCR. HRS cells of case 6 remained negative for PRAME
phenotype is based on NF-κB–regulated genes (name-ly cyclin D2, IRF-4/MUM-1, CCR7, IκBα, cFLIP), and HRS cells, LCL and ABC-type DLCL indeed show constitu-tive activity of this transcription factor (22, 33, 34).
Identification of HRS cell–specific genes. In the super-vised comparison of the four HL cell lines with the collection of all other subsets, 27 distinct genes were identified as being significantly upregulated in HRS cells (Figure 2). Four of the genes (Fascin, TARC,
TIMP1, and RANK) were already known from previous studies to be expressed in HRS cells, but for the other 23 genes it was not known previously that they are expressed by these cells. By immunoblotting, we showed protein expression of GATA-3, ABF1, GAS1, and neogenin. Moreover, for five genes (PRAME, IPL,
Fer, Rab13, EAR3), expression by primary HRS cells was confirmed by RT-PCR on microdissected tumor cells (Table 1). As transcription of the genes was detected in EBV-positive as well as EBV-negative cases of classical HL, expression of these genes by HRS cells is independent from the EBV status of the HRS cells. Moreover, we detected transcripts of four of the five genes also in HRS cells of two cases of LP HL.
Notably, four transcription factors were identified among the upregulated genes, namely GATA-3, ABF1,
Nrf3, and EAR3. GATA-3is a T and NK cell–specific transcription factor that is essential for T cell
devel-opment and involved in the regulation of TH2
cytokine expression. It was reported that HL cell lines lack expression of GATA-3 (35); however, we detected expression of this protein in three of the four HL lines by immunoblot analysis. The ectopic expression of this T cell marker in the B cell–derived HL lines L428, L1236, and KMH2 underscores the aberrant pheno-type of these cells. ABF1 is a member of the basic helix-loop-helix family of transcription factors and was found to be strongly expressed only in LCL and in vitro–activated B cells (36). ABF1 can form het-erodimers with both products of the E2A gene, i.e., E12 and E47, and likely represses their activating functions (36). E2Atranscription by the HL lines is detected on the array, so that ABF1 may indeed func-tion in these cells, at least in part, by repressing E2A proteins, which are essential regulators not only dur-ing early B cell development but also in mature, acti-vated B cells (37). However, ABF1 may also bind to DNA as a homodimer, suggesting that it may have so far not understood functions in addition to repress-ing E2A proteins. Nrf3 belongs to the family of tran-scription factors with Cap’n’collar-type basic region leucine zipper domains (38). Low-level expression was detected in various tissues, including the spleen and peripheral blood leukocytes. Nrf3 heterodimerizes with small Maf proteins and binds to Maf recognition elements (MARE). The fourth transcription factor with increased expression in HL lines is EAR3, a tran-scriptional repressor belonging to the steroid hor-mone receptor superfamily (39). This repressor is mainly expressed in the central nervous system during
development and counteracts the activation of vari-ous genes by hormones (39). The relevance of aberrant expression of these transcription factors in HRS cells remains to be determined.
The nonreceptor tyrosine kinase FER is widely expressed, but was found to be significantly upregu-lated in HL cell lines (Figure 3). This kinase has been shown to activate STAT-3 (40). Because constitutive activation of STAT-3 has been shown for HRS cells (41, 42), the overexpression of FER may be involved in this activation.
The list of genes showing deregulated expression in HL lines also includes the imprinted gene IPL, which shows normally high-level expression only in the pla-centa (43). Its function is not yet known, but a mouse gene highly similar to IPLis essential for Fas expres-sion, pointing to a potential role of IPLin the regu-lation of apoptosis. Rab13 is a Ras-associated small GTPase, which functions presumably in vesicular traffic. The common tumor antigen PRAME is expressed on melanoma cells, by a fraction of myeloid and lymphoid leukemias, and by multiple myeloma cells, but only rarely by B-NHL (44–46). Because expression in normal tissues is absent or barely detectable, PRAME may represent an interesting tar-get for immunotherapy in HL.
Implications for HL pathogenesis, treatment, and diagno-sis.By comparing gene expression profiles of HL cell lines to profiles of the main mature B cell popula-tions, LCL, and the main types of B-NHL, we identi-fied genes that show specifically upregulated expres-sion in HRS cells of classical HL. To our surprise, four of these markers turned out to be expressed also in HRS cells of LP HL (Table 1). This was unexpected since the tumor cells of these subtypes are well known for their phenotypic differences (2, 12). The present RT-PCR data may indicate a closer relationship of classical and LP HL than thought previously.
lines represent a distinct entity, irrespective of the cel-lular origin of the HRS cells; (b) HL lines are most sim-ilar to LCL and ABC-like DLCL lines, suggesting an activated lymphocyte phenotype; and (c) over 20 genes are specifically upregulated in HRS cells, which may play an important role in the pathogenesis of HL.
Acknowledgments
We are grateful to V. Miljkovic, M. Fahrig, J. Jesdinsky, and Y. Blum for technical assistance. We thank C. Murre for supplying anti-ABF1 antiserum. This work was support-ed through the Deutsche Forschungsgemeinschaft by SFB502 and a Heisenberg Award to R. Küppers. U. Klein was recipient of a fellowship granted by the Human Fron-tiers Science Program. G. Cattoretti is a recipient of an Esther Aboodi Associate Professorship.
1. Weiss, L.M., Chan, J.K.C., MacLennan, K., and Warnke, R.A. 1999. Pathology of classical Hodgkin’s disease. In Hodgkin’s disease.P.M. Mauch, J.O. Armitage, V. Diehl, R.T. Hoppe, L.M. Weiss, editors. Lip-pencott Williams & Wilkins. Philadelphia, Pennsylvania, USA. 101–120. 2. Küppers, R. 2002. Molecular biology of Hodgkin’s lymphoma. Adv.
Can-cer Res. 44:277–312.
3. Müschen, M., et al. 2000. Rare occurrence of classical Hodgkin’s disease as a T cell lymphoma. J. Exp. Med.191:387–394.
4. Seitz, V., et al. 2000. Detection of clonal T-cell receptor gamma-chain gene rearrangements in Reed-Sternberg cells of classic Hodgkin disease. Blood. 95:3020–3024.
5. Kanzler, H., Küppers, R., Hansmann, M.L., and Rajewsky, K. 1996. Hodgkin and Reed-Sternberg cells in Hodgkin’s disease represent the outgrowth of a dominant tumor clone derived from (crippled) germinal center B cells. J. Exp. Med.184:1495–1505.
6. Küppers, R., and Rajewsky, K. 1998. The origin of Hodgkin and Reed/Stern-berg cells in Hodgkin’s disease. Annu. Rev. Immunol.16:471–493. 7. Hsu, S.M., and Jaffe, E.S. 1984. Leu M1 and peanut agglutinin stain the
neoplastic cells of Hodgkin’s disease. Am. J. Clin. Pathol.82:29–32. 8. Oudejans, J.J., et al. 1996. Granzyme B expression in Reed-Sternberg cells
of Hodgkin’s disease. Am. J. Pathol.148:233–240.
9. Pinkus, G.S., et al. 1997. Fascin, a sensitive new marker for Reed-Stern-berg cells of Hodgkin’s disease. Evidence for a dendritic or B cell deriva-tion? Am. J. Pathol.150:543–562.
10. van den Berg, A., Visser, L., and Poppema, S. 1999. High expression of the CC chemokine TARC in Reed-Sternberg cells. A possible explanation for the characteristic T-cell infiltration Hodgkin’s lymphoma. Am. J. Pathol.154:1685–1691.
11. Cossman, J., et al. 1999. Reed-Sternberg cell genome expression supports a B-cell lineage. Blood. 94:411–416.
12. Hansmann, M.-L., Weiss, L.M., Stein, H., Harris, N.L., and Jaffe, E.S. 1999. Pathology of lymphocyte predominance Hodgkin’s disease. In Hodgkin’s disease.P.M. Mauch, J.O. Armitage, V. Diehl, R.T. Hoppe, L.M. Weiss, editors. Lippencott Williams & Wilkins. Philadelphia, Pennsylva-nia, USA. 169–180.
13. Drexler, H.G. 1993. Recent results on the biology of Hodgkin and Reed-Sternberg cells. II. Continuous cell lines. Leuk. Lymphoma. 9:1–25. 14. Kanzler, H., et al. 1996. Molecular single cell analysis demonstrates the
derivation of a peripheral blood-derived cell line (L1236) from the Hodgkin/Reed-Sternberg cells of a Hodgkin’s lymphoma patient. Blood. 87:3429–3436.
15. Wolf, J., et al. 1996. Peripheral blood mononuclear cells of a patient with advanced Hodgkin’s lymphoma give rise to permanently growing Hodgkin-Reed Sternberg cells. Blood. 87:3418–3428.
16. Klein, U., et al. 2001. Gene expression profiling of B cell chronic lym-phocytic leukemia reveals a homogeneous phenotype related to memo-ry B cells. J. Exp. Med. 194:1625–1638.
17. Klein, U., et al. 2003. Transcriptional analysis of the B-cell germinal cen-ter reaction. Proc. Natl. Acad. Sci. USA. In press.
18. Eisen, M.B., Spellman, P.T., Brown, P.O., and Botstein, D. 1998. Cluster analysis and display of genome-wide expression patterns. Proc. Natl. Acad. Sci. USA. 95:14863–14868.
19. Califano, A., Stolovitzky, G., and Tu, Y. 2000. Analysis of gene expression microarrays for phenotype classification. Proc. Int. Conf. Intell. Syst. Mol. Biol. 8:75–85.
20. Böhm, M., Wieland, I., Schütze, K., and Rubben, H. 1997. Microbeam MOMeNT: non-contact laser microdissection of membrane-mounted native tissue. Am. J. Pathol. 151:63–67.
21. Alizadeh, A.A., et al. 2000. Distinct types of diffuse large B-cell lym-phoma identified by gene expression profiling. Nature. 403:503–511. 22. Davis, R.E., Brown, K.D., Siebenlist, U., and Staudt, L.M. 2001. Con-stitutive nuclear factor kappaB activity is required for survival of acti-vated B cell-like diffuse large B cell lymphoma cells. J. Exp. Med. 194:1861–1874.
23. Fiumara, P., et al. 2001. Functional expression of receptor activator of nuclear factor kappaB in Hodgkin disease cell lines. Blood. 98:2784–2790. 24. Oelmann, E., et al. 2002. Tissue inhibitor of metalloproteinases 1 is an autocrine and paracrine survival factor, with additional immune-regu-latory functions, expressed by Hodgkin/Reed-Sternberg cells. Blood. 99:258–267.
25. Schwering, I., et al. 2003. Loss of the B lineage-specific gene expression program in Hodgkin and Reed/Sternberg cells of Hodgkin’s lymphoma. Blood. In press.
26. Willenbrock, K., et al. 2002. T-cell variant of classical Hodgkin’s lym-phoma with nodal and cutaneous manifestations demonstrated by sin-gle-cell polymerase chain reaction. Lab. Invest. 82:1103–1109. 27. Chapman, C.J., Mockridge, C.I., Rowe, M., Rickinson, A.B., and
Steven-son, F.K. 1995. Analysis of VH genes used by neoplastic B cells in endem-ic Burkitt’s lymphoma shows somatendem-ic hypermutation and intraclonal heterogeneity. Blood. 85:2176–2181.
28. Lossos, I.S., et al. 2000. Ongoing immunoglobulin somatic mutation in germinal center B cell-like but not in activated B cell-like diffuse large cell lymphomas. Proc. Natl. Acad. Sci. USA. 97:10209–10213.
29. Carbone, A., et al. 1998. Expression status of BCL-6 and syndecan-1 iden-tifies distinct histogenetic subtypes of Hodgkin’s disease. Blood. 92:2220–2228.
30. Dogan, A., Bagdi, E., Munson, P., and Isaacson, P.G. 2000. CD10 and BCL-6 expression in paraffin sections of normal lymphoid tissue and B-cell lymphomas. Am. J. Surg. Pathol. 24:846–852.
31. Bräuninger, A., et al. 1999. Identification of common germinal-center B-cell precursors in two patients with both Hodgkin’s disease and non-Hodgkin’s lymphoma. N. Engl. J. Med.340:1239–1247.
32. Marafioti, T., et al. 2000. Hodgkin and Reed-Sternberg cells represent an expansion of a single clone originating from a germinal center B-cell with functional immunoglobulin gene rearrangements but defective immunoglobulin transcription. Blood. 95:1443–1450.
33. Bargou, R.C., et al. 1997. Constitutive nuclear factor-kappaB-RelA acti-vation is required for proliferation and survival of Hodgkin’s disease tumor cells. J. Clin. Invest. 100:2961–2969.
34. Izumi, K.M., and Kieff, E.D. 1997. The Epstein-Barr virus oncogene prod-uct latent membrane protein 1 engages the tumor necrosis factor recep-tor-associated death domain protein to mediate B lymphocyte growth transformation and activate NF-kappaB. Proc. Natl. Acad. Sci. USA. 94:12592–12597.
35. Hsu, P.L., Xie, S.S., and Hsu, S.M. 1996. Absence of T-cell- and B-cell-spe-cific transcription factors TCF-1, GATA-3, and BSAP in Hodgkin’s Reed-Sternberg cells. Lab. Invest. 74:395–405.
36. Massari, M.E., et al. 1998. Characterization of ABF-1, a novel basic helix-loop-helix transcription factor expressed in activated B lymphocytes. Mol. Cell. Biol. 18:3130–3139.
37. Kee, B.L., Quong, M.W., and Murre, C. 2000. E2A proteins: essential reg-ulators at multiple stages of B-cell development. Immunol. Rev. 175:138–149.
38. Kobayashi, A., et al. 1999. Molecular cloning and functional characteri-zation of a new Cap’n’collar family transcription factor Nrf3. J. Biol. Chem. 274:6443–6452.
39. Tsai, S.Y., and Tsai, M.J. 1997. Chick ovalbumin upstream promoter-transcription factors (COUP-TFs): coming of age. Endocr. Rev. 18:229–240.
40. Priel-Halachmi, S., et al. 2000. FER kinase activation of Stat3 is deter-mined by the N-terminal sequence. J. Biol. Chem. 275:28902–28910. 41. Chen, H., et al. 2001. Linkage between STAT regulation and Epstein-Barr
virus gene expression in tumors. J. Virol.75:2929–2937.
42. Kube, D., et al. 2001. STAT3 is constitutively activated in Hodgkin cell lines. Blood. 98:762–770.
43. Qian, N., et al. 1997. The IPL gene on chromosome 11p15.5 is imprint-ed in humans and mice and is similar to TDAG51, implicatimprint-ed in Fas expression and apoptosis. Hum. Mol. Genet. 6:2021–2029.
44. Ikeda, H., et al. 1997. Characterization of an antigen that is recognized on a melanoma showing partial HLA loss by CTL expressing an NK inhibitory receptor. Immunity. 6:199–208.
45. Pellat-Deceunynck, C., et al. 2000. The cancer germ-line genes MAGE-1, MAGE-3 and PRAME are commonly expressed by human myeloma cells. Eur. J. Immunol. 30:803–809.
46. van Baren, N., et al. 1998. PRAME, a gene encoding an antigen recog-nized on a human melanoma by cytolytic T cells, is expressed in acute leukaemia cells. Br. J. Haematol. 102:1376–1379.