Regulation of endogenous glucose production
by glucose per se is impaired in type 2 diabetes
mellitus.
M Mevorach, … , H Shamoon, L Rossetti
J Clin Invest.
1998;
102(4)
:744-753.
https://doi.org/10.1172/JCI2720
.
We examined the ability of an equivalent increase in circulating glucose concentrations to
inhibit endogenous glucose production (EGP) and to stimulate glucose metabolism in
patients with Type 2 diabetes mellitus (DM2). Somatostatin was infused in the presence of
basal replacements of glucoregulatory hormones and plasma glucose was maintained
either at 90 or 180 mg/dl. Overnight low-dose insulin was used to normalize the plasma
glucose levels in DM2 before initiation of the study protocol. In the presence of identical and
constant plasma insulin, glucagon, and growth hormone concentrations, a doubling of the
plasma glucose levels inhibited EGP by 42% and stimulated peripheral glucose uptake by
69% in nondiabetic subjects. However, the same increment in the plasma glucose
concentrations failed to lower EGP, and stimulated glucose uptake by only 49% in patients
with DM2. The rate of glucose infusion required to maintain the same hyperglycemic
plateau was 58% lower in DM2 than in nondiabetic individuals. Despite diminished rates of
total glucose uptake during hyperglycemia, the ability of glucose per se (at basal insulin) to
stimulate whole body glycogen synthesis (glucose uptake minus glycolysis) was
comparable in DM2 and in nondiabetic subjects. To examine the mechanisms responsible
for the lack of inhibition of EGP by hyperglycemia in DM2 we also assessed the rates of
total glucose output (TGO), i.e., flux through glucose-6-phosphatase, and […]
Research Article
Find the latest version:
J. Clin. Invest.
© The American Society for Clinical Investigation, Inc. 0021-9738/98/08/0744/10 $2.00
Volume 102, Number 4, August 1998, 744–753 http://www.jci.org
Regulation of Endogenous Glucose Production by Glucose Per Se Is Impaired in
Type 2 Diabetes Mellitus
Michèle Mevorach, Adria Giacca, Yigal Aharon, Meredith Hawkins, Harry Shamoon, and Luciano Rossetti Department of Medicine, Diabetes Research Center, Albert Einstein College of Medicine, Bronx, New York 10461
Abstract
We examined the ability of an equivalent increase in circu-lating glucose concentrations to inhibit endogenous glucose production (EGP) and to stimulate glucose metabolism in patients with Type 2 diabetes mellitus (DM2). Somatostatin was infused in the presence of basal replacements of gluco-regulatory hormones and plasma glucose was maintained either at 90 or 180 mg/dl. Overnight low-dose insulin was used to normalize the plasma glucose levels in DM2 before initiation of the study protocol. In the presence of identical and constant plasma insulin, glucagon, and growth hor-mone concentrations, a doubling of the plasma glucose lev-els inhibited EGP by 42% and stimulated peripheral glucose uptake by 69% in nondiabetic subjects. However, the same increment in the plasma glucose concentrations failed to lower EGP, and stimulated glucose uptake by only 49% in patients with DM2. The rate of glucose infusion required to maintain the same hyperglycemic plateau was 58% lower in DM2 than in nondiabetic individuals. Despite diminished rates of total glucose uptake during hyperglycemia, the abil-ity of glucose per se (at basal insulin) to stimulate whole body glycogen synthesis (glucose uptake minus glycolysis) was comparable in DM2 and in nondiabetic subjects. To ex-amine the mechanisms responsible for the lack of inhibition of EGP by hyperglycemia in DM2 we also assessed the rates of total glucose output (TGO), i.e., flux through glucose-6-phosphatase, and the rate of glucose cycling in a subgroup of the study subjects. In the nondiabetic group, hyperglyce-mia inhibited TGO by 35%, while glucose cycling did not change significantly. In DM2, neither TGO or glucose cy-cling was affected by hyperglycemia. The lack of increase in glucose cycling in the face of a doubling in circulating glu-cose concentrations suggested that hyperglycemia at basal insulin inhibits glucose-6-phosphatase activity in vivo. Con-versely, the lack of increase in glucose cycling in the pres-ence of hyperglycemia and unchanged TGO suggest that the increase in the plasma glucose concentration failed to enhance the flux through glucokinase in DM2.
In summary, both lack of inhibition of EGP and dimin-ished stimulation of glucose uptake contribute to impaired
glucose effectiveness in DM2. The abilities of glucose at basal insulin to both increase the flux through glucokinase and to inhibit the flux through glucose-6-phosphatase are impaired in DM2. Conversely, glycogen synthesis is exquis-itely sensitive to changes in plasma glucose in patients with
DM2. (J. Clin. Invest. 1998. 102:744–753.) Key words:
en-dogenous glucose production • glucokinase • type 2 diabetes •
hyperglycemia • glucose-6-phosphatase
Introduction
Type 2 diabetes mellitus (DM2)1 is a complex metabolic disor-der with impairments in both insulin secretion and action (1–5). Insulin resistance can be demonstrated in patients with DM2 by means of the euglycemic hyperinsulinemic clamp technique (2–5). The impairment in insulin action under these experimental conditions includes diminished inhibition of en-dogenous glucose production (EGP) and decreased peripheral glucose uptake (2–5). The latter is largely accounted for by a marked decrease in the ability of insulin to promote glucose storage into skeletal muscle glycogen (6–11).
Hyperglycemia per se is also capable of increasing the dis-posal of glucose in peripheral tissues and of inhibiting EGP (12–19). In fact, it has been suggested that in patients with DM2, the plasma glucose concentration is increased at a criti-cal level so as to compensate for insulin resistance (20–23). In support of the latter notion is the finding that when insulin clamp studies are performed at the individuals’ fasting plasma glucose levels (“isoglycemic clamp”), patients with DM2 ex-hibit normal rates of glucose disposal and storage (21–23). Conversely, glucose effectiveness as assessed by either the Bergman Minimal Model or by a direct measurement of the glucose “area under the curve” is markedly decreased in pa-tients with DM2 (24–26). Finally, increased basal EGP can be demonstrated in DM2 despite ambient hyperglycemia and normo- or hyperinsulinemia (1–3). This may be due, at least in part, to defective suppression of EGP by glucose per se at basal insulin.
Although the ability of glucose to promote its own disposal and to inhibit EGP in the presence of basal insulin has long been recognized (12–19), there are only a handful of studies which directly measured this parameter in nondiabetic humans or in patients with DM2 (26). Thus, it remains unclear whether these effects of glucose are preserved in patients with DM2. Overall, it has been clearly demonstrated that hyperglycemia per se markedly increases splanchnic glucose balance in nondi-abetic individuals (27, 28), and that this effect is due to both enhanced splanchnic glucose uptake and decreased EGP (27,
Address correspondence to Dr. Harry Shamoon, Diabetes Research Center, Albert Einstein College of Medicine, 1300 Morris Park Avenue, Bronx, NY 10461. Phone: 718-430-2127; FAX: 718-430-8557; E-mail: shamoon@aecom.yu.edu
Received for publication 2 January 1998 and accepted in revised form 22 June 1998.
28). Suppression of EGP (12–17) and of total glucose output (18, 29, 30) by hyperglycemia have also been demonstrated in nondiabetic subjects using isotope dilution techniques. Finally, in a recent study designed to directly assess basal glucose effec-tiveness in patients with DM2, Basu et al. have shown higher plasma glucose concentrations in response to an identical glu-cose infusion in patients with DM2 compared with nondiabetic subjects (26). In this study, estimates of the ability of the ambi-ent glucose concambi-entration to promote glucose disposal and to suppress EGP were both diminished (by 42 and by 29%, re-spectively) in DM2. However, the difference in the glucose ef-fect on EGP did not achieve statistical significance.
The aim of this study was to investigate the changes of EGP and peripheral glucose disposal in response to identical increments in the ambient glucose concentrations in patients with DM2 while maintaining the plasma concentrations of in-sulin, glucagon, and growth hormone at constant and basal lev-els. In the attempt to further clarify the mechanisms whereby glucose regulates EGP and glucose disposal in DM2, we also monitored the rates of total glucose output, glucose cycling, and glycolysis throughout the studies.
Methods
Subjects.We studied nine patients with DM2. Five patients were treated with short-acting oral sulfonylurea agents, three were treated with insulin, and one was treated with diet alone. The diabetic sub-jects had an average HbA1c of 8.560.4% (NL , 6.1%), body mass index (BMI) of 27.661.1 kg/m2, age of 5762 yr, and duration of dia-betes of 1462 yr. Except for diabetes, all were in general good health. We also studied nine nondiabetic healthy volunteers with average BMI of 27.861.6 kg/m2 and average age of 3865 yr. This nondiabetic group was subdivided in age-matched controls (n5 4) with age of 5267 yr and BMI of 28.962.0 kg/m2 and young controls (n5 5) with age of 2662 yr and BMI of 26.962.6 kg/m2. None of the normal sub-jects was taking any medications and they had no family history of DM2. Eligibility for study was determined by history and physical ex-amination and hematological and biochemical tests. Subjects with anemia, bleeding disorders, or recent weight changes were excluded. Informed written consent was obtained in accordance with the policy of the Committee on Clinical Investigations of the Albert Einstein College of Medicine.
Experimental design. The diabetic patients were admitted on the evening before the day of the study. Oral medications, if any, were discontinued 24 h before the study, and long-acting insulin was with-held the evening before the study. Beginning at 10:00 p.m., patients were asked to fast, and a variable intravenous infusion of insulin was started. The insulin infusion rate was adjusted according to an algo-rithm based on hourly blood glucose measurements (31). The next morning, the patients were transferred to the Clinical Research Unit and the experimental protocol was initiated. Nondiabetic subjects were admitted to the Clinical Research Unit on the morning of the study after an overnight fast.
An 18-gauge catheter was inserted in an antecubital vein for infu-sions and a contralateral hand vein was cannulated in a retrograde fashion for arterialized venous blood sampling. In order to obtain ar-terialized venous blood, this hand was kept in a warming plexiglass box maintained at 608C. The experimental protocols lasted 6 h and included three 120-min periods: a first euglycemic period, a second euglycemic period, and a third hyperglycemic period (Fig. 1). At t5
2120 min, a primed-continuous infusion of HPLC-purified [3-3 H]glu-cose (New England Nuclear, Boston, MA) was started (prime infu-sion 22 mCi; continuous infusion rate 0.15 mCi/min) via an indwelling catheter. In three normal subjects and in five diabetic patients, [2-3H]- and [6-3H]glucose (HPLC-purified, New England Nuclear) were
infused instead (prime 18 mCi each; continuous infusion rate 0.13
mCi/min each). At t52120 min, an infusion containing somatostatin (250 mg/h; Bachem, King of Prussia, PA), growth hormone (3.0 ng/kg per min; Genentech, San Francisco, CA), and glucagon (1.0 ng/kg per min; Eli Lilly, Indianapolis, IN) was initiated and maintained throughout the study. This infusion was prepared with 1 mg/ml albu-min diluted in saline. At t52120 min, an infusion of insulin pre-pared in albumin-containing saline (Novolin Regular; Novo-Nordisk, Princeton, NJ) was also begun. Plasma glucose concentrations were measured at 10-min intervals and the rate of insulin infusion was ad-justed to maintain euglycemia (90–100 mg/dl) without the need for exogenous glucose infusion. When a stable rate of insulin infusion was determined, it was kept constant for the remainder of the study. This occurred within the last 30 min of this first euglycemic period (t5230 to t5 0).
During the second euglycemic period, the “individualized” basal rate of insulin infusion was kept constant and ambient euglycemia prevailed for 2 h, until t5 120 min. At t5 120 min, plasma glucose levels were rapidly increased by z 90 mg/dl and clamped at z 180 mg/dl for the next 2 h, until 240 min, using an exogenous infusion of 20% dextrose. Tracers ([3-3H]glucose or [2-3H]glucose and [6-3 H]glu-cose) were added to the cold 20% dextrose (z 0.1 mCi/ml) to main-tain glucose specific activity constant during hyperglycemia (32). All other infusions were kept at the rate used during the second euglyce-mic period.
To discern the specific effects of the changes in the ambient glu-cose levels from potential time-dependent effects of the pancreatic clamp procedure per se, we restudied three nondiabetic and three di-abetic patients with HPLC-purified [3-3H]glucose during continuous 6 h euglycemia. As in the hyperglycemic study, at t52120 min, a primed continuous infusion of HPLC-purified [3-3H]glucose (New England Nuclear) was started (prime infusion 22 mCi; continuous in-fusion rate 0.15 mCi/min), as well as infusions of somatostatin (250
mg/h), growth hormone (3.0 ng/kg per min), and glucagon (1.0 ng/kg per min), and maintained throughout. In this protocol (designated as “Time-Control Study”), the rates of insulin infusion were carefully reproduced to match those used during the euglycemic–hyperglyce-mic study in the same individual, but euglycemia was maintained dur-ing the entire study (i.e., the third period hyperglycemia was replaced by a third euglycemic period). Blood withdrawal procedures were performed identically as in the hyperglycemic studies. Thus, a total of 22 six-hour pancreatic clamp studies were performed, 16 of which were conducted with a final hyperglycemic period and 6 of which were time-control studies.
At the completion of the study, the tracer, glucose and hormone infusions were stopped. The insulin infusion was continued in the dia-betic patients for an additional 30 min. A meal was provided and subjects were discharged. Diabetic individuals resumed their usual regimens.
Blood was sampled at 5-min intervals for measurement of plasma glucose, at 15-min intervals for glucose specific activity, plasma insu-lin, glucagon, epinephrine, and norepinephrine, at 30-min intervals for free fatty acids (FFA) and glycerol, and at 60-min intervals for cortisol and growth hormone. Continuous indirect calorimetry was performed for a 20-min period at 95 min and again at 215 min. Pro-tein oxidation was estimated from the urinary urea production mea-sured on a urine sample obtained at the end of the procedure.
2-X8 and AG 50 W-X8; Bio-Rad Laboratories, Richmond, CA). An aliquot of the eluate was evaporated to dryness and after addition of water and liquid scintillation solution, the total radioactivity from [2-3H]- and [6-3H]glucose was measured by beta scintillation counting.
The radioactivity of [6-3H]glucose was determined in an aliquot of the eluate as described by Dunn et al. (33). First, 10 mg of glucose was added to 2 ml of the eluate as a carrier. Glucose was then oxi-dized with periodate to five molecules of formic acid (derived from carbons 1–5) and one molecule of formaldehyde (derived from car-bon 6). After addition of dimedon, formaldehyde precipitates as formaldemethone. The radioactivity of the precipitate was deter-mined after filtering, drying, and weighing. In all subjects studied, the recovery for [6-3H]glucose by the dimedon procedure was quite reproducible and z 90%. The radioactivity of [2-3H]glucose was cal-culated as the difference between total radioactivity and that of [6-3H]glucose. Aliquots of the infusate tracer mixture were run in parallel with the plasma samples through the dimedon procedure.
Plasma insulin, glucagon, growth hormone, and cortisol were de-termined by RIA (34). Plasma epinephrine and norepinephrine were measured using an isotope derivative assay (34). Plasma FFA and glycerol were measured using colorimetric enzymatic methods (31) and plasma lactate by an enzymatic spectrophotometric assay (35). For in-direct calorimetry, air flow, O2, and CO2 concentrations in the ex-pired and insex-pired air were measured by a computerized open-circuit system (Deltatrac; Sensormedics, Yorba Linda, CA). Urinary nitrogen was measured by the Kjeldahl procedure (36). HbA1c was measured by ion-exchange chromatography with an upper normal limit of 6.1%.
Calculations. Rates of glucose appearance (Ra) and disappear-ance (Rd) were calculated using Steele’s steady-state equation (37). Total glucose output (TGO) and endogenous glucose production (EGP) were determined by subtracting the rates of glucose infusion from the tracer-determining Ra. TGO was calculated using the Ra measured with 2-[3H]glucose, while EGP was calculated using the Ra measured with either [3-3H]- or [6-3H]glucose. In the studies in which both [2-3H]glucose and [6-3H]glucose were infused, glucose cycling was calculated as the difference between TGO and EGP. Rates of glycolysis from plasma glucose were estimated from the increment per unit time in tritiated water (disintegrations per minute per millili-ter per minute) multiplied by body wamillili-ter mass (in millilimillili-ters) per [3-3H]glucose specific activity (disintegrations per minute per milligram)
as previously validated (38, 39). Glycogen synthetic rates were esti-mated as the difference between glucose disposal rate (Rd) and gly-colysis from plasma glucose (38, 39). Carbohydrate oxidation was cal-culated from O2 consumption and CO2 production (corrected for protein oxidation) with the equations of Lusk (40). Data for glucose turnover, carbohydrate and lipid oxidation, plasma hormones, and substrate concentrations represent the mean values during the final 60 min of the euglycemic period and the final 60 min of the hypergly-cemic period. For the glucose cycling data, the results represent the average values for the entire euglycemic period and the final 60 min of the hyperglycemic period. Since during the time-control studies, euglycemia was maintained throughout the three 2-h periods of the procedure, we will refer to the time period that corresponds to the hy-perglycemic clamp as the “third” euglycemic period. The results rep-resent the mean values during the last 60 min of the second euglyce-mic period (60–120 min), and the final 60 min of the third euglyceeuglyce-mic period (180–240 min).
Statistical analysis of the data over time was performed using PROC MIXED in SAS System Version 6.12 (SAS Institute, Cary, NC). The random effect considered in this mixed model is the error measure-ment of individual subjects, and the within individual fixed effect is the difference between groups. For averaged data, Student’s t test was used.
Results
Plasma glucose and insulin concentrations (Fig. 1).After over-night fast and insulin infusion, plasma glucose concentrations
were similar and plasma insulin concentrations were higher (2165 vs. 1061 mU/ml) in the patients with DM2 compared with those in the overnight-fasted nondiabetic subjects. The rate of overnight insulin infusion averaged 2.860.6 U/h and plasma glucose targets of 80–150 mg/dl were maintained with-out hypoglycemia. On the morning of study, plasma glucose averaged 10769 mg/dl in diabetic subjects and 10061 mg/dl in nondiabetic subjects. During the first euglycemic period (insu-lin adjustment period) after initiation of infusions of soma-tostatin and hormone replacement, plasma glucose concentra-tions rose slightly in nondiabetic subjects and were then gradually reduced to z 90 mg/dl (Fig. 1). Plasma glucose was similar in the diabetic and in the nondiabetic subjects during the second euglycemic and the hyperglycemic study periods (9461 vs. 9063 mg/dl, P, 0.05; 18764 vs. 18061 mg/dl, P5
NS, respectively). Similarly, the amplitude of the change in the ambient glucose concentrations generated with the hypergly-cemic clamp was identical in the two groups.
The average insulin infusion rate needed to maintain eugly-cemia during the final 30 min of the insulin adjustment period and thereafter was similar in the two groups (0.19 mU/kg per min for the diabetic patients, 0.21 mU/kg per min for the non-diabetic subjects, P5 NS). In addition, the insulin concentra-tions remained comparable between the two groups and, most important, they were not different during euglycemia and hy-perglycemia (1964 mU/ml vs. 1862 mU/ml; 1764 mU/ml vs. 1963 mU/ml, diabetic vs. nondiabetic subjects, euglycemia and hyperglycemia, respectively; all P5 NS).
Other hormones and substrates (Fig. 2, and Table I).
Plasma glucagon and growth hormone concentrations were similar in the two groups and comparable during all periods (Fig. 2). Plasma C-peptide concentrations were rapidly sup-pressed by the somatostatin and insulin infusions and they re-mained unchanged and similar in the two groups throughout the study (Fig. 2). During both periods, the plasma FFA con-centrations (Fig. 2) were higher in the diabetic than the
[image:4.612.316.556.490.698.2]abetic subjects (P, 0.05 for euglycemia; P5 0.005 for hyper-glycemia). During hyperglycemia, there was a small further drop in the plasma FFA levels in the nondiabetic group (P,
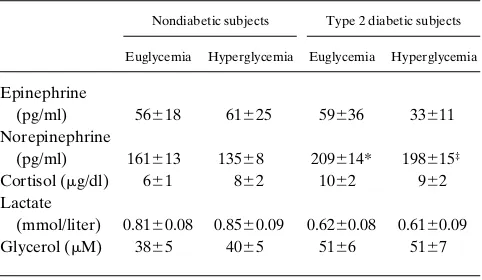
0.01), while there was no decline in plasma FFA concentra-tions in the diabetic patients. The plasma concentraconcentra-tions of the remaining hormones and substrates are summarized in Table I. Plasma epinephrine and cortisol concentrations were similar in the two groups and comparable during all study periods. Norepinephrine concentrations were slightly higher in the dia-betic subjects than the nondiadia-betic ones during euglycemia (P, 0.05) and hyperglycemia (P , 0.01). However, the plasma norepinephrine levels were unchanged by hyperglycemia in both groups. Plasma lactate and glycerol concentrations were similar and unchanged throughout the duration of the pro-tocol.
Time-control studies. To examine the time-dependent
ef-fects of our pancreatic clamp procedure per se in nondiabetic and diabetic subjects, a subgroup of subjects from both groups was restudied on a separate day. On this occasion, all infusions were identical to those used during the first study but euglyce-mia was maintained during the entire 6 h of the study. The plasma glucose concentration was similar in the two groups and remained stable throughout the duration of the study (10465 and 11369 mg/dl for the second euglycemic period, re-spectively, 9764.0 and 9968.0 mg/dl for the third euglycemic period, respectively; diabetic vs. nondiabetic subjects, P 5 NS for both periods). Plasma insulin concentrations were likewise comparable between the two groups and similar during both time periods (1768 and 1668 mU/ml for diabetic subjects, re-spectively; 1264 and 1263 mU/ml for the nondiabetic subjects, respectively, P 5 NS). The concentrations of other hormones and substrates (not shown) were also stable throughout the study and similar to those measured during the euglycemic pe-riods of the first protocol. Some glucose was infused during the last 120 min of the time control studies to maintain euglyce-mia. However, this rate of glucose infusion was quite small (z 0.3 mg/kg per min) and similar in the diabetic and nondia-betic individuals.
Rates of glucose infusion. The average rate of infusion of
glucose required to maintain the target hyperglycemic plateau during the last 60 min of the hyperglycemic period was de-creased by 58% in DM2 compared with nondiabetic
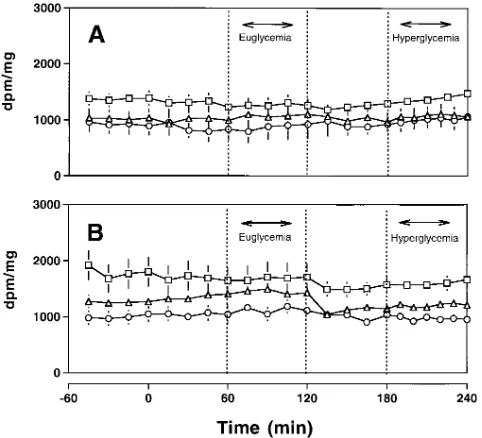
individu-als (1.0860.25 vs. 2.6060.22 mg/kg per min, diabetic vs. nondi-abetic subjects). Since there were no differences in glucose infusion rates during any of the euglycemic periods, including the third study period of the time-control protocol, this differ-ence is interpreted as indicating a marked decrease in “glucose effectiveness” in DM2. The latter impairment may underlie defects in either or both the ability of hyperglycemia at basal insulin to suppress EGP and to promote glucose uptake and metabolism in peripheral tissues. Thus, glucose isotope dilu-tion techniques were used to monitor the rates of peripheral glucose uptake and metabolism and of EGP during euglyce-mia and hyperglyceeuglyce-mia. The average glucose specific activities during euglycemia and hyperglycemia for each tracer are sum-marized in Fig. 3. Glucose specific activity was maintained con-stant after tracer equilibration, euglycemia, and hyperglycemia in each group.
Whole body glucose uptake (Fig. 4). During the
[image:5.612.59.435.61.249.2]time-con-trol studies, the rates of whole body glucose uptake were slightly (P 5 NS) lower in DM2 than in the nondiabetic group but they were unchanged during the second and third study periods in both groups (2.2360.24 vs. 2.5260.34 mg/kg per min, respectively, and 2.1160.29 vs. 2.4060.06 mg/kg per min,
Figure 2. Plasma glucagon, C-pep-tide, growth hormone, and plasma FFA concentrations in nondiabetic (open circles) and Type 2 diabetic (filled circles) subjects during eugly-cemic-hyperglycemic clamp studies.
Table I. Plasma Hormone and Substrate Concentrations during Euglycemic–Hyperglycemic Clamp Studies
Nondiabetic subjects Type 2 diabetic subjects
Euglycemia Hyperglycemia Euglycemia Hyperglycemia
Epinephrine
(pg/ml) 56618 61625 59636 33611
Norepinephrine
(pg/ml) 161613 13568 209614* 198615‡
Cortisol (mg/dl) 661 862 1062 962
Lactate
(mmol/liter) 0.8160.08 0.8560.09 0.6260.08 0.6160.09
Glycerol (mM) 3865 4065 5166 5167
[image:5.612.315.556.573.713.2]respectively, diabetic vs. nondiabetic subjects, second and third euglycemic period, respectively; P 5 NS). During eugly-cemia, whole body glucose uptake also tended to be slightly lower in the diabetic than in the nondiabetic subjects on the day of the hyperglycemic study (1.8060.08 vs. 2.2560.18 mg/ kg per min, P 5 NS). During hyperglycemia, however, whole body glucose uptake was markedly lower (30%) in the diabetic than in the nondiabetic subjects (2.6860.17 vs. 3.8160.23 mg/ kg per min, P , 0.005). Moreover, during this period, whole body glucose uptake increased by 49% (P , 0.0001) in the dia-betic subjects and by 69% (P , 0.005) in the nondiabetic indi-viduals. The effect of hyperglycemia per se on whole body glu-cose uptake was similar in the age-matched (2.1160.17 to 3.7760.15 mg/kg per min) and young (2.3960.34 to 3.8660.48 mg/kg per min) nondiabetic subgroups.
Glycolysis and glycogen synthesis (Fig. 5). Glycolysis from
plasma glucose was evaluated in the nondiabetic and diabetic subjects who received [3-3H]glucose infusions. During euglyce-mia, the glycolytic rates from plasma glucose were similar in the diabetic and in the nondiabetic groups (1.5460.14 vs. 1.5960.16 mg/kg per min, respectively; diabetic vs. nondiabetic subjects, P 5 NS). During hyperglycemia, the glycolytic rate remained unchanged in the diabetic subjects (to 1.4060.23 mg/ kg per min, P 5 NS), whereas it tended to increase in the non-diabetic subjects (to 2.0360.2 mg/kg per min, P 5 0.0768). Glycogen synthesis tended to be lower in the diabetic subjects than in the nondiabetic subjects during euglycemia (Fig. 5). However, glycogen synthesis increased significantly during hy-perglycemia in both DM2 and nondiabetic subjects (0.3660.06 to 1.5060.33 mg/kg per min, respectively, for diabetic subjects; euglycemia vs. hyperglycemia, P , 0.05; 0.6760.14 to 1.746 0.39 mg/kg per min, respectively, for the nondiabetic subjects; euglycemia vs. hyperglycemia, P , 0.05) (Fig. 5). During this
period, glycogen synthesis was completely normalized in DM2 subjects.
Glucose oxidation and lipid oxidation. Glucose oxidation
was slightly lower in the diabetic subjects during both periods but the differences were not statistically significant (0.6660.11 vs. 0.8960.19 mg/kg per min, P 5 NS, and 0.8160.14 vs. 1.1460.2 mg/kg per min, P 5 NS; diabetic vs. nondiabetic sub-jects, euglycemia and hyperglycemia, respectively). In both groups, glucose oxidation increased modestly during hypergly-cemia. Lipid oxidation was likewise similar in the two groups during both periods (0.8460.11 vs. 0.8360.14 mg/kg per min during euglycemia, 0.7460.09 vs. 0.7760.13 mg/kg per min dur-ing hyperglycemia; diabetic vs. nondiabetic subjects).
EGP (Figs. 6 and 7). During the time-control study, EGP
[image:6.612.57.298.59.278.2]was similar in the two groups during both periods. There was also a tendency toward lower EGP during the third than dur-ing the second euglycemic period in both DM2 and nondiabetic individuals. EGP was also similar in the two groups during the second euglycemic period on the day of the hyperglycemic study (1.8060.08 vs. 2.0960.19 mg/kg per min; diabetic vs. non-diabetic subjects, P 5 NS) (Fig. 6). However, during hypergly-cemia, EGP decreased by 42% in the nondiabetic whereas it remained unchanged in DM2 subjects (2.0960.19 to 1.2160.12 mg/kg per min in nondiabetic group, euglycemia vs. hypergly-cemia, P , 0.005; 1.8060.08 to 1.6860.08 mg/kg per min in the diabetic subjects, euglycemia vs. hyperglycemia, P 5 NS). Fur-thermore, when the EGP measured during the corresponding period of the time control study was compared with the hyper-glycemic period (Fig. 6), it was significantly higher in the non-diabetic (2.1360.30 vs. 1.2160.12 mg/kg per min, P , 0.05) but not in the DM2 (1.6760.17 vs. 1.6860.08 mg/kg per min, P 5 NS) group. The effect of hyperglycemia per se on EGP was similar in the age-matched (1.8060.09 vs. 1.0360.13 mg/kg per
Figure 3. Glucose specific activities during euglycemic–hyperglyce-mic clamp studies. Results from studies using [3-3H]glucose are repre-sented by square symbols, from [2-3H]glucose by circles, and from [6-3H]glucose by triangles. (A) Nondiabetic subjects; (B) Type 2 diabetic
subjects.
[image:6.612.319.555.65.344.2]min) and young (2.3760.32 vs. 1.3960.16 mg/kg per min) non-diabetic controls.
Total glucose output and glucose cycling (Fig. 7). The
changes in EGP in response to hyperglycemia were quite simi-lar in the subgroups receiving double tracer ([2-3H]- and [6-3H]glucose) infusions with 39% suppression of EGP in the nondiabetic individuals and lack of effect in the DM2 patients (Fig. 7, left). Similarly, TGO, which is a measure of the flux through glucose-6-phosphatase, was inhibited by 35% by hy-perglycemia at basal insulin in the nondiabetic individuals, while it was unchanged by hyperglycemia in the DM2 patients (Fig. 7, middle). Glucose cycling was measured as the differ-ence between TGO (measured with [2-3H]glucose) and EGP (measured with [6-3H]glucose). In both groups of subjects, glu-cose cycling (Fig. 7, right) did not change significantly during hyperglycemia (0.6160.16 vs. 0.6660.19 mg/kg per min for DM2; 0.7360.27 vs. 0.5660.17 mg/kg per min for the
nondia-betic subjects, euglycemia vs. hyperglycemia, P 5 NS for both groups). Glucose cycling expressed as a percentage of EGP was slightly increased by hyperglycemia in nondiabetic individ-uals (by 25%) and at a lesser extent in DM2 patients (by 10%;
[image:7.612.57.396.58.245.2]P 5 NS).
Figure 5. Glycolysis (open bars) and glyco-gen synthesis (filled bars) during euglyce-mic–hyperglycemic experiments. (A) Non-diabetic subjects; (B) Type 2 Non-diabetic subjects. *P , 0.05 for glycogen synthesis, euglycemia vs. hyperglycemia in both groups. See text for details.
[image:7.612.317.555.356.677.2]Figure 6. Endogenous glucose production dur-ing euglycemic–hypergly-cemic experiments (Eugly-cemia–Hyperglycemia) compared with that dur-ing time control (Euglyce-mia–Euglycemia) stud-ies. Open bars, initial period of euglycemia; filled bars, comparison study period (either eu-glycemia or hyperglyce-mia). *P , 0.005 in nondiabetic subjects, euglycemia vs. hypergly-cemia. †P , 0.05 for Type 2 diabetic vs. nondiabetic subjects during hypergly-cemia.
[image:7.612.59.211.481.736.2]Discussion
To examine the effect of hyperglycemia, independent of hor-monal signals, on the pathways of glucose production and dis-posal in DM2, we used a modification of the pancreatic and hyperglycemic clamp techniques. When euglycemia (z 90 mg/ dl) was maintained throughout the duration of the study, the infusion of somatostatin with replacement of insulin, glucagon, and growth hormone did not cause any significant change in either peripheral glucose fluxes or EGP. However, in accor-dance with previous reports (14–17), we found that in nondia-betic individuals a doubling of the plasma glucose concentration (to z 180 mg/dl) stimulated peripheral glucose uptake by 69% and suppressed EGP by 42%. Conversely, under identical ex-perimental conditions, the same degree of moderate hypergly-cemia (190 mg/dl) failed to lower EGP and less effectively promoted glucose disposal (by only 49%) in patients with DM2. Consistent with the above tracer data, the rate of glucose infu-sion required to maintain hyperglycemia was decreased by 58% in the DM2 compared with the nondiabetic individuals. These conclusions were virtually unchanged whether the glu-cose kinetics during hyperglycemia were compared with those at euglycemia on the day of the study or with those measured during the time control studies. Thus, the ability of ambient glucose (at basal insulin) to regulate glucose metabolism is se-verely impaired in this group of DM2 patients. This defect in-volves both blunted inhibition of EGP and decreased stimula-tion of glucose uptake.
In the present study the relative contributions of increased Rd and decreased EGP to “glucose effectiveness” in nondia-betic individuals were 64 and 36%, respectively. These esti-mates are quite consistent with those recently reported in non-diabetic dogs by Ader et al. (41). In fact, these authors showed that glucose-stimulated Rd accounted for 71% of overall glu-cose effectiveness in dogs. Numerous studies have clearly dem-onstrated the presence of insulin resistance in DM2 (1–5, 21– 23). The most striking feature of peripheral insulin action in patients with DM2 is perhaps the almost complete inability to stimulate glucose storage into glycogen (6–11, 21–23). This had long been suggested by indirect calorimetry and muscle biopsy data (6, 7, 9–11) and more recently directly demonstrated by nuclear magnetic resonance spectroscopy (8). In this study, the ability of an equal increment in the plasma glucose concentra-tion to promote glucose incorporaconcentra-tion into glycogen was intact in patients with DM2. Using the same experimental methodol-ogy to assess glycogen synthesis during insulin clamp studies, we also found a marked defect in the ability of insulin to acti-vate this pathway in patients with DM2 (42, 43). Thus, it ap-pears that hyperglycemia at basal insulin was capable of com-pletely normalizing glycogen synthesis in DM2. The ability of glucose per se to compensate for the defect in insulin-mediated glucose storage had been previously suggested by studies in DM2 (20–23) and in diabetic rats (44). In particular, Del Prato et al. reported marked impairment (by 75%) in glycogen depo-sition in DM2 patients during euglycemic–hyperinsulinemic clamp studies (23). However, when the DM2 subjects were studied at the same hyperinsulinemic levels but in the presence of hyperglycemia, the rate of glycogen synthesis was more than normalized. Our results demonstrate that this effect is solely an effect of glucose, and that no background of hyperinsuline-mia is needed for the compensating effect of glucose to occur. The biochemical mechanism responsible for this action is
likely to involve a selective activation of the skeletal muscle glycogen synthase by glucose (21, 22, 44).
We wish to caution against the extrapolation of the present results on the effects of hyperglycemia at basal insulin on pe-ripheral glucose uptake to the condition of hyperglycemia in the absence of insulin. During the euglycemic periods of our study (and during the time control studies) we failed to detect a significantly lower rate of glucose uptake in the DM2 com-pared with the nondiabetic subjects. However, there was a ten-dency for the glucose Rd to be lower in the DM2 group at equal levels of ambient insulin. Since skeletal muscle glucose uptake represents a relatively small fraction of whole body glu-cose uptake at basal insulin (2, 45), we certainly cannot ex-clude a contribution of muscle insulin resistance during the pancreatic clamp studies in DM2 patients. That underlying de-fects in insulin action remained suggests that some impairment in peripheral insulin action may contribute to the decrease in whole body glucose uptake in DM2 during hyperglycemia. In fact, previous work has demonstrated preserved ability of glu-cose per se to stimulate muscle gluglu-cose uptake when assessed in the presence of marked insulin deficiency (20, 45).
In an attempt to investigate the mechanism whereby hyper-glycemia inhibits EGP in nondiabetic but not in DM2 individ-uals, we also measured TGO and glucose cycling in subgroups of study subjects. The changes in EGP induced by hyperglyce-mia at basal insulin were virtually superimposable in these sub-groups compared with the entire group of subjects with a 39% decrease in EGP in the nondiabetic individuals (vs. 42% in the entire group) and no change in the DM2 patients. The rate of TGO represents the total flux through glucose-6-phosphatase, and it was suppressed by 35% in the nondiabetic individuals but unchanged in the DM2 subjects. However, the rate of glu-cose cycling (defined as the futile cycling of gluglu-cose between glucose and glucose-6-phosphate) remained unchanged in both groups. A decline in the flux through glucose-6-phos-phatase, as observed in the nondiabetic individuals during hyperglycemia, can be due to either decreased formation of 6-phosphate and/or decreased activity of the glucose-6-phosphatase complex (46). The rate of glucose cycling may help us to speculate on the prevalent mechanism. Thus, if the driving force for the decrease in TGO is a marked decrease in the formation of glucose-6-phosphate from glycogenolysis/glu-coneogenesis the rate of glucose cycling may be expected to be increased. In fact, the increase in the flux through glucokinase due to hyperglycemia would be paralleled by a marked de-crease in the formation of glucose-6-phosphate by other sources and glucose cycling should be increased. Conversely, if a decrease in glucose-6-phosphatase activity is the major deter-minant, glucose cycling may be unchanged or even decreased since the decrease in glucose-6-phosphatase activity would bal-ance the increased flux through glucokinase. Finally, the lack of suppression of TGO by hyperglycemia in DM2 is consistent with deficient inhibition of glucose-6-phosphatase activity and/ or lack of inhibition of glucose-6-phosphate formation. How-ever, the lack of increase in glucose cycling despite unchanged flux through glucose-6-phosphatase and hyperglycemia is highly suggestive that defective glucokinase activity is also a mechanism for this effect in DM2. Indeed, some of the alter-ations in glucose fluxes reported herein closely resemble those observed in animal models with decreased activity of glucoki-nase (47, 48).
(29). In fact, in a group of mildly hyperglycemic DM2 patients, glucose cycling was increased two- to threefold in the postab-sorptive state and after glucose infusion (29). In this study, we did not detect differences in the rates of glucose cycling be-tween the nondiabetic subjects and the DM2 patients, most likely because we normalized the plasma glucose concentra-tions by low-dose overnight insulin infusion. This explanation is supported by data indicating that restoration of normoglyce-mia by insulin normalized elevated rates of glucose cycling in diabetic dogs (49). Most previous studies on the effects of glu-cose infusions on TGO and gluglu-cose cycling allowed insulin and other hormones to change (29, 30). Thus, the effect of a com-bined increase in plasma glucose and insulin was examined. Under these conditions, decreased TGO and lack of suppres-sion of glucose cycling had been demonstrated. Bell et al. (17) also reported glucose-dependent decrease in TGO with lack of inhibition of glucose cycling in the presence of mild and fixed hyperinsulinemia in nondiabetic lean individuals. Our results in the nondiabetic group appear to confirm these previous findings. Together, these studies suggest that in humans hyper-glycemia inhibits EGP largely via inhibition of glucose-6-phos-phatase in the presence of increased flux through glucokinase. Furthermore, the present results suggest that the actions of ambient glucose on both these processes—fluxes through glu-cokinase and glucose-6-phosphatase—are impaired in DM2.
There remains a great deal of controversy regarding the role of glucose or hyperglycemia in the physiological regula-tion of EGP and hepatic glucose uptake, particularly in states of altered glucose tolerance. Defective stimulation of splanch-nic glucose uptake during oral glucose administration has been reported in DM2 in most studies (50–52). Examining the meta-bolic effects of postprandial glycemia in DM2, Alzaid et al. (53) reported that the ability of glucose per se to inhibit EGP was preserved in subjects with DM2. However, the effect of hyperglycemia was examined during moderate hyperinsuline-mia (mimicking a postprandial insulin profile). Under these conditions, insulin infusion had already caused a significant suppression of EGP, even prior to the induction of hyperglyce-mia. More recently Basu et al. (26) directly examined the regu-lation of glucose effectiveness in DM2 at basal insulin. Their experimental approach differed from ours in several features. In particular, Basu et al. infused glucose at a fixed rate during pancreatic clamp conditions in DM2 and nondiabetic individu-als. That the increment in the plasma glucose concentration was much higher in the DM2 patients than in the nondiabetic subjects indicated a severe defect in glucose effectiveness in the former. This finding is quite consistent with our observa-tion of a z 60% decrease in the rates of glucose infusion re-quired to maintain the same hyperglycemic plateau in DM2. Since in their study, the increment in the plasma glucose con-centrations was higher in the DM2 subjects than in the nondia-betic individuals, mathematical modeling of the results was used to estimate the effects of equivalent increases in the am-bient glucose concentrations on Rd and EGP in the two groups. The latter calculation revealed decreased ability of glucose to regulate its own disposal. Furthermore, while it did not reach statistical significance, an z 30% decrease in the ability of glucose to inhibit EGP was also demonstrated in DM2. Thus, despite important differences in the experimental design, the major conclusions of our study and of this previous work are consistent.
The plasma FFA concentrations were higher in the DM2
than those in the nondiabetic group during the euglycemic and the hyperglycemic periods of the protocols. Can these differ-ences in plasma FFA concentrations account for the lack of glucose-mediated suppression of glucose production in DM2? Elevations in the circulating levels of FFA and/or in the rates of lipid oxidation can antagonize the actions of insulin on both glucose production and uptake (54–59). Of note, in this study, plasma FFA concentrations did not differ between euglycemic and hyperglycemic periods in the diabetic subjects. Further-more, the rates of glucose and lipid oxidation were comparable in the two groups and during all time periods. Thus, if the cir-culating FFA exerted a stimulatory action on EGP in the DM2 group, this effect was selective for the hyperglycemic period, since it was not observed during either the time control studies or the euglycemic periods. The latter finding suggests that dif-ferences in the circulating FFA levels within this relatively low range did not play a major role in the regulation of EGP in the presence of basal insulin (59). Overall, while it is unlikely that differences in circulating FFA would account for the complete lack of inhibition of EGP we observed in the diabetic subjects, we cannot exclude that the presence of moderately elevated FFA levels contributed to our findings. Further studies de-signed to specifically address the role of plasma FFA in glu-cose-induced inhibition of EGP will be needed to conclusively address this possibility.
Some additional comments on specific features of our ex-perimental design are warranted. We examined the effect of hyperglycemia on hepatic glucose fluxes in DM2 individuals after overnight “basal” insulinization. While this procedure is needed to generate normoglycemia in DM2 in the absence of increases in counterregulatory hormones, it may be argued that overnight insulinization is likely to reverse some of the metabolic defects of DM2. In particular, it is evident that in our patients the rates of glucose cycling and EGP were nor-malized. While the plasma insulin concentration was higher in DM2 than in nondiabetic individuals before initiation of the pancreatic clamp procedure, ambient insulin and insulin re-quirements were similar in the two groups thereafter. This was again observed over 4 h on the day of the hyperglycemic chal-lenge and over 6 h during the time-control study. Thus, it ap-pears that the action of insulin on EGP was normalized by overnight insulin infusion when examined under identical hor-monal conditions. It should also be pointed out that while we have attempted to “reconstruct” a quasi-basal hormonal con-dition during our pancreatic clamp procedure, it is clear that true basal hormonal conditions cannot be generated with this protocol in humans. Since insulin and glucagon were infused systemically, it is likely that a state of mild peripheral hyperin-sulinemia prevailed during the studies. It is also likely that the portal ratio of glucagon to insulin may have been slightly in-creased compared with true basal conditions. Overall, while we found some comfort in the observation that the rates of glucose uptake and EGP were very similar to those seen under basal postabsorptive conditions, we cannot rule out the possi-bility that the small increase in circulating insulin from the am-bient level may have sensitized the liver to subsequent sup-pression by hyperglycemia in the nondiabetic individuals. Most important, our experimental design generated stable near-basal hormonal conditions during either hyperglycemia or euglycemia and thus allowed us to assess the direct effects of changes in ambient glucose per se in the same individuals.
no-tion that glucose effectiveness is decreased in DM2. Under basal insulin conditions, this is due to both lack of glucose-mediated suppression of EGP and diminished stimulation of glucose uptake. The mechanism for the impaired regulation of EGP by glucose is likely to involve defective modulation of the fluxes through glucokinase and glucose-6-phosphatase. Con-versely, glycogen synthesis in Type 2 diabetes is exquisitely sen-sitive to changes in plasma glucose concentrations in the pres-ence of near-basal insulin levels.
Acknowledgments
The authors thank Robin Sgueglia and Anne Thomashunis, R.N., for their technical assistance.
This work was supported by grants from the National Institutes of Health (DK-45024 and DK-48321), the American Diabetes Associa-tion and the General Clinical Research Center (RR-12248), and by the Albert Einstein Diabetes Research and Training Center (DK-20541).
References
1. Kimmerling, G., C. Javorsky, J.M. Olefsky, and G. Reaven. 1976. Dem-onstration of insulin resistance in untreated adult-onset diabetic subjects with fasting hyperglycemia. Diabetes. 25:673–678.
2. DeFronzo, R.A. 1988. The triumvirate. B-cell, muscle, liver. A collusion responsible for NIDDM. Diabetes. 37:667–687.
3. Bogardus, C., S. Lillioja, B.V. Howard, G. Reaven, and D. Mott. 1984. Relationships between insulin secretion, insulin action, and fasting plasma glu-cose concentration in nondiabetic and noninsulin-dependent diabetes mellitus. J. Clin. Invest. 74:1238–1246.
4. Kolterman, O.G., R.S. Gray, J. Griffin, P. Burstein, J. Insel, J.A. Scarlett, and J.M. Olefsky. 1981. Receptor and postreceptor defects contribute to the in-sulin resistance in noninin-sulin-dependent diabetes mellitus. J. Clin. Invest. 68: 957–959.
5. Rizza, R.A., L.J. Mandarino, and J.E. Gerich. 1981. Mechanism and sig-nificance of insulin resistance in noninsulin-dependent diabetes mellitus. Dia-betes. 30:990–995.
6. Thorburn, A.W., B. Gumbiner, F. Bulacan, P. Wallace, and R.R. Henry. 1990. Intracellular glucose oxidation and glycogen synthase activity are reduced in non-insulin-dependent (Type II) diabetes independent of impaired glucose uptake. J. Clin. Invest. 85:522–529.
7. Young, A.A., C. Bogardus, D. Wolfe-Lopez, and D.M. Mott. 1988. Mus-cle glycogen synthesis disposition of infused glucose in humans with reduced rates of insulin-mediated carbohydrate storage. Diabetes. 37:303–308.
8. Shulman, G.I., D.L. Rothman, T. Jue, P. Stein, R.A. DeFronzo, and R.G. Shulman. 1990. Quantitation of muscle glycogen synthesis in normal subjects and subjects with non-insulin-dependent diabetes by 13C nuclear magnetic reso-nance spectroscopy. N. Engl. J. Med. 322:223–228.
9. Wright, K.S., H. Beck-Nielsen, O.G. Kolterman, and L.J. Mandarino. 1988. Decreased activation of skeletal muscle glycogen synthase by mixed-meal ingestion in NIDDM. Diabetes. 37:436–440.
10. Bogardus, C., L. Lillioja, K. Stone, and D. Mott. 1984. Correlation be-tween muscle glycogen synthase activity and in vivo insulin action in man. J. Clin. Invest. 73:1186–1190.
11. Lillioja, S., D.M. Mott, J.K. Zawadzki, A.A. Young, W.G. Abbott, and C. Bogardus. 1986. Glucose storage is a major determinant of in vivo “insulin resistance” in subjects with normal glucose tolerance. J. Clin. Endocrinol. Metab. 62:922–927.
12. Soskin, S., and R. Levine. 1946. Carbohydrate Metabolism. University of Chicago Press, Chicago. 247–263.
13. Glinsman, W.H., E.P. Hern, and A. Lynch. 1969. Intrinsic regulation of glucose output by rat liver. Am. J. Physiol. 216:698–703.
14. Sacca, L., R. Hendler, and R.S. Sherwin. 1979. Hyperglycemia inhibits glucose production in man independent of changes in glucoregulatory hor-mones. J. Clin. Endocrinol. Metab. 47:1160–1163.
15. Shulman, G.I., J.E. Lijenquist, P.E. Williams, W.W. Lacy, and A.D. Cherrington. 1978. Glucose disposal during insulinopenia somatostatin-treated dogs. The roles of glucose and glucagon. J. Clin. Invest. 62:487–491.
16. Shulman, G.I., W.W. Lacy, J.E. Lijenquist, U. Keller, P.E. Williams, and A.D. Cherrington. 1980. Effect of glucose, independent of changes in insulin and glucagon secretion, on alanine metabolism in the conscious dog. J. Clin. In-vest. 65:496–505.
17. Bell, P.M., R.G. Firth, and R.A. Rizza. 1986. Effects of hyperglycemia on glucose production and utilization in humans. Measurements with [23H]-,
[33H]-, and [614C]-glucose. Diabetes. 35:642–648.
18. Ader, M., G. Pacini, Y.J. Ysug, and R.N. Bergman. 1985. Importance of glucose per se to intravenous glucose tolerance. Comparison of the minimal model prediction with direct measurements. Diabetes. 34:1092–1103.
19. Ferrannini, E., L. Locatelli, and J.P. Felber. 1989. Differential effects of insulin and hyperglycemia on intracellular glucose dispositions in humans. Me-tabolism. 38:459–65.
20. Capaldo, B., D. Santoro, G. Riccardi, N. Perrotti, and L. Sacca. 1986. Direct evidence for a stimulatory effect of hyperglycemia per se on peripheral glucose disposal in type 2 diabetes. J. Clin. Invest. 77:1285–1290.
21. Vaag, A., P. Dambso, O. Hother-Nielsen, and H. Beck-Nielsen. 1992. Hyperglycemia compensates for the defects in insulin-mediated glucose metab-olism and in the activation of glycogen synthase in the skeletal muscle of pa-tients with type 2 diabetes mellitus. Diabetologia. 35:80–88.
22. Kelley, D.E., and L.J. Mandarino. 1990. Hyperglycemia normalizes in-sulin-stimulated skeletal muscle glucose oxidation and storage in noninsulin-dependent diabetes mellitus. J. Clin. Invest. 86:1999–2007.
23. Del Prato, S., R.C. Bonadonna, E. Bonora, G. Gulli, A. Solini, M. Shank, and R.A. DeFronzo. 1993. Characterization of cellular defects of insulin action in Type 2 (non-insulin-dependent) diabetes mellitus. J. Clin. Invest. 91: 484–494.
24. Welch, S., S.S.P. Gebhart, R.N. Bergman, and L.S. Phillips. 1990. Mini-mal model analysis of intravenous glucose tolerance test-derived insulin sensi-tivity in diabetic subjects. J. Clin. Endocrinol. Metab. 71:1508–1518.
25. Saad, M.F., R.L. Anderson, A. Laws, R.M. Watanabe, W.W. Kades, Y.-D.I. Chen, R.E. Sands, D. Pei, P.J. Savage, and R.N. Bergman. 1994. A com-parison between the minimal model and the glucose clamp in the assessment of insulin sensititvity across the spectrum of glucose tolerance. Diabetes. 43:1114– 1121.
26. Basu, A., A. Caumo, F. Bettini, A. Gelisio, A. Alzaid, C. Cobelli, and R.A. Rizza. 1997. Impaired basal glucose effectiveness in NIDDM. Contribu-tion of defects in glucose disappearance and producContribu-tion, measured using an op-timized minimal model independent protocol. Diabetes. 46:421–432.
27. DeFronzo, R.A., E. Ferrannini, R. Hendler, P. Felig, and J. Wahren. 1983. Regulation of splanchnic and peripheral glucose uptake by insulin and hy-perglycemia in man. Diabetes. 32:35–45.
28. Ludvik, B., J.J. Nolan, A. Roberts, J. Baloga, M. Joyce, J.M. Bell, and J.M. Olefsky. 1995. A noninvasive method to measure splanchic glucose uptake after oral glucose administration. J. Clin. Invest. 95:2232–2238.
29. Efendic, S., S. Karlander, and M. Vranic. 1988. Mild type II diabetes markedly increases glucose cycling in the post-absorptive state and during glu-cose infusion irrespective of obesity. J. Clin. Invest. 81:1953–1961.
30. Miyoshi, H., G.I. Shulman, E.J. Peters, M.H. Wolfe, D. Elahi, and R.R. Wolfe. 1988. Hormonal control of substrate cycling in humans. J. Clin. Invest. 81:1545–1555.
31. Shamoon, H., S. Friedman, C. Canton, L. Zacharowicz, M. Hu, and L. Rossetti. 1994. Increased epinephrine and skeletal muscle responses to hy-poglycemia in noninsulin-dependent diabetes mellitus. J. Clin. Invest. 93:2562– 2571.
32. Finegood, D.T., R.N. Bergman, and M. Vranic. 1987. Estimation of en-dogenous glucose production during hyperinsulinemic-euglycemic glucose clamp: comparison of unlabeled and labeled glucose infusates. Diabetes. 36: 914–924.
33. Dunn, A., J. Katz, S. Golden, and M. Chenoweth. 1976. Estimation of glucose turnover and recycling in rabbits using various (3H, 14C) labels. Am. J.
Physiol. 230:1159–1162.
34. Sotsky, M.J., S. Shilo, and H. Shamoon. 1989. Regulation of counterreg-ulatory hormone secretion in man during exercise and hypoglycemia. J. Clin. Endocrinol. Metab. 68:9–17.
35. Gawehn, K. 1986. D-Lactate. In Methods of Enzymatic Analysis. H. Bergmeyer and M. Gassl, editors. Academic Press, Inc., New York. 6:583–592.
36. Hawk, P. 1947. The Kjeldahl method. In Practical Physiological Chemis-try. 12th ed. Toronto, Blakiston. 814–822.
37. Steele, R. 1959. Influences of glucose loading and of injected insulin on hepatic glucose output. Ann. NY Acad. Sci. 82:420–430.
38. Rossetti, L., and A. Giaccari. 1990. Relative contribution of glycogen synthesis and glycolysis to insulin-mediated glucose uptake. A dose-response euglycemic clamp study in normal and diabetic rats. J. Clin. Invest. 85:1785– 1792.
39. Rossetti, L., Y.-T. Lee, J. Ruiz, S. Aldridge, H. Shamoon, and G. Boden. 1993. Quantitation of glycolysis and skeletal muscle glycogen synthesis in hu-mans. Am. J. Physiol. 265:E761–E769.
40. Lusk, G. 1924. Animal calorimetry: analysis of the oxidation of mixtures of carbohydrate and fat. J. Biol. Chem. 59:41–42.
41. Ader, M., T.-C. Ni, and R.N. Bergman. 1997. Glucose effectiveness as-sessed under dynamic and steady-state conditions. Comparability of uptake versus production components. J. Clin. Invest. 99:1187–1199.
42. Cohen, N., M. Halberstam, P. Shlimovich, C.J. Chang, H. Shamoon, and L. Rossetti. 1995. Oral vanadyl sulfate improves hepatic and peripheral insulin sensitivity in patients with non-insulin dependent diabetes mellitus. J. Clin. In-vest. 95:2501–2509.
va-nadyl sulfate enhances hepatic and peripheral insulin sensitivity in obese pa-tients with NIDDM, but not in non diabetic obese subjects. Diabetes. 45:659– 666.
44. Farrace, S., and L. Rossetti. 1992. Hyperglycemia markedly enhances skeletal muscle glycogen synthase activity in diabetic, but not in normal con-scious rats. Diabetes. 41:1453–1463.
45. Baron, A.D., G. Brechtel, P. Wallace, and S.V. Edelman. 1988. Rates and tissue sites of non-insulin- and insulin-mediated glucose uptake in humans. Am. J. Physiol. 255:E769–E774.
46. Rossetti, L., A. Giaccari, N. Barzilai, K. Howard, G. Sebel, and M. Hu. 1993. Mechanism by which hyperglycemia inhibits hepatic glucose production in conscious rats. Implications for the pathophysiology of fasting hyperglyce-mia. J. Clin. Invest. 92:1126–1134.
47. Barzilai, N., M. Hawkins, I. Angelov, M. Hu, and L. Rossetti. 1996. Glu-cosamine-induced inhibition of liver glucokinase impairs the ability of hyper-glycemia to suppress endogeneous glucose production. Diabetes. 45:1329–1335. 48. Rossetti, L., W. Chen, M. Hu, M. Hawkins, N. Barzilai, and S. Efrat. 1997. Abnormal regulation of hepatic glucose production by hyperglycemia in mice with a disrupted glucokinase allele. Am. J. Physiol. 273:E743–E750.
49. Shi, Z.Q., A. Giacca, S. Fisher, H. Vidal, G. van de Werve, and M. Vranic. 1994. Importance of substrate changes in the decrease of hepatic glu-cose cycling during insulin infusion and declining glycemia in the depancreatec-tomized dog. Diabetes. 43:1284–1290.
50. Felig, P., J. Wahren, and R. Hendler. 1978. Influence of maturity-onset diabetes on splanchnic glucose balance after oral glucose ingestion. Diabetes. 27:121–126.
51. Firth, R., P. Marsh, I. Hansen, and R. Rizza. 1986. Postprandial hyper-glycemia in patients with non-insulin-dependent diabetes mellitus: role of
he-patic and extrahehe-patic tissues. J. Clin. Invest. 77:1525–1532.
52. Ludvik, B., J.J. Nolan, A. Roberts, J. Baloga, M. Joyce, J.M. Bell, and J.M. Olefsky. 1997. Evidence for decreased splanchic glucose uptake after oral glucose administration in non-insulin-dependent diabetes mellitus. J. Clin. In-vest. 100:2354–2361.
53. Alzaid, A.A., S.F. Dinneen, D.J. Turk, A. Caumo, C. Cobelli, and R.A. Rizza. 1994. Assessment of insulin action and glucose effectiveness in diabetic and nondiabetic humans. J. Clin. Invest. 94:2341–2348.
54. Rebrin, K., G.M. Steil, L. Getty, and R.N. Bergman. 1995. Free fatty acid as a link in the regulation of hepatic glucose output by peripheral insulin. Diabetes. 44:1038–1045.
55. Rebrin, K., G.M. Steil, S.D. Mittelman, and R.N. Bergman. 1996. Causal linkage between insulin suppression of lipolysis and suppression of liver glucose output in dogs. J. Clin. Invest. 98:741–749.
56. Sindelar, D.K., C.A. Chu, M. Rohlie, D.W. Neal, L.L. Swift, and A.D. Cherrington. 1997. The role of fatty acids in mediating the effects of peripheral insulin on hepatic glucose production in the conscious dog. Diabetes. 46:187– 196.
57. Lewis, G.F., M. Vranic, P. Harley, and A. Giacca. 1997. Fatty acids me-diate the acute extrahepatic effects of insulin on hepatic glucose production in humans. Diabetes. 46:1111–1119.
58. Boden, G., X. Chen, J. Ruiz, J.V. White, and L. Rossetti. 1994. Mecha-nisms of fatty acids induced inhibition of glucose uptake. J. Clin. Invest. 93: 2438–2446.