Enhancing the Automated Quality Inspection in
Manufacturing Process through Parameter
Optimization
Muhamad Arfauz A Rahman1,*, Muhamad Hakim Rahman1, Effendi Mohamad1, Azrul Azwan Abdul Rahman1, Mohd Rizal Salleh1, John P. T. Mo2
1
Faculty of Manufacturing Engineering, Universiti Teknikal Malaysia Melaka (UTeM), Malaysia
2
School of Engineering, RMIT University, Australia
Received June 27, 2019; Revised December 12, 2019; Accepted December 23, 2019
Copyright©2019 by authors, all rights reserved. Authors agree that this article remains permanently open access under the terms of the Creative Commons Attribution License 4.0 International License
Abstract
This manuscript presents the optimization work of vision inspection at the semiconductor industry, focusing on the top view vision inspection. The top view vision inspection includes checking the tip to tip, lead to lead and laser marking of the product. In this work, the focus was on enhancing the potential vision parameter that causes over-rejection. The work started with the identification of the vision parameter that contributes to the over-rejection by the vision system. Three factors have been identified, which are the lead shutter time, laser shutter time and brightness value. All factors were tested using the design expert software. A comprehensive data collection was conducted to gather essential measurements by the vision system. Upon completion of the data collection, the optimization of the parameters was done using the full factorial method. At the end of this work, the optimized parameter setting has been validated using the dedicated machine, and monitoring of the result has been conducted based on the defined timeline. Post the optimized parameter setting, the vision was able to capture measurement value similar to the drawing value within the acceptable tolerance. This work has significantly reduced over-rejection and has indirectly improved the production rate.Keywords
Vision Inspection, Over Rejection, Optimization, Quality, Automation, Manufacturing1. Introduction
Semiconductor components for the automotive application have the strictest requirement for quality and functionality compared with other consumer applications
[1-3]. One of the main components is the microchip. Prior to forwarding the microchip to the market, each unit will have to undergo various quality inspections and testing process within the production line. All units must pass the set standard to ensure its quality and its ability to operate at the expected performance [4].
The automated vision inspection system is a typical process used in the semiconductor industry to check the quality of the unit [5]. Nevertheless, another issue has arisen from this process. The prevailing situation usually occurs when the vision system is not able to capture the correct value during the process. It will cause a good unit to be judged as a reject unit by the vision system during mass production. This situation has unnecessarily brought over rejection and indirectly brought losses or yield loss to the company. Although there is an allowable tolerance for losses, exceeding the limit is unacceptable. The trend of over-rejection rate must be monitored to ensure it will not exceed the allowable yield loss limit which defines every business year. Therefore, an effort to reduce the yield loss is essential and at the same time to bring the overall lot a better yield as well as indirectly generate profit to the company.
2. Review of Relevant Works
Figure 1. The basic setup of a vision system [11]
2.1. Manual Inspection
The manual inspection system is 100% dependent on human judgment towards the product during the inspection. Manual inspection has resulted in a high variability due to several factors that affect human visual inspection [7]. Operator ability to detect the defect during the production is vital as the process to detect the running defect at the production line is human dependent [8].
2.2. Semi-auto Inspection
Semi-auto inspection systems consist of automated mechanisms that are introduced during the inspection by the operator to expedite the manual inspection. The judgment of the process still depends on the operator capability and ability to detect the defect present in the product [9]. This technique is introduced purposely to increase the production capacity with a lower cost investment due to a simple system integrated with manual inspection.
2.3. Automated Inspection
Automated inspection system runs automatically with the presence of the operator, only to monitor the machine performance. Automated inspection and process control can ensure that products of the highest quality come off the production line [10]. Figure 1 shows an example of the basic setup of the automatic vision system.
Automated inspection can eliminate human factors that affect reliability such as fatigue and inconsistency of judgment, and create a more consistent inspection process with repeatable inspection results. Although it can significantly improve the reliability of the process, it may, however, lead to other quality issues like the unnecessary rejection of a good product.
3. Methodology
This section focuses on the method used to solve the vision inspection issue to improve the automated quality of vision inspection. It involves defining, selecting, analysing and deciding the best setting for vision parameter.
3.1. Investigation of the System
At the start of the work, the current process has been observed and investigated. In common practice, the process engineer will attend to the machine during system downtime and fine-tune the vision parameter to get a better image for image processing. Based on the investigation of the current system during daily engineering activity in the production line, the problem occurred due to the image captured was not correctly detected, causing the system to identify the image as a reject unit. Based on the current issues of the vision system, optimization of the parameters to get the better image for image processing and measurement is required. Over rejection might occur if the system processes the wrong image.
3.2. Preparation of Golden Unit
Upon completion of the revision of the previous work and on-site study during actual machine running, the next task is to prepare the golden sample for testing. This golden sample will be used as a reference unit during vision testing after parameter optimization is conducted. The unit will be built from Trim and Form machine (TNF) using a dummy lot and known as a golden unit for parameter testing. This golden unit will be going through a scope measurement and compared to unit drawing specification before being used as a golden unit. Figure 2 shows three measurements point for the unit; point 1 and 14, point 4 and 11 and point 7 and 8 as sample unit dimensions through measurement scope.
[image:2.595.309.536.569.725.2]Measurement of the golden sample unit is very crucial. It must be close or exact to the unit drawing specification. This condition is to ensure that this golden unit can be used as a reference unit during vision testing. The result from the vision measurement will be compared with the result of measurement by measurement scope. Ideally, the measurement of the tip to tip should be 9.240 mm with tolerance ±0.400 mm, which means that the acceptable reading range can be from minimum 8.840 mm to maximum 9.640 mm. A scope measurement will be conducted to ensure sample tip to tip measurement is within the specification based on unit drawing. Table 1 below shows the measurement of golden sample unit. Through measurement scope, the sample will undergo three-time measurement at three different points, or lead pair and average all three measurement result will be used as a reference value.
Table 1. Golden Sample measurement result
Unit Measurement value Average (mm) Scope (mm)
lead 1-14 9.271
9.255
lead 4-11 9.246
lead 7-8 9.248
3.3. Identifying the Parameters
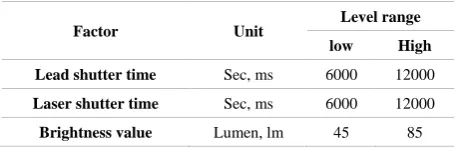
In parallel to sample preparation, the optimized parameter needs to be identified for vision optimization, and from the investigation stage parameter to be optimized will be identified for the design of experiment (DOE). Table 2 shows three factors already been identified with their level range. All parameters can be changed at the vision system panel of the machine.
Table 2. The factor with low and high level
Factor Unit Level range low High Lead shutter time Sec, ms 6000 12000
Laser shutter time Sec, ms 6000 12000
Brightness value Lumen, lm 45 85
The difference of these two shutter time is, lead shutter time will capture lead area and laser shutter time will capture the package surface of the inspection device. The importance of this shutter time is to determine the allowable time that inspection unit will expose to the light before the vision camera captures the image.
3.4. Experimental Setup
Each value presented is based on the value from DOE, and the response of each run is shown in table 3. The output response for each run was recorded for the identified factor.
During the raw data collection, the vision system will
[image:3.595.60.289.524.599.2]provide seven measurements reading for each lead pair. When performing measurement readout, vision camera performance will be assumed similar for each setup and only one pair of measurement will be taken for analysis and optimized further where pair of lead-1 and lead-14 are selected for every golden unit raw data collection.
Table 3. Setup for the three identified factors
Run
Factor 1 Factor 2 Factor 3 Laser Shutter
Time (ms)
Lead Shutter Time (ms)
Brightness value (lm)
1 10000 12000 50
2 16000 4000 20
3 4000 4000 80
4 4000 20000 80
5 4000 4000 20
6 16000 20000 80
7 16000 20000 20
8 16000 4000 80
9 4000 20000 20
3.5. Testing and Confirmation
At this stage, the optimized parameter will be identified using the DOE method. DOE will suggest the best combination parameter to be applied to the vision system for testing. The identified parameter value will be tested, and the process of capturing the image will be conducted using the golden sample prepared before. To perform the experimental, Full Factorial method has been identified as a suitable method to find the optimal parameter value. From three-factor selected with two levels for each factor, the numbers of the combination will be 2^3 = 8 and combination will be tested in this experiment run. All the parameter value combination will be tested on the machine, and the responses from the machine will be recorded and later result for each run will be evaluated for the optimize parameter value to be used for final testing and to prove the suggested parameter can be workable.
4. Results and Discussion
The analyses of the response to access the impacts of the tip to tip measurement from the selected factor (laser shutter time, lead shutter time and brightness) were carried out by using the ANOVA. The most critical consideration in ANOVA analysis is the F-value of the parameter, whereby if the F-value is lesser than 0.05, it shows that the parameter has a significant effect on the response, meanwhile the range for not significant is 0.1 and above.
4.1. ANOVA Analysis
mm to 9.271 mm, meaning the ratio of the max and min is 1.108 mm. A ratio greater than 10 usually indicates a transformation is required. For ratios less than 3, the power transformation has a little effect. In this case, the result shows that the power transformation has a lesser effect.
Table 4. Result of vision measurement
Run
Factor 1 Factor 2 Factor 3
Tip to Tip (mm) Laser
Shutter Time (ms)
Lead Shutter Time (ms)
Brightness value (lm)
1 10000 12000 50 9.266
2 16000 4000 20 9.271
3 4000 4000 80 9.258
4 4000 20000 80 8.533
5 4000 4000 20 9.268
6 16000 20000 80 8.758
7 16000 20000 20 8.368
8 16000 4000 80 9.261
9 4000 20000 20 8.476
The results show that the relationship between laser shutter time, lead shutter time and brightness:
1. Laser Shutter Time (ms) – No significant impact on the tip to tip measurement.
2. Lead Shutter Time (ms) – Increase in the lead shutter time will increase tip to tip measurement.
3. Brightness (lm) – Increase in brightness lumen value, will increase tip to tip measurement.
4.2. Scope VS Vision Measurement
[image:4.595.306.536.256.465.2]Each golden sample unit will go through manual scope measurement and vision measurement to compare the tip to tip measurement. Table 5 shows the comparison of the manual scope measurement and vision measurement.
Table 5. Manual measurement versus vision measurement
Unit Measurement value Scope (mm) Vision (mm)
lead 1-14 9.271 9.302
lead 4-11 9.246 9.256
lead 7-8 9.248 9.260
For manual scope measurement, human factors will be assumed as zero and vision measurement setup during this activity is shown in table 6.
Table 6. The vision measurement setting
Parameter Value
Vision machine 1
Laser Shutter, ms 9000
Lead Shutter, ms 10000
Brightness, lm 55
Three measurement points are taken to compare the readout of each method, observed there a different reading between scope and vision measurement but is still within the specification limit and control limit.
4.3. Optimized Parameter
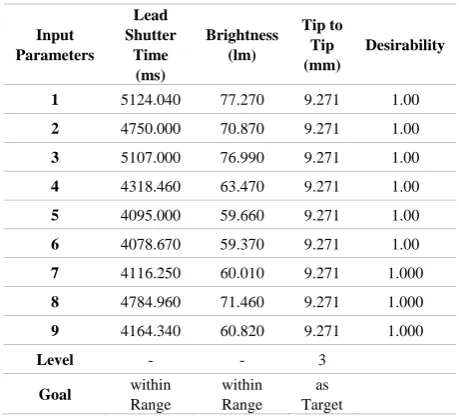
[image:4.595.62.289.546.621.2]From the data collected, the DOE tools will propose the solution of optimizing parameter that is suitable to be used to achieve the desired goal or target that has been set based on the golden samples that go through experimental activity previously. Table 7 shows the solution or option to be chosen with the desirability to achieve the goal.
Table 7. Optimum parameter combination
Input Parameters
Lead Shutter
Time (ms)
Brightness (lm)
Tip to Tip (mm)
Desirability
1 5124.040 77.270 9.271 1.00
2 4750.000 70.870 9.271 1.00
3 5107.000 76.990 9.271 1.00
4 4318.460 63.470 9.271 1.00
5 4095.000 59.660 9.271 1.00
6 4078.670 59.370 9.271 1.00
7 4116.250 60.010 9.271 1.000
8 4784.960 71.460 9.271 1.000
9 4164.340 60.820 9.271 1.000
Level - - 3
Goal within
Range
within Range
as Target
Based on the optimized solution provided, it can be concluded that a standard range can be identified for lead shutter time where the range is from 4000 ms to 6000 ms and for brightness value is from 47 lm to 80 lm. All the parameter solution fulfilled 100 per cent desirability of the target for each unit.
4.4. Validation of Optimized Parameter
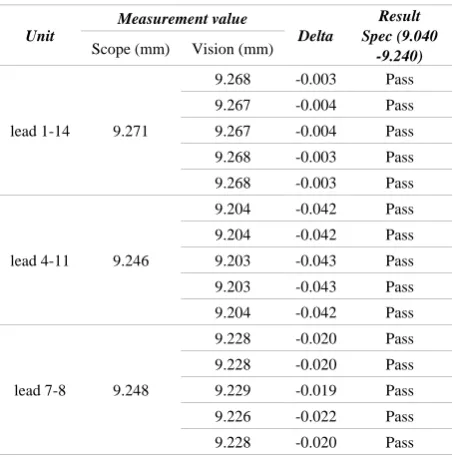
The identified new optimum parameter being tested to the vision inspection system, using a similar sample from the golden unit or reference unit, the result of the measurement has been compared. Table 8 shows the result of vision inspection systems compared to the scope measurement reading for a pair of lead 1-14, lead 4-11 and lead 7-8.
[image:4.595.60.289.682.756.2]Table 8. Measurement result with optimize parameter
Unit
Measurement value
Delta
Result Spec (9.040
-9.240) Scope (mm) Vision (mm)
lead 1-14 9.271
9.268 -0.003 Pass
9.267 -0.004 Pass
9.267 -0.004 Pass
9.268 -0.003 Pass
9.268 -0.003 Pass
lead 4-11 9.246
9.204 -0.042 Pass
9.204 -0.042 Pass
9.203 -0.043 Pass
9.203 -0.043 Pass
9.204 -0.042 Pass
lead 7-8 9.248
9.228 -0.020 Pass
9.228 -0.020 Pass
9.229 -0.019 Pass
9.226 -0.022 Pass
9.228 -0.020 Pass
From the observation, optimize measurement result showed that the middle lead will give a slightly lower reading for the golden samples. This issue can be further studied for future recommendation.
5. Conclusions
At the earlier stage of the work, it was observed that the machine was suffering from vision over-rejection during the inspection, which had caused a yield loss and machine interruption. The engineer commonly conducted immediate action by changing various parameters when the problem occurs. Through this work, experimental work has been conducted and setup using DOE tools to acquire the best parameter setting for the process. Three parameters have been identified, and appropriate testing has been conducted to acquire the optimized value. It was found that one of the parameter, the laser shutter time, did not influence the measurement. The other two factors have been proceeded with DOE to identify the optimize parameter value and define the range of the optimized parameter value. Once the parameters have been identified with the define ranges, this value was validated in the real production by capturing the data using the golden samples. In summary, the optimized parameter value for each tested unit can be concluded that the best solution to apply is within the range of 4000 ms to 6000 ms for lead shutter time and 47 lm to 80 lm for lead brightness. The results showed that the vision inspection systems were able to capture tip to tip measurement precisely and one of the measurements achieved zero deviation in comparison with the scope measurement.
Acknowledgements
The authors are grateful to the Malaysian government
and Universiti Teknikal Malaysia Melaka (UTeM) for
funding the research via grant
FRGS/1/2017/TK03/FKP-SMC/F00342, including providing materials support as well as other useful information.
REFERENCES
[1] E. Mohamad, T. Ito, M.R. Salleh, and N.A. Nordin, Simulation study towards productivity improvement for assembly line. Journal of Human Capital Development (JHCD), 5(2), (2012), pp.59-70.
[2] E. Mohamad, M.A. Ibrahim, L. Sukarma, A.S. Shibghatullah, M.A. A Rahman, M.R. Salleh, Improved decision making in lean manufacturing using simulation-based approach, International Journal of Agile Systems and Management, 10(1), 2017, pp 34-48.
[3] M.A. A Rahman, N. S. Osman, C. H. Boon, G. L. T. Poh, A.A.A. Rahman, B. M. B. Mohamad, S. H. Kamsani, E. Mohamad, Z. A. Zaini, and M. F. A. Rahman, “Configuring Safe Industrial Robot Work Cell in Manufacturing Industry,” J. Adv. Manuf. Technol., vol. 10, no. 2, pp. 125 -136, 2016.
[4] N.S. Osman, M.A. A Rahman, A. A. Abdul Rahman, B. M. B. Mohamad, and S.H. Kamsani, Optimization of multiple robot configuration pattern using shape variant approach, in Innovative Research and Industrial Dialogue, IRID’16, vol.1, pp. 1-2, 2016.
[5] S.H. Leang, W. H.W. Mahmood and M.A. A Rahman, (2018). The impact of manufacturing complexity drivers on performance-a preliminary study. IOP Conf. Ser.: Mater. Sci. Eng. 328
[6] L. Qi, S. Wang, Y. Zhang, Y. Sun, and X. Zhang, "Quality inspection guided laser processing of irregular shape objects by stereo vision measurement: application in badminton shuttle manufacturing," Optimization Engineering, Volume 54(11), 2015.
[7] Melchore, J.A. Sound Practices for Consistent Human Visual Inspection. AAPS PharmSciTech Volume 12, 2011, Pages 215-221.
[8] T. Garbowski and T. Gajewski. Semi-automatic Inspection Tool of Pavement Condition from Three-dimensional Profile Scans, Procedia Engineering, Volume 172, 2017, Pages 310-318.
[9] S.H. Huang and Y.C. Pan. Automated visual inspection in the semiconductor industry: A survey, Computers in Industry, Volume 66, 2015, Pages 1-10.
[10]C. Mera, M. Orozco-Alzate, J. Branch, and D. Mery. Automatic visual inspection: An approach with multi-instance learning, Computers in Industry, Volume 83, 2016, Pages 46-54.
![Figure 1. The basic setup of a vision system [11]](https://thumb-us.123doks.com/thumbv2/123dok_us/8758003.893331/2.595.309.536.569.725/figure-basic-setup-vision.webp)