A Microprocessor Controlled Population Counter
Said M. M. Kafumbe
1,*, H.N Kundaeli
2, Muawya Aldalaien
31Electronics Engineering Department, Higher Colleges of Technology, Abu Dhabi Womens’ College, Abu Dhabi, UAE 2College of Information and Communication Technologies (CoICT), University of Dar-Es-Salaam, Tanzania
3Computer and Information Sciences Department, Higher Colleges of Technology, Khalifah City Womens’ College, Abu Dhabi, UAE
*Corresponding Author: [email protected]
Copyright © 2014 Horizon Research Publishing All rights reserved.
Abstract
In this technological era, there exists a growing need for pre-programmed interactive systems that ease day to day activities. Systems that utilise microprocessor-based operations to control other systems are based on coded instructions depicting their actual operation, and can be interfaced to actual systems using both software and hardware techniques. A microprocessor controlled system that can be used in counting the number of biological species in a given environment is presented herein. It uses an 8-bit microprocessor 6502 unit, a pair of infra-red emitters and detectors that can be placed at the entrance, a decade up or down counter as well as a shift register. The optical sensing mechanism detects the entry or exit of the biological species with its output signal amplified and used as an input to an asynchronous sequential combinational digital logic that generates control signals for the up and down counter. The parallel shift register then buffers the maximum count into the microprocessor via the input ports, and with the help of an assembly language code the count is stored into memory and onto the display.Keywords
Bats, Bio-Population, Decade Counter, Finite State Machines, Infrared Detectors, Microprocessor,1. Introduction
Although no actual biological species were used in this work, bats were chosen for their echolocating properties and their behaviour was emulated in the design using a finite state machine [1-3]. Bats constitute one of the largest and widely distributed groups of mammals with a variety of living species spread in different parts of the world. However, it is their acoustic ability to detect and manoeuvre through small outlets without collision that has been diminutively emulated suing microprocessors. This work was based on mainly emulating the behaviour of bats in an enclosed environment with a single outlet such as a cave using digital combinational logic, by counting those enter or leave using a microprocessor interfaced to the circuit, which information can be used to monitor their population and in studying the behaviour of bats. Microprocessors have already been
previously used in many diurnal activities. A microprocessor was used as an electronic circuit counting the number of set bits in an input vector using logic components [4], and to control the power of the intensity of the laser beam to the gyroscope [5]. A Motorola m6800 microprocessor was used to interface digital carrier systems to satellite systems [6], while hardwired correlation logic with limitations on maximum data counting rate while counting pulses and found out that using microprocessors improved resolution, increased maximum count, and disentangles spatially overlapping pulses by compensating such pulses through pipelining [7]. A microprocessor controlled counter was used for photon pulses [8], and a microprocessor to provide human factoring of the instrument to make it compatible with clinical setting while routine monitoring disease processes based on tremors [9]. A microprocessor was also used in the preservation of living things affected by low temperatures [10], and connected to transducers to monitor the status of bees and count the colony activity [11]. A cheap microprocessor together with a calculator used for a frequency synthesizer was designed, that derived data for digital phase-locked loops [12], and used to control the many variables involved in the extrusion of molten plastic onto metal [13]. A prototype based on a microprocessor was developed to provide full digital control of the drive speed by countering the effects of torque pulsations and rotor resistance variation [14], and a microcontroller unit used to store and display data in real-time, with an inbuilt microprocessor used to control an 8-channel counter and data latches configured as field programmable gate arrays in a thermal neutron detector to monitor radiation was also reported [15]. Also reported have been microprocessors employed in DC power systems as well as in railway traffic control respectively [16, 17].
It is envisaged that when a bat crosses the optical rays from the infra-red emitters, one of the sensors will detect it before the other hence indicating the direction of motion of the bat. Since motion of the bats is based on ultrasonic frequencies to sense the presence of an obstacle, no two bats can enter the cave at the same time since it identifies the other as an obstacle [21].
The small signal output of the infra-red detection system is then amplified and digitalised to generate control signals for a finite state machine [22] and a clock for the counter and buffer stages of the system. The output of these stages is then fed into a microprocessor unit.
A microprocessor controlled population counter is a counter that can tell at any single moment the total number of a given biological species in a given environment by using the different properties of a microprocessor. Previous population counters used capacitor networks as well as threshold gates[23-25]. In this case, a microprocessor 6502 was used, and the biological species emulated were bats while the environment thought of was an enclosed hall that harbours them, having only one outlet which they use to move in and out. The size of the outlet was assumed to be in such a way that a single bat is able to pass through at a certain time.
Bats have a unique ability to squeeze through tiny openings [26-33]. The whole system comprises of a sensing section that is envisaged to be directly involved with the bats. This section has two infra-red emitters, and two infra-red detectors [34]. The system also has a section that conditions the sensed signals before they are fed into the pre-processing section. This section consists of an amplifier based on a voltage comparator [35]. Outputs of the comparators are used as inputs to pre-processing section that is made up of a finite state machine [36-38] as well as a clock generator [39].
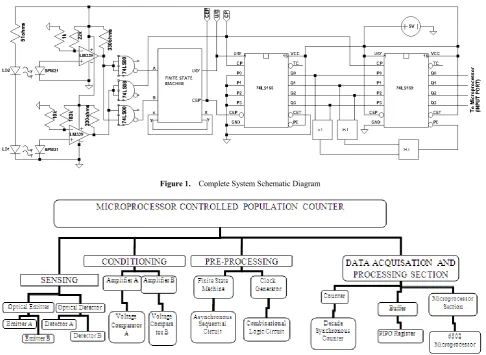
[image:2.595.64.551.371.726.2]The pre-processing section uses asynchronous sequential digital circuitry to generate signals that are used to control the counter [40] as well as the buffer stages of the main signal processing section, which later feeds the microprocessor to control the whole system. The counter is directly connected and synchronized to a buffer circuit, which is composed of a 4-bit shift register [41] that holds the maximum count before it is fed into the microprocessor. The microprocessor is then able to do simple arithmetic operations on the count using a small assembly language code programmed into it [42]. The result may then be used to study the day to day behavior of the bats as may be required by zoologists [43, 44]. The complete block diagram of the system is shown above in Figure 2.
Figure 1. Complete System Schematic Diagram
2. Methodology
The experimental method used in designing this system was by block by block. The blocks were later connected together to form the whole system in a top to bottom approach. The first block considered was the sensing block followed by the signal conditioning, pre-processing and finally the signal processing block.
(a)
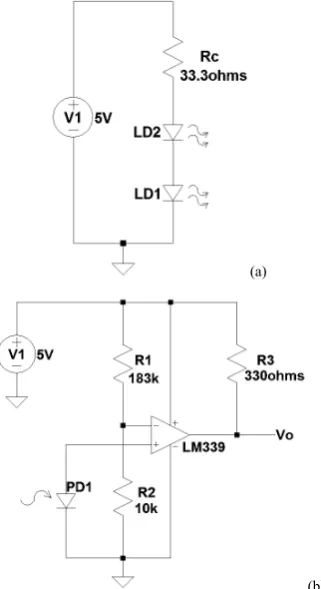
[image:3.595.99.260.179.474.2](b) Figure 3. (a) Optical emitter circuit diagram; (b) Optical detector circuit diagram showing only one channel of the detection
The sensing section consisted of the optical emitters and optical detectors [45]
2.1. Optical Emitter Design
Here the circuit that produces an infrared radiation was designed. Normally, when a light emitting diode (LED) is forward-biased, it emits a radiation whose intensity depends on the forward voltage of that diode [46-49]. In this block design, the components required were the infrared LEDs: LD1 and LD2, a dc voltage source V1 of 5V and resistor Rc. These are shown in Figure 3(a). The forward bias current (If) and voltage (Vf) for the LEDs: LD1 and LD2 were 60mA and 1.5V respectively. The value of resistor Rc was calculated using equation 1 to give Rc = 33.3 ohms. For practical purposes however, the value of Rc chosen was Rc = 51 ohms.
(1)
2.2. Optical Detector Design
Here the circuit that detects the presence of an infrared radiation and converts it into a current and voltage was designed. Normally, when light of high enough energy of a given frequency lands on an electron it’s able to move from one energy level to another. This movement can be seen as a current and hence a voltage which represents the detected infra-red radiation. In this block design, the components required were: the BPW21 silicon photodiodes [50] shown as PD1 and PD2; resistors R1, R2, and R3; comparator LM339, a dc voltage source V1 of 5V and resistor Rc. To simply the design only one channel B is shown in Figure 3(b) and the same circuit can be repeated for channel A.
For the calculation of the resistors at the inverting input of the comparator, equation 2 based on voltage potentials was used. From this equation, the reference voltage V- was chosen as 0.26V for channel B, and 0.20V for channel. The sensed voltage V+ was set for 0.28V at channel B to give R1=183K ohms and R2 = 10K ohms, and at 0.24V at channel A to give R1=22K, and R2=1K. Load resistance R3 was chosen to be 330 ohms.
(2)
2.3. Signal Conditioning Block
This block is part of the optical detector circuit shown in Figure 3(b), and the design involves a comparator that results a logical 1 if the voltage exceeds a certain value, otherwise it returns a logical 0 [51]. It also involves the design of digital logic that determines the control signals for the finite state machine, as well as the asynchronous clock. Normally, when a given reference voltage is applied to the inverting input of a comparator (V-), and the required input voltage to the non-inverting one, the outputs saturate and swing between the power supply of the circuit and ground. These comparator outputs that form the signals Detector A and Detector B in Fig. 4 are used inside a combinational logic to generate finite state machine control signals A and B as well as the clock [52].
Figure 4. Signal Conditioning Circuit
Ω = −
= 1 2 33.3
If Vf V Rc
2 2 1 1
R R R V
[image:3.595.324.545.575.723.2]2.4. Signal Pre-Processing Block Diagram
This block design consists of the finite state machine that defines the sensor outputs under a certain format and provides an output only under certain required states. Normally asynchronous sequential circuits are those whose inputs depend on the previous outputs and whose changes do not follow a clock [53]. A finite state machine has defined states for required outputs. It is therefore able to control all other states hence reducing errors due to unwanted states [54].
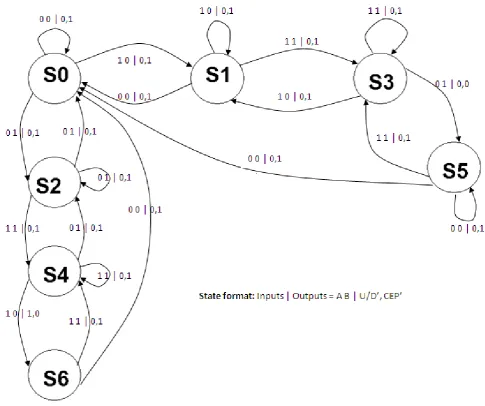
In this system the design was made in such a way that the initial state is S0 where both detectors A and B are passive. If detector B goes active, and A remains passive, then the finite state machine moves to state S1 but if detector B goes passive then it returns to S0. Also if it is in state S0 and both
detectors A and B are passive, then it remains there. When the finite state machine is in state S1, and detector B is active, while detector A is passive, the system will remain there else if detector A now becomes active. Here the system advances to state S3 and stays there if the states do not change but goes to state S5 when detector B becomes passive and hence increased the count since a bat has gone into the cave. The changes of these states are shown in Fig. 5 using arrows to depict the movements/feedback loops based on the signal from the detectors A and B being high or low.
When in state S5, and both detectors B and A are passive, the system moves to state S8 that leads back to S0 and does not change the count. Also when in S5 and both detectors A and B change, this shouldn’t happen since the bats ultrasonic motion does not allow them to collide.
[image:4.595.61.547.272.678.2]While in S0 and B is passive but A becomes active, then state S2 is initiated but if in S2 and A becomes passive, the finite state machine goes back to state S0 else it remains in S2.
[image:5.595.354.553.73.151.2]If it is in S2 and B becomes active, the system moves to state S4 and stays there for no changes in B and A else it moves to state S6 when A becomes passive again but this time the count is decreased since a bat has fully gone out of the cave. The system stays there if nothing happens or moves to state S9 and later back to the initial state S0 when all A and B become passive. The above description of the states is only appropriate for a single motion between the sensors. If two or more movements are occurring at the same time, in opposite directions, reverse transitions will always cut out the count.
Table 1. Primitive state/flow table with stable states circled
ROW INPUTS OUTPUTS
0 0 0 1 1 1 1 0 U/D’ CEP’
A
○
S0E S2 - S1 0 1B S0 - S3 A
○
S1E 0 1C - S5 A
○
S3E S1 0 1D S0 A
○
S5E S3 - 0 0E S0 A
○
S2E S4 - 0 1F - S2 A
○
S4E S6 0 1G S0 - S4 A
○
S6E 1 0Table 2. Row merging and secondary variables
ROWS BA
Secondary Variables
0 0 0 1 1 1 1 0 X Y
a A
○
S0E S2 - S1 0 1b/c/d S0 A
○
S5E A○
S3E A○
S1E 0 0e/f/g S0 A
○
S2E A○
S4E A○
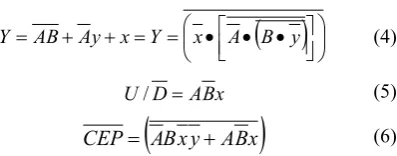
S6E 1 1 [image:5.595.305.554.214.490.2]From the finite state diagram, a primitive state or flow table was generated as shown in Table 1. Each of the rows a – g in the table shows the movements or looping based on the detectors A and B, and the resultant state achieved. Also shown is the expected action to be taken for the given loop or movement. This information is summarised further in Table 2, which groups common rows together, and generates secondary variables for each common group. Fig. 6 shows the flow matrix and the excitation maps of the finite state machine. From the excitation maps, it is possible to generate control signals X and Y, as well as up-down count (U/D’) and count enable parallel (CEP’). The generation of these is shown in Fig. 7 and Fig. 8. From these maps, the equations for these control signals are as given in equations 3-6.
(3)
(4)
(5)
(6)
From equations 3-6, the asynchronous combinational sequential logic was designed as shown in Fig. 9. Its outputs are the controls to the up-counter and the shift register is the buffer section of the system.
(a)
(b) Figure 6. Finite state diagram flow matrix and excitation maps
(a)
(b) Figure 7. Generation of signals X and Y
2.5. Signal Processing Stage
[ ]
( )
•
•
=
=
+
+
=
A
By
Ax
Bx
X
A
B
y
x
AB
X
( )
• • • = = + +=AB Ay x Y x A B y
Y
x B A D U/ =
(
A
B
x
y
A
B
x
)
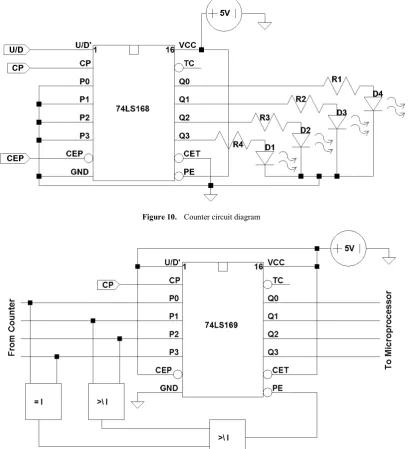
[image:5.595.58.298.261.543.2] [image:5.595.321.545.519.717.2]This involved the design of a counter that synchronously moves between counts following the outputs of a finite state machine. When a counter based on the 74LS168 integrated circuit package is enabled using signals sent to the control pins Count Enable Parallel (CEP’) and Up-Down Count Input (U/D’), it is able to count from the original nibble to another using positive triggering of the clock.
In the design of this block, input pins of the chip were connected to ground whereas outputs were connected to LEDs before reaching the buffer. Inputs to U/D’, CEP’ were applied from the outputs of the finite state machine. The clock pin (CP), was connected to the pin Count Enable Trickle (CET’), and was enabled while Parallel Enable (PE’) was disabled. The outputs were then studied under different clock stages and counting confirmed. The circuit diagram together with the connections is shown in the Fig. 10. 2.6. Buffer or Register Stage
Here the a Parallel In-Parallel-Out (PIPO) register that takes in all outputs of the counter but stores only the maximum count was designed. A 4-bit PIPO register was designed based on the IC 74LS169 (Fig. 11) through manipulation of the control signals and by making the
parallel enable (PE) active.
(a)
(b)
Figure 8. Generation of signals U/D’ and CEP
[image:6.595.313.549.92.341.2] [image:6.595.75.535.380.724.2]Figure 10. Counter circuit diagram
Figure 11. Buffer or PIPO register
Outputs from the counter stage were connected as inputs to the PIPO register. Controls for the count were disabled and the clock applied while keeping the parallel enable (PE’) to consider only outputs 0000 (to reset the microprocessor), and 1001 as maximum count as governed by equation 7.
(7)
2.7. Microprocessor Block
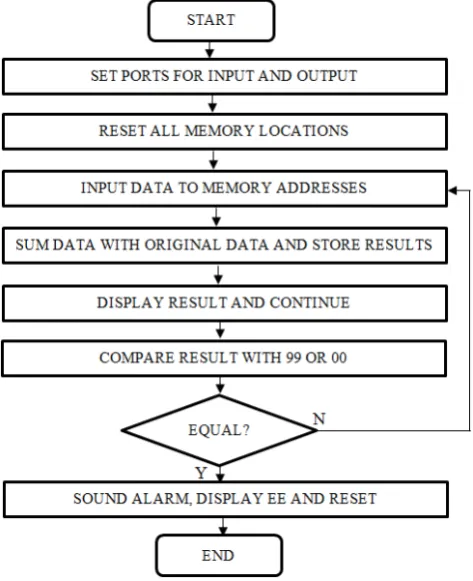
Here the aim was to develop a microprocessor program that does the following: (i) declares its ports for either input and output; (ii) resets all memory locations used; (iii) inputs data via the input port and sends it to a certain memory location ready for processing; sums up the data with that already in memory and sends it to output ports, memory
stores as well as displaying it on the keyboard; (iv) it also calls an alarm or displays “EE” to mean error if the maximum count exceeds 99 or is less than 00.
A microprocessor can be used can be used to process different operations including arithmetic and data allocation, feedback controlling and temporarily storing data. In the assembly language program for this work, a buffered count is input and stored the added to the previous count and the result displayed at the ports and in a memory store. This goes on until a maximum count is reached and the system resets all memory locations and also sounds an alarm.
The experimental procedure used during the design of this block involved resetting all memory locations; declaring ports for input and output; inputting data at the input port and storing it in a certain location; summing up this data with the previous one (zero at the start), then storing it and displaying
(
) (
)
[
Q0 Q3 Q1 Q2]
[image:7.595.103.512.82.532.2]it at the ports and terminals; and then doing the same for other inputs until a maximum count of 99 was reached in which case an alarm is sounded followed by a reset of all locations for further use. The algorithm of this program is shown in a flowchart shown in Fig. 12, and the full assembly code used is shown in Appendix.
Figure 12. Buffer or PIPO register
3. Results and Discussion
3.1. Optical Emitter, Detection and Conditioning Stages For the emitter circuit, the calculated resistance (Rc) was 33.3 ohms but the maximum resistance (Rm) used was 51 ohms. The value of resistance used was different from the designed value. This is because a resistance was chosen to give an adequate radiation in consideration of the forward and voltages and currents of the light emitting diodes used.
The optical detector voltages were measured for both the detector channels A and B. The sensed voltage at Channel A was 0.24V while that at Channel B was 0.28V. The reference voltage for the comparator LM339 was 0.26V for Channel A and 0.20V for Channel B. The conditioned voltage for the two channels was 4.99V and this meant that the Detector/Channel was active or in ON state. A conditioned voltage of 0.03V measured out of the conditioning circuit
meant that the Detector/Channel was passive or in OFF state. Both measured voltages from the detector channels were small and required a conditioning circuit to elevate the voltages to almost 5V. The low sensed voltages were attributed to the availability of dark current, noise and background interference when the detectors were active, and amplification was done by the conditioning circuit to improve the signal strength.
Table 3. The finite state machine outputs Detector
B Detector A X Y U/D’ CEP’
0 0 0 1 0 1
1 0 1 1 0 1
1 1 1 1 0 1
0 1 1 1 1 0
0 0 0 1 0 1
0 1 0 0 0 1
1 1 0 0 0 1
1 0 0 0 0 0
3.2. Finite State Machine Outputs
[image:8.595.311.554.488.566.2]The results of the pre-processing finite state machine are shown in Table 3 before being fed into the counter and buffer sections. The outputs are as expected from the equations 3-6. However, the misallocation of states, and false counts were attributed to the occurrence of hazards and races, and faults due to defects that occur as broken wires or short-circuited points as well as stuck-at-faults.
Table 4. Counter stage outputs
Dn PE’ CEP’ CP U/D’ CET’ Qn Function
X 1 0 ↑ 1 0 Qn Count Up
X 1 0 ↑ 0 0 Qn Count Down
3.3. Counter and Buffer Stages Outputs
Table 5. Buffer stage outputs
INPUTS
PE' CP CEP CET OUTPUTS
D0 D1 D2 D3 Q0 Q1 Q2 Q3
0 0 0 0 0 ↑ 1 1 0 0 0 0
0 0 0 1 1 ↑ 1 1 0 0 0 0
0 0 1 0 1 ↑ 1 1 0 0 0 0
0 0 1 1 1 ↑ 1 1 0 0 0 0
0 1 0 0 1 ↑ 1 1 0 0 0 0
0 1 0 1 1 ↑ 1 1 0 0 0 0
0 1 1 0 1 ↑ 1 1 0 0 0 0
0 1 1 1 1 ↑ 1 1 0 0 0 0
1 0 0 0 1 ↑ 1 1 0 0 0 0
1 0 0 1 0 ↑ 1 1 1 0 0 1
3.4. The Microprocessor Stage Outputs
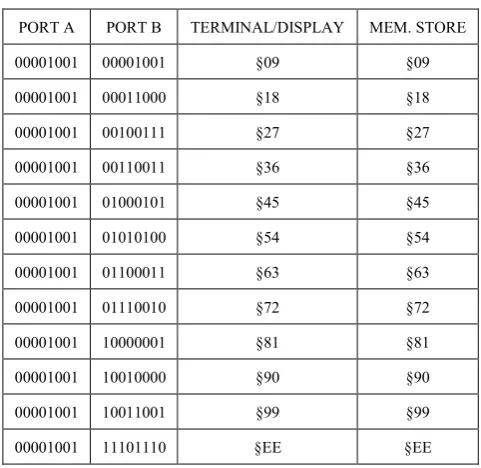
When the maximum count is buffered by the shift register, it appears at the input ports of the microprocessor unit and the assembly language programme immediately picks it up and stores it inside the microprocessor’s memory. This is evident from the outputs of the microprocessor section shown in Table 6. Every time a decimal of nine reached the ports, it was stored and added to the existing memory storage and displayed as well. This went on until a maximum value of 99 was reached at which point the processor displayed EE and sounded an alarm.
Table 6. Outputs of the microprocessor section
PORT A PORT B TERMINAL/DISPLAY MEM. STORE
00001001 00001001 §09 §09
00001001 00011000 §18 §18
00001001 00100111 §27 §27
00001001 00110011 §36 §36
00001001 01000101 §45 §45
00001001 01010100 §54 §54
00001001 01100011 §63 §63
00001001 01110010 §72 §72
00001001 10000001 §81 §81
00001001 10010000 §90 §90
00001001 10011001 §99 §99
00001001 11101110 §EE §EE
4. Conclusion (and Recommendations)
A microprocessor controlled bio-population counter has been presented. It emulates bats as the biological species being monitored, and employs optoelectronic devices in the sensing stages of the device followed by signal conditioning and digital processing circuits, that eventually lead to a 4-bit signal flow into the input port (port A) of the microprocessor 6502 for monitoring the bio population and displaying the count. It was observed that the system’s maximum count was ninety nine after which the microprocessor displayed EE, and sounded an alarm. Further counting was possible on resetting the microprocessor. Hardware and software interfacing to the microprocessor unit was done successfully.
Although the system could be reset and counting restarted, it would be better to have a system that provides infinite counting capabilities. Therefore as recommendation for future work, advanced microcontrollers should be employed to improve the speed and memory storage as well as the maximum count available for display. This would help the system to suit such applications that have large populations.
Additionally, the discrete components of the system should be replaced in future, by on-chip integrated circuits to improve system size, cost and weight. Consequently, the readout could be improved to use liquid crystal displays or bats population be monitored at a remote location using wireless communication.
APPENDIX
START: LDA $F152; Read zeroes from ROM STA $0004; Put zeroes into first memory store STA $0004; Put zeroes into second memory store LDA #$EE; Put in an error symbol
[image:9.595.57.298.478.712.2]BNE MORE; Until its zero RTS; make it a sub-routine
PULSE: LDA #$01; Declare portA1 for input STA $A003;
STA $A001; Set port A1 to one JSR WAIT; Delay processing LDA #$00;
STA $A001; Set port A1 to zero JSR WAIT; Delay processing RTS; make it a sub-routine
ALARM: LDX #$FF; Create a tone for the alarm LOOPS JSR PULSE; Bring in the pulse
DEX; Until length fades BNE LOOPS; If it fades JSR START; Call reset
LOOPSY JMP LOOPSY; Stay in internal loop ONE: LDA #$00; Declare portB for output
STA $A003;
LDA #$FF; Declare portA for input STA $A002;
RTS; make it a sub-routine
TWO: LDA $A001; Input buffered maximum count STA $A005; Send it to a certain reset memory store RTS; make it a sub-routine
THREE: SED; Set on the decimal mode CLC; Clear carry
LDA $A004; Input into A-register first store ADC $0005; Add it with other data in memory STA $A000; Put result in output port B
STA $A004; Also store it in some memory store RTS; make it a sub-routine
FOUR: LDA $0004; Put data in store in A-register STA $00BB; Prepare keyboard for display JSR SCANDS; Call displaying sub-routine JMP FOUR; Stay in loop
RTS; make it a sub-routine MAIN: JSR ONE;Call declaring subroutine
JSR TWO; Call inputing subroutine JSR THREE; Call processing subroutine JSR FOUR; Call a maximum store check up JMP LOOPY; Stay in main loop
CHECK: LDA $0004; Bring in memory data NOP; Do nothing
CMP #$99; Is it 99 yet? BCC OK; If so call alarm JSR FOUR; Else process it OK: JSR ALARM;
LOOPI: JMP LOOPI; Stay in internal loop.
REFERENCES
[1] Ducange, P., Marcelloni, F., Antonelli, M. (2014), “A Novel Approach based on Finite State Machines with Fuzzy Transitions for Non-Intrusive Home Appliance Monitoring”, Industrial Informatics, IEEE Transactions on, Vol. PP, No. 99,
pp. 1, 10.1109/TII.2014.2304781
[2] Jha, A., and Chinchore, A. (2006), “Microprocessor
controlled atmospheric ion counter: A study of large ions in Pune city”, Indian Journal of Radio & Space Physics (IJRSP), Vol. 35, pp. 42-46.
[3] Hagino, T., et al (2007), “Adaptive SONAR sounds by
echolocating bats”, Underwater Technology and Workshop on Scientific Use of Submarine Cables and Related Technologies, Symposium on, pp. 647-651.
[4] Gold, S. M. (2002), “4-bit population count circuit”, United States Patent No. US 6430251 BI.
[5] Killpatrick, J. E. and Berndt, D. F. (1996), “Microprocessor controlled ring laser gyro power control system”, United States Patent No. US 5489981.
[6] Aranguren, W. and Langseth, R. (2003), “A microprocessor controlled digital interface for digital satellite systems”, Communications, IEEE Transactions on, Vol. 26 No. 5, pp. 631-637.
[7] Ogden, K. M. and Rybski, P. M. (1988), “A
microprocessor-based panoramic pulse counter with a concurrent, pipelined architecture”, Bulletin of the American Astronomical Society, Vol. 20, pp. 675.
[8] Power, R. K. and Nishimura, A. M. (1979), “A
microprocessor-controlled photon counter for pulsed optically detected magnetic resonance”, Review of Scientific Instruments, Vol. 50 No. 8, pp. 969-971.
[9] Zilm, D. H. et al (1978), “A microprocessor-controlled
clinical tremometer”, Behavior Research Methods, Vol. 10 No. 2, pp. 177-181.
[10] Baartz, G. and Brock, M. A. (1979), “A
microprocessor-controlled rate controller for use in cryopreservation”, Cryobiology, Vol. 16 No. 5, pp. 497-505. [11] Bromenshenk, J. et al, (2004), “Honey bee monitoring system
for monitoring bee colonies in a hive”, United States Patent Application 20040077290.
[12] Evans, W.A. and Jenkins, R.W. (1978), “A
microprocessor-controlled phase-locked signal source, Radio and Electronic Engineer”, Vol. 48 No. 12, pp. 593-602. [13] Ware, W. E. (1984), “Control of plastic extruders with
multiple temperature zones using a microprocessor based programmable controller system”, Industry Applications, IEEE Transactions on, Vol. IA-20 No. 4 part 1, pp. 912-917. [14] Liu, C.-H. et al (1989), “Modeling and implementation of a microprocessor-based CSI-fed induction motor drive using field-oriented control”, Industry Applications, IEEE Transactions on, Vol. 25 No. 4, pp. 588-597.
[15] Schulte, R.L. et al (1994), “Development of a thermal neutron detector system using large area silicon detectors”, Nuclear Science Symposium and Medical Imaging Conference, IEEE Conference Record, Vol. 1, pp. 414-417.
[16] Hockley, P., (2001), “Reducing DC power system operating costs through supervisory control software changes”, Telecommunications Energy Conference, INTELEC Twenty-Third International, pp. 482-489.
Electronics Technology: Meeting the Challenges of Electronics Technology Progress, 28th International Spring Seminar on, pp. 76-79.
[18] Holmes, J.N. and Holmes, M.G. (1992), “Applications of very-low-cost small vocabulary connected word recognition”, Telecommunications, Consumer and Industrial Applications of Speech Technology, IEE Colloquium on, pp. 3/1-3/4.
[19] Ungering, A.P. et al (1994), “Architecture of a
fuzzy-processor based on an 8-bit microprocessor”, Fuzzy Systems, IEEE World Congress on Computational Intelligence., Proceedings of the Third IEEE Conference on, 1, pp. 297-301.
[20] Sokol, P. (1985), “Interfacing the Biomation 1010 to a 6502 based microcomputer”, Review of Scientific Instruments, Vol. 56 No. 4, pp. 632.
[21] Hiryu, S. et al (2007), “Compensation behaviors in
echolocating bats measured by a telemetry microphone during flight”, Underwater Technology and Workshop on Scientific Use of Submarine Cables and Related Technologies, Symposium on, pp. 535-539.
[22] Suto, T. et al (2010), “Design and Evaluation of Burst-Mode Asynchronous 8-Bit Microprocessor Using Standard FPGA Development System”, Defect and Fault Tolerance in VLSI Systems (DFT), IEEE 25th International Symposium on, pp. 172-179.
[23] Celinski, P., et al (2002), “Compact parallel (m,n) counters based on self-timed threshold logic”, Electronics Letters, Vol. 38 No. 13, pp. 633-635.
[24] Celinski, P., et al (2003), “Area efficient, high speed parallel counter circuits using charge recycling threshold logic”, Circuits and Systems, ISCAS, Proceedings of the 2003 International Symposium on, 5, pp. V-233-V-236.
[25] Leblebici, Y. et al (1996), “A compact high-speed (31,5) parallel counter circuit based on capacitive threshold-logic gates”, Solid-State Circuits, IEEE Journal of, Vol. 31 No. 8, pp. 1177-1183.
[26] Austin, K.B. et al (2009), “Capturing the Auditory
Experience of Behaving Bats: A Preliminary Study”, Computing, Engineering and Information, ICC '09. International Conference on, pp. 123-126.
[27] Binbin C., et al (2010), “A biomimetic model for bats' echolocation signal processing and it's implementation on FPGA”, Signal Processing Systems (ICSPS), 2nd International Conference on, 1, pp. V1-452-V1-456.
[28] Chiselev, A. and Moraru, L. (2010), “A study regarding spatial impulse response of concave transducers with applications on bats”, Electrical and Electronics Engineering (ISEEE), 3rd International Symposium on, pp. 201-203. [29] Balleri, A. et al (2010), “Impact of flight trajectory on the
detection and selection of flowers by nectar-feeding bats”, Cognitive Information Processing (CIP), 2nd International Workshop on, pp. 350-353.
[30] Lim, J.G. et al (2007), “Bats' Auditory Pathway Modeling for Multiple Targets Localization”, Robot and Human interactive Communication, RO-MAN, The 16th IEEE International Symposium on, pp. 131-136.
[31] Mamode, M. et al (1982), “Bat's sonar signals and
acceleration tolerance”, Acoustics, Speech, and Signal
Processing, IEEE International Conference on ICASSP, 7, pp. 1132-1135.
[32] Simmons, J.A. et al (1992), “Through a bat's ear”, Spectrum, IEEE, Vol. 29 No. 3, pp. 46-48.
[33] Inoue, S. et al (1999), “A neural mechanism for detecting target distance independently of target velocity in echolocation of bat”, Neural Information Processing, ICONIP '99. 6th International Conference on, 2, pp. 477-482.
[34] Duun, S.B., et al (2010), “A Ring-Shaped Photodiode
Designed for Use in a Reflectance Pulse Oximetry Sensor in Wireless Health Monitoring Applications”, Sensors Journal, IEEE, Vol. 10 No. 2, pp. 261-268.
[35] Wang, J.-F. and Duan, J.-H. (2010), “Design of an ultra high-speed voltage comparator”, Circuits, Communications and System (PACCS), Second Pacific-Asia Conference on, Vol. 1, pp. 145-148.
[36] Shieh, M.-D. et al (1996), “Low-power state assignment for asynchronous finite state machines”, Circuits and Systems, IEEE 39th Midwest symposium on, Vol. 3, pp.1325-1328. [37] Chu, T.-A., et al (1993), “An Efficient Critical Race-Free
State Assignment Technique for Asynchronous Finite State Machines”, Design Automation, 30th Conference on, pp. 2-6.
[38] Kang J. -W. et al (1993), “A synthesis procedure for
large-scale asynchronous finite state machines”, Circuits and Systems, Proceedings of the 36th Midwest Symposium on, 2, pp. 1304-1307.
[39] Dongsuk Shin, D., et al (2009), “A fast-lock synchronous multi-phase clock generator based on a time-to-digital converter”, Circuits and Systems, ISCAS. IEEE International Symposium on, pp. 1-4.
[40] Nagaraj, H.S. and Hariharan, R. (1973), “Design of
synchronous decade up-counter”, India, IEE-IERE Proceedings, Vol. 11 No. 2, pp.74-78.
[41] Nayeem, N.M. et al (2009), “Efficient Design of Shift
Registers Using Reversible Logic”, International Conference on Signal Processing Systems, pp.474-478.
[42] Hall, D. and Rood, A. L., (2011), Microprocessor and
interfacing: programming and hardware 68000 version, Pennsylvania State University.
[43] Alcock, J., (2005), Animal Behavior: An Evolutionary
Approach, 8th ed., Sinauer Associates, Arizona State University.
[44] Hill, J. E. and Smith J. D., (1984), Bats: A Natural History, British Museum (Natural History).
[45] Fan Ji; et al (2007), “Advanced Photodiode Detector For Medical CT Imaging: Design and Performance”, Industrial Electronics, ISIE, IEEE International Symposium on, pp. 2730-2735.
[46] Feng, W., et al (2010), “Packaging and AC powering of LED array”, Electronic Components and Technology Conference (ECTC), Proceedings 60th, pp. 512-514.
[47] Lin, W.-M, et al (2009), “An all-digital clock generator for dynamic frequency scaling”, VLSI Design, Automation and Test, VLSI-DAT '09. International Symposium on, pp. 251-254.
GaN-Based LEDs WithMicrorod Array and Textured Sidewalls”, Electron Device Letters, IEEE, Vol. 31 No. 1, pp. 35-37.
[49] Yang, H. et al (2010), “Enhanced Illumination Sensing Using Multiple Harmonics for LED Lighting Systems”, Signal Processing, IEEE Transactions on, Vol. 58 No. 11, pp. 5508-5522.
[50] Jin, X and Yang, J. (2010), “Analysis of Low-Dark-Current, High-Sensitivity, Low-Optical-Crosstalk, and Small-Pixel-Size Pinned Photodiode With No-Gap Microlens”, Photonics Technology Letters, IEEE, Vol. 22 No. 21, pp. 1556-1558.
[51] Hao G. H. et al (2010), “Low voltage comparator for high speed ADC”, Signals Systems and Electronics (ISSSE), 2010
International Symposium on, 1, pp. 1-4.
[52] Lin, Y.-H. (2010), “Development of High-Performance
Optical Silicone for the Packaging of High-Power LEDs”, Components and Packaging Technologies, IEEE Transactions on, Vol. 33 No. 4, pp. 761-766.
[53] Sotiriou, C.R. (2001), “Direct-mapped asynchronous
finite-state machines in CMOS technology”, ASIC/SOC Conference, Proceedings, 14th Annual IEEE International, pp. 105-109.