Journal of Chemical and Pharmaceutical Research, 2018, 10(9): 90-94
Research Article
ISSN : 0975-7384
CODEN(USA) : JCPRC5
90
A Novel Numerical Characterization of DNA Sequences Based on Two-Base and
its Application
Xiaolong Xue
,
Yunxiu Zhao, Lei Wang and Xiaoli Xie
*College of Science, Applied Mathematics, Northwest A&F University, Yangling, Shanxi, PR China
_____________________________________________________________________________
ABSTRACT
Analyzing DNA sequences is a topic in bioinformatics. Traditionally, comparing DNA sequence is carried out by alignment method. However, it is extremely complex in time and space complexity. In the paper, a novel alignment-free method is proposed based on the position information of two adjacent nucleotides. A DNA sequence is transformed to a 48D vector, which includes frequency, mean value and variance of position for each two bases. The Euclidean distances for new vectors are calculated to carry on the similarity analysis. Finally, comparing Clustal W method with double nucleotides vector and single nucleotide vector.
Keywords: Numerical characterization; DNA sequence; Two-base; Cluster analysis;Similarity analysis
_____________________________________________________________________________
INTRODUCTION
The similarity analysis of biologic sequences is a hot topic in recent years. It plays an important role on being aware of the evolutionary relationship between DNA sequences. A great deal of methods have been successfully applied to classify the sequences into certain types [1-6]. For the moment, the main researches are divided into sequence alignment method and sequence alignment-free method. Nevertheless, alignment method is extremely complex in time and space complexity although it can guarantee the accuracy of classifying. The k-mer method is very popular of alignment-free methods. However, it only considers the frequency of the k-word, so it leads to the loss of information of DNA sequences [7,8]. In addition, other alignment-free method can be categorized into several classes in general: (1) Methods based on substrings carry out the similarity in a pair of sequences [9]. (2) Alignment-free sequence analysis and comparison can be successfully made according to information theory. Existing information theory include global and local characterization of DNA, estimating genome entropy to motif and region classification [10]. (3) Graphical approaches are extremely useful in dealing with various biological problems, especially for very complicated biological systems due to intuitive insights. (4) Some properties are integrated into sequence alignment-free method [11-14]. Composition vectors based on k-word position is a new method. Many researchers have begun to extract the position information of a k-word [15]. He lily and Zhao Xin proposed an alignment-free method based on position of each nucleotide and amino acid. For mining the more information, we present a new numerical characterization based on the position information of two adjacent nucleotides.
91
EXPERIMENTAL SECTION
Numerical Characterization
Let S=(s1,s2,…sN) be a DNA sequence, si Є {A,T,G,C}. In the paper, a DNA sequence is transformed to a binary indicator sequence by coding adjacent nucleotides, we define WAA as follows:
( )
AA
W i
1,
if AA is present at location i of the sequence0, otherwise 1
WAC, WAG, WAT are defined similarly.
If a sequence is AACGTAGTCAA, the corresponding indicator sequence of nucleotide AA is WAA=10000000010. It is worth mentioning that the last nucleotide and the first nucleotide doesn’t form a circle.
For obtaining more information of DNA sequence, we construct three characterizations fk, µk, Dk (k=AA, AT, AC, AG,…,GG) and they describe the frequency, the average position and variation of position for each two-base.
1
( )
N AA i AAW
i
f
N
1( )
N AA i AAiW
i
N
2 11
(
( )
)
1
NAA AA AA
i
D
iW
i
N
These feathers form a 48 dimension vector:
AA,
AA,
AA,
AC,
AC,
AC,
,
TT,
TT,
TT
L
f
D
f
D
f
D
.In order to avoid the influence from extremum, vector L is standardized. Take the first component fAA as an example:
(1)If
f
min
f
max, ' minmax min
f
f
f
f
f
;(2)If
f
min
f
max,f
'
f
min.where fmin , fmax is the minimum and maximum of fAA, respectively. f ‘
is the first component which is normalized. Therefore, a novel vector whose every component’s value ranges from 0 to 1 can be gained.
Clustering Analysis
The similarity matrix can be obtained by computing the Euclidean distances between any two vectors. On this basis of similarity matrix, the phylogenetic trees can be constructed.
Data Sets
92
RESULTS
30 Mammals Sequences
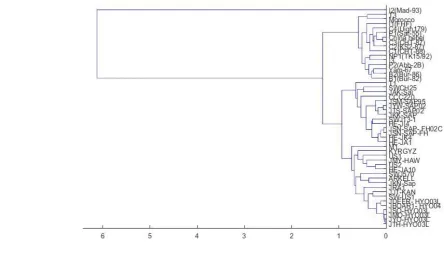
[image:3.595.58.507.136.370.2]The new method is first tested on a mitochondrial DNA data set of 30 mammalian genomes, and each sequence has a length range from 16,300 to 17,500 nucleotides. Figure 1 shows the clustering result.
Figure 1: Phylogenetic tree of 30 mammalian genomes by two-base method 48 Hepatitis E Virus (HEV) Sequence
The research about virus not only benefits personal health in a deep degree, but also concerns the entire ecosystem in a sense. Hepatitis E virus which easily lead to hepatitis are the most dangerous for modern life style. Expressly two subtypes will be chosen to test the efficiency of our method. The result of phylogenetic is shown in Figure 2.
[image:3.595.61.506.471.729.2]93
Method Comparison
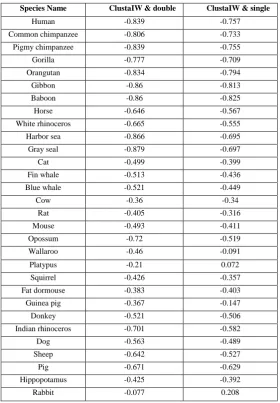
[image:4.595.158.439.144.548.2]To further confirm the proposed method is effective, the similarity distances are got by computing the Clustal W method, the two-base method and the single-base method for the same data sets. The correlation coefficents are shown in Table 1 (take mammalian genome sequences as an example).
Table 1: The correlation coefficients between ClustaIW and double and ClustaIW & single Species Name ClustaIW & double ClustaIW & single
Human -0.839 -0.757 Common chimpanzee -0.806 -0.733 Pigmy chimpanzee -0.839 -0.755 Gorilla -0.777 -0.709 Orangutan -0.834 -0.794 Gibbon -0.86 -0.813 Baboon -0.86 -0.825 Horse -0.646 -0.567 White rhinoceros -0.665 -0.555 Harbor sea -0.866 -0.695 Gray seal -0.879 -0.697 Cat -0.499 -0.399 Fin whale -0.513 -0.436 Blue whale -0.521 -0.449 Cow -0.36 -0.34
Rat -0.405 -0.316 Mouse -0.493 -0.411 Opossum -0.72 -0.519 Wallaroo -0.46 -0.091 Platypus -0.21 0.072 Squirrel -0.426 -0.357 Fat dormouse -0.383 -0.403 Guinea pig -0.367 -0.147 Donkey -0.521 -0.506 Indian rhinoceros -0.701 -0.582 Dog -0.563 -0.489 Sheep -0.642 -0.527 Pig -0.671 -0.629 Hippopotamus -0.425 -0.392 Rabbit -0.077 0.208
It is obvious that the absolute values listed in the first column are higher than the second column. In other words, the new method based on the adjacent nucleotides is more effective than single-base method. Specially, the two-base method can extract more information for long sequences.
DISCUSSION
Position information is one of the most important information hidden in the original sequences. By getting more messages, the proposed method based on two-base is more effective than single-base. The results of clustering analysis according to the new vector indicate ergodic base can offer a new thinking to analyze DNA sequences and protein sequences. The vector characterization involved in the research for protein sequences can draw more information to analyze corresponding sequences [16-18].
94
ACKNOWLEDGEMENT
The paper is funded by National Natural Science Foundation of China (31572361).
REFERENCES
[1] Mendizabal-Ruiz Gerardo, Román-Godínez Israel, Torres-Ramos Sulema. Peer J. 2018, 6, 4264. [2] Guo-Sen Xie, Xiao-Bo Jin, Chunlei Yang. Acta Biotheoretica.2018, 66(2), 113-133.
[3] Xin Jin, Qian Jiang, Yanyan Chen. J Mol Graph Model. 2017, 76, 342-355.
[4] Tung Hoang, Changchuan Yin, Stephen S, Yau T. Genomics. 2016, 108(3), 134-142. [5] Liwei Liu, Chao Li, Fenglan Bai. J Mol Struct. 2015, 1082, 49-55.
[6] Fenglan Bai, Jihong Zhang, Junsheng Zheng. J Mol Graph Model. 2015, 62, 150-156. [7] Chun Li, Yan Yang, Meiduo Jia. Physica A Stat Mech Appl. 2014, 398, 162-171. [8] Shuyan Ding, Yang Li, Xiwu Yang. J Theor Biol. 2013, 317, 192-199.
[9] Domazet-Lošo Mirjana, Haubold Bernhard. BMCBioinformatics. 2011, 27(11), 1466-72. [10] Susana Vinga. Brief Bioinform. 2014, 15(3), 376-389.
[11] Tung Hoang, Changchuan Yin, Hui Zheng. J Theor Biol.2015, 372, 135-145. [12] Mo Deng, Chenglong Yu, Qian Liang. PLoS One. 2011, 6(3), 7293.
[13] Changchuan Yin, Stephen S, Yau T. J Theor Biol. 2007, 247(4), 687-694. [14] Wei Chen, Tian-Yu Lei, Dian-Chuan Jin. Anal Biochem. 2014, 456, 53-60. [15] Xiwu Yang, Tianming Wang. J Theor Biol. 2013, 318, 91-100.
[16] Chuanyan Wu, Rui Gao, Yang De Marinis. J Theor Biol. 2018, 446, 61-70.