Quantification and Mapping of Construction Waste Generation in Parit
Raja
Noor Yasmin Zainun
1, a *and Wrohayu Othman
2,b1,2 Department of Construction and Building Engineering (JKBP),Faculty of Civil and Environmental
Engineering(FKAAS),UniversitiTun Hussein Onn Malaysia, BatuPahat
a [email protected], b [email protected]
Keywords: construction waste illegal dumping, database, GIS
Abstract. Construction waste is a material of waste or excess building materials that are not used either in the original or debris from construction, structural repair, and improvement work, house demolishing, buildings and other structures. Wastes are from excess building materials from dredged material and stumps of structural repairs, improvements and work to destroy sidewalks, homes, commercial buildings and other structures. Construction waste also refers to soil, rock and vegetation removed during land levelling works or civil engineering works and works related to road maintenance. Illegal dumping site is places other than permitted facilities to dump waste such as transfer stations and landfills. The objectives of this study are; (1) identify illegal dumping of construction waste distribution in Parit Raja; (2) quantifying the illegal dumping of construction waste generated in Parit Raja and; (3) develop Geographic Information System (GIS) map for illegal dumping construction waste distribution in Parit Raja. In this study the location of the construction waste identified using Global Positioning System (GPS) in smartphone. Then the picture and material of construction waste was taken and identified. After that the volume of construction waste were determined using the pyramidal or rectangular shape measure. For the scattered waste, the weight were taken and converted to volume. Lastly the data was plotted and mapped in the GIS system. This study successfully create a database of construction waste generation in Parit Raja. The benefit of this study is it will help the management of waste in Parit Raja.
Introduction
Rapid growth of the construction industry in Malaysia has resulted in an increased amount of construction waste generated. It has a direct effect on the environment [1]. Effective construction waste management can reduce the risk of environmental issues and make the construction operation more resource-efficient [2]. As a result, various waste management strategies such as reduce, reuse, and recycle construction waste, reduce liability, keep the construction sites cleaner and safer, and conserve valuable landfill space have been adopted in construction projects. Unfortunately, yet the construction waste generation is not controlled as desired [3].
The trend of illegal dumping has caused risk to human health and the environment [4,5]. The issues of illegal dumping arise due to the cost and project location factors [6]. The distance between the project location and the landfill site hinder the contractor to dispose in legal landfill. The contractors intended to maximize profit by avoiding transportation cost and payment charge to the gazetted landfill.
Waste Issue in Malaysia
Variation problems exist in open pit waste management in Malaysia, including low collection coverage, irregular collection services, not enough equipment, conventional open dumping, burning without air, water pollution control, the law is not exhaustive and resource constraints. These
problems are caused by a variety factors that affect the development of waste management systems which are effective in Malaysia [7].
Case happened in Melaka on 21st September 2011 as reported by Utusan Online, Coastal mangroves near Taman Melaka Raya become dumping site for construction materials by irresponsible parties. The cleanup operation conducted, officers found about 30 tons of waste materials being thrown around Taman Melaka Raya. The solid waste materials removed by contractors carrying out construction work in the area. The act of throwing waste materials there may be an adverse effect on the environment because the area was gazetted as a bird sanctuary [8].
On 17 July 2013, in Kuala Lumpur as report by Utusan Online, whim action by construction contractor dumped waste and construction waste at the roadside near a U-turn at the Taman Len Sen, here pose a danger to road users plying the route every day. The construction waste was being dumped because the route to Taman Len Sen Pump House closed due to construction waste pile too much. In the event of low water pressure problems, undoubtedly the Selangor Water Management Corporation Berhad (SATISFIED) has difficulty getting into the pump house. Currently, access to the pump house was covered by residual bitumen road and red soil [9].
In other case occur at Ampang reported by Siti Aishah Yusoff on 27 October 2011 as publish on Utusan Online where construction waste being dump at Jalan Pandan Perdana 6/2, Taman PandanPerdana. The situation has been going on for some time and the growing pile of garbage because there are unscrupulous dumping construction waste in situ causing residents lost confidence to the local authorities because no one had come to clean up the construction waste. There are some three-foot deep hole as a result of construction projects in the area had previously been filled with trash and water. Due to this, there were two cases of dengue fever occur involving local residents [10].
Therefore, there is a vital need to have a proper illegal dumping waste management to control the illegal dumping in Malaysia.
Methodology
In this study, the coordinate of the waste was determined using GPS on smart phone. The quantity of the waste determined, using volumetric and weighted method was applied. The length, wide and high of the waste will be measured to calculate the volume. On the other hand for scattered waste the weight will be measured and converted to volume using guideline from “Garis panduan pengurusan sisa pepejal pembinaan di tapak bina”, as provided by Solid Waste Management and Public Cleansing Corporation (PPSPPA).
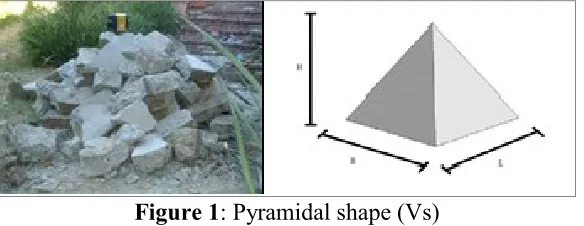
[image:2.595.154.446.594.707.2]The volume for pyramidal shape is determined using equation, Vs = 1/3 (B x L x H) and Vg = L x B x H for rectangular prism. Where L is the length, B is the base and H is the height.
Figure 1: Pyramidal shape (Vs)
Figure 2: Rectangular shape (Vr)
Figure 2 shows, the height, base and length of the rectangular shape waste and example of rectangular shape of construction waste that have been segregated by its type and place inside provided large recycling bins to determine the volume using rectangular shape formula.
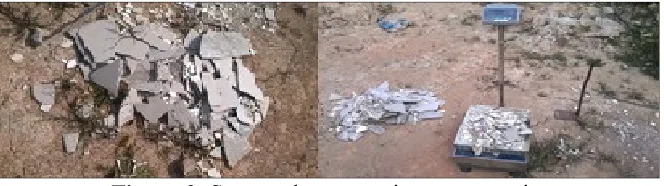
[image:3.595.133.465.334.427.2]For the particular case of scattered waste, it can be split into two classes. The first class consists of waste with similar size, such as cracked bricks, cement bricks, ceiling tiles and cement bags. The second consists of waste with large variance in size, such as off cuts of steel roofing sheet, plastic packaging and off cuts of gypsum or plaster board. For scattered waste with similar size, three samples were randomly selected and counted by weighted it. The values obtained were averaged and assumed to be the same for all other samples. Later on, the number of samples scattered around the site were counted and noted.
Figure 3: Scattered construction waste at site
The mean weight per sample multiplied by the number of samples gives the entire weight of the scattered waste. For stacked waste, it was measured in a similar manner as scattered waste. First, three randomly chosen samples from a particular stack of waste were weighed and averaged. This average weight is taken to be uniform for the whole stack. This was fallen out by counting the number of samples in the stack. This value was then multiplied by the average weight per sample to get the total weight of the stack. This method was employed except where there is a great variation between sample sizes. The stacked waste was separated out into similar sizes before the method was applied. Figure 3 shows the example of scattered waste on site.
Results and Discussions
[image:3.595.51.547.702.799.2]From the data collected at Parit Raja, it was found that fifteen categories of construction waste has been observed with the total volume of construction waste data collected is 934.952 m3.
Table 1: Table of illegal construction waste generation in Parit Raja
Number Type of waste Volume, m3 Percentage (%)
1 Plastic 0.013 0.001
2 Plaster board + Tile 0.360 0.039
3 Concrete + Tile 1.000 0.107
4 Tile 2.247 0.240
6 Rock 3.669 0.392
7 Metal 6.969 0.745
8 Bricks 9.787 1.047
9 Concrete + Road pavement 11.000 1.177
10 Plaster board 14.400 1.540
11 Concrete 29.417 3.146
12 Wood 57.436 6.143
13 Concrete + Bricks 59.436 6.357
14 Mix 174.845 18.701
15 Road pavement 560.758 59.977
[image:4.595.53.543.69.235.2]Total 934.952 100.000
Table 1 shows, the percentages of each type of waste that have been collected. The majority of the waste was consist of road pavement with percentages up to 59.977% followed by, mix construction waste with 18.701%. Concrete with brick and wood has almost the same percentage with 6.357% and 6.143% respectively. Plastic had the lowest percentage compared to other types of construction wastewith 0.001%.
Database development using ArcGIS
Data collection was plotted and mapped in GIS system. Figure 4 shows the mapping of construction waste illegal dumping site in Parit Raja.
Figure 4: Mapping of construction waste illegal dumping at Parit Raja
[image:4.595.71.527.413.685.2]Conclusions
In conclusions, most of the illegal dumping location, located between Kawasan Perindustrian Parit Raja and Taman Impian. The illegal dumping location is distributed fairly around Parit Raja. Total of 38 point location of illegal dumping had been spotted and mapped at Parit Raja. Total illegal waste generation in Parit Raja is 934.952 m3 with 15 type of construction waste. The mapping for illegal dumping construction waste distribution in Parit Raja successfully developed using GIS.
References
[1] S. A. Mansor, "The 7th Malaysia Construction Sector Review and Outlook Seminar," retrieved from http://www.kkr.gov.my/files/PRESS%20CID B%203%2 0Ogos_0.pdf Accessed on February 1st, Ed, 2010.
[2] Association for Project Safety U.K, (2009), Construction Waste Management –Making It Work For You
[3] Chartered institute of purchasing and supply, “How to develop a waste management and disposal strategy, 2007” retrieved from http://www.cips.org/Documents/About%20CIPS /Develop%20Waste%20v3%20-%2020.11.07.pdf on February 24, 2014.
[4] Faridah, A., H., A., Hasmanie, A., H., Hasnain, M., I., (2004), A study on construction and demolition waste from buildings in SeberangPerai, Proceeding of 3rd National Conference in Civil Engineering
[5] Rahmat, N. S and Ibrahim, A. H. (2007), Illegal Dumping Site: Case Study in the District of Johor Bahru Tengah, Penang, Malaysia. Rounce, G. (1998). “Quality, Waste and Cost Considerations in Architectural Building Design Management”, International Journal of Project Management.
[6] Seow, T. W and Mohamad, A. H (2007). Construction Waste Management on Site. Proceedings of UniversitiPerguruan Sultan Idris, TanjongMalim, Perak.
[7] Von Lina Lau (2004), Case Study on the Management of Waste Materials in Malaysia, Forum Geoökol.
[8] Utusan Online, WartawanUtusan Online (2011), Taman Melaka Raya tempatpembuangan
sisabinaan, Utusan Online, retrieve from
http://www.utusan.com.my/utusan/info.asp?y=2011&dt=0922&pub=Utusan_Malaysia&sec=S elatan&pg=ws_06.htm on May 4, 2014.
[9] Utusan Online, WartawanUtusan Online (2013), Penduduktanggungderita, Utusan Online, retrieve from http://m.utusan.net.my/utusan/Kota/20130718/wk_02/Penduduk-tanggung-deritaon May 4, 2014.