Comparison between Multiple Gradient and Pole Dipole
Array Protocols for Groundwater Exploration in
Quaternary Formation
A. K. Abd Malik1, A. Madun1,*, M. F. Md Dan1, M. K. Abu Talib1, F. Pakir1, S. A. Ahmad Tajudin1, M. N. H. Zahari2, M. E. Z. Mat Radzi2
1
Faculty of Civil and Environment Engineering, University Tun Hussein Onn Malaysia, Malaysia
2
Preston GeoCEM (M) Sdn. Bhd., Taman Universiti, Malaysia
Received August 6, 2019; Revised October 6, 2019; Accepted December 15, 2019
Copyright©2019 by authors, all rights reserved. Authors agree that this article remains permanently open access under the terms of the Creative Commons Attribution License 4.0 International License
Abstract
The demand for groundwater supply has been increasing in recent year. In the past, Electrical Resistivity Method has been one of the well-known non-destructive methods for groundwater surveying using various protocols to obtain the tomography of the soil subsurface. This study interpreted the difference of imaging results between two different protocols, the Pole-dipole array and the Multiple Gradient array using ABEM TERRAMETER LS 2 due to the complexity of geological setting. The geophysical survey shows the imaging result of the resistivity and induced polarization for the Pole-dipole array that differs from the imaging results from Multiple Gradient array because of the different path the electric current C2 passing through different soil types before reaching to the other side of the current electrode C1. The positioning of the remote cable was practically perpendicular to the alignment of the electrode spacing for Pole-dipole and parallel for Multiple Gradient array and this causes the data collected at both protocols to have different values because of the difference in composition of soil that the current has to go through. This study has verified the differences of resistivity and induced polarization imaging results by using a drilled tube well to identify the soil types.Keywords
Electrical Resistivity Method, Induced Polarization, Multiple Gradient Array, Pole Dipole Array, Resistivity1. Introduction
There are multiple subsurface exploration methodswhich can help in interpreting the conditions and
from Pole-dipole and Multiple Gradient array protocol. The type of soil obtained from the drilled borehole is observed and collected to be compared with the 2-D imaging data from the resistivity and induced polarization testing.
2. Materials and Methods
The study was conducted at Madrasah Darrul Hikmah located in Batu Pahat to find the availability of groundwater. The electrical resistivity method was used to locate the possibility of groundwater by analyzing the tomography of the studied location. The availability of groundwater in the area is proved through drilling and the location of the proposed drilling position that are chosen based on the analysis of the resistivity and chargeability value
2.1. Study Area
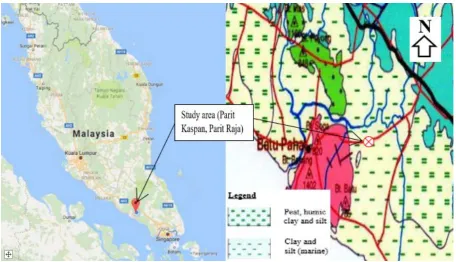
The study area was located at Madrasah Darrul Hikmah,
[image:2.595.70.527.351.613.2]Kg. Parit Kaspan Parit Raja Batu Pahat, Johor.as shown in Figure 1. The distance of the site to the central of Batu Pahat is about 18 km. The site topography is relatively flat and surrounded by residents and palm oil plantation. The general geology of peninsular Malaysia has been well documented by Minerals and Geoscience Department of Malaysia and based on the geological map shown in Figure 1, the study area is located in a quaternary period consisting of unconsolidated deposits from clay and silt (marine). In general, the presence of quaternary aged soil will exhibit soft soil phenomenon due to young and high-water content derived from high water tables of lowland areas [6]. Since Malaysia is a country with high rainfall intensity it is also very common for this country to be having a high storage of groundwater at the study area. Based on the ground surface observation, soft soil conditions related to wet clay and silt geomaterials can be easily found in this area. This can be evident with the compositions of the subsurface profile which consists of thick clay and silt layers, and thus not having potential for usable groundwater. Electrical resistivity surveys are to be performed to further evaluate the subsurface geomaterials.
2.2. Electrical Methods
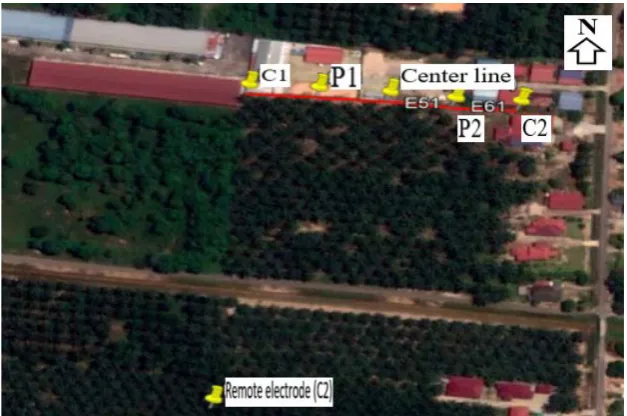
Electrical method (electrical resistivity and induced polarization) was performed using ABEM Terrameter LS 2 to obtain the electrical resistivity and induce polarization imaging on site. A maximum of 61 number of electrodes was peg at the ground surface based on four resistivity land cables and 2 meters of equal electrode spacing. The total length of 2D resistivity test was 160 meters and the survey traverse oriented west to east direction as shown in Figure 2. The raw data obtained from the data acquisition was processed using commercialized RES2DINV software to provide an inverse model that approximates the actual subsurface structure. The inversion algorithm of RES2DINV was used to process the data in order to obtain the 2-D electrical results. The two protocols used for this study were the Pole-dipole array and Multiple Gradient array and both of the tests were conducted continuously one after another. The Pole-dipole array protocol has a particular characteristic of having its current electrode (C2) to be placed as far away as possible. In the case of this
[image:3.595.141.455.337.545.2]study the current electrode is placed at 270 meters away from the geophysical survey line as it is the furthest distance the current electrode can be placed during the survey being conducted. After the acquisition of the Pole-dipole array data was completed, the Multiple Gradient array then continuously started using the same electrode placement used by the Pole-dipole array. After obtaining the resistivity and chargeability imaging value of the surveyed line, the type of soil within the subsurface can be predicted by referring to the resistivity and chargeability chart [7] which is presented in Table 1. To validate the interpretation of the results from the imaging data, a chosen position along the west-east line will be drilled (90 meter from west to east direction) to obtain the actual type of soil. The drilling data will only represent single point information (1D) at the actual drilling location thus to some extent the data obtained can be compared with the results from the resistivity and chargeability [8]. The testing results from the Pole-dipole array and Multiple Gradient array will be compared with the type of soil obtained from the drilling process.
Figure 2. Alignment (west-east) of electrical resistivity performed at Madrasah Darul Hikmah, Kg. Parit Kaspan Parit Raja Batu Pahat, Johor
Table 1. Resistivity and chargeability value
Material Resistivity (ohm-m) Chargeability (ms)
Groundwater(fresh) 10 to 100 0
Alluvium 10 to 800 1 - 4
Sandstone 8 - 4 × 10³ 3-12
Shale 20 - 2 × 10³ 50 - 100
Limestone 50 - 4 × 10³ 10 - 20
[image:3.595.142.453.587.720.2]2.3. Results and Findings
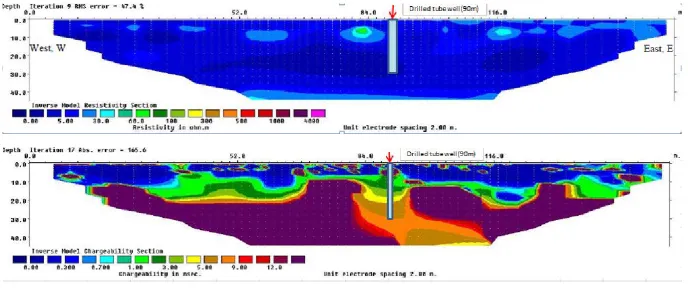
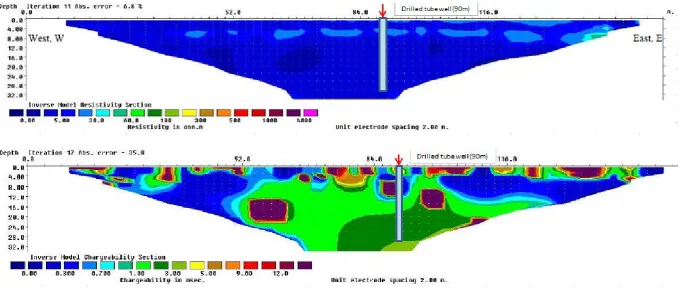
A total of two geophysical surveys were conducted in the study area. The imaging data obtained for both Pole-dipole array and Multiple Gradient array were presented in Figure 3 and Figure 4 respectively. The result indicates that most of the subsurface resistivity values are below 60 Ω-m from both Pole-dipole and Multiple Gradient arrays. The resistivity values for sand and wet silty sand are in the range of 10-800 Ω-m and 100-250 Ω-m respectively [9,10]. Pandey, Shukla and Habibi [11] added that the resistivity of sandy soil decreased rapidly with an increase in water content. The results from the electrical resistivity imaging show, the condition of the subsurface on site has a relatively low resistivity which may indicate that there might be high water presence throughout the study area. This condition corresponds with the lithology of the study area which indicates a high water table presence because the study location is located within a quaternary period consisting of unconsolidated deposits from clay and silt (marine).
In term of the induced polarization results by referring to Figure 3 and Figure 4, the chargeability value in both tests showed a high difference in value especially in the lower-mid section of the induced polarization imaging. Starting from the depth of 20 meters and below the Pole-dipole array chargeability value indicates a range of value of 6-13 ms and the Multiple Gradient array having a general chargeability value ranging from1-3 ms. The chargeability value for both induced polarization at this section of the imaging is far–off from each other even though the same survey line was used to conduct both the tests. The two contrasting results indicate a presence of two different soil profiles under the same geophysical survey line. This anomaly can be explained by referring to the geological model of the area as sketched in Figure 5. The positioning of the remote electrode (C2) of the Pole-dipole array was in the area of domination with clay. Meanwhile current electrode (C1) is located on the sandy lenses layer as shown in Figure 5(a). For Multiple Gradient array, all the current electrodes were positioned on top of the sandy lenses layer (Figure 5(b), thus taking a major role in influencing the difference of chargeability value between the two arrays. The difference may also be due to the difference in the geometry factors of the arrays.
Figure 5. The geological model of the study area illustrate (a) the remote cable C2 positioned at a dominated clay for Pole dipole array and (b) the current electrodes placed on top of a sand lenses layer for Multiple Gradient array
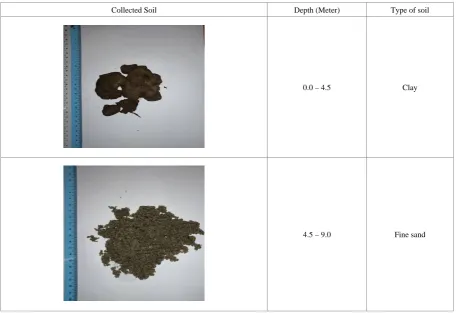
Table 2. Drilled soil on site about 20 meters depth
Collected Soil Depth (Meter) Type of soil
0.0 – 4.5 Clay
[image:7.595.70.527.410.723.2]9.0 – 15.0 Coarse sand
15.0 – 20.0 Fine sand
3. Conclusions
Both of the electrical resistivity surveys were successfully performed at Darul Hikmah, Kg. Pt. Kaspan Parit Raja Batu Pahat, Johor. Based on the data obtained from both of the geophysical surveys, the electrical resistivity values show little or no difference in term of resistivity value which ranging from 0-60 Ω-m. However, the induced polarization results showed varied chargeability values between the two different arrays for the Pole-dipole array, the dominant chargeability values are in the around 0.2 and 13 ms and for the Multiple Gradient array the value ranges from 0.2 – 1.5 ms. The reason for the difference in results is because of the positioning of the Remote electrode (C2) which lies far away and is almost parallel to the geophysical survey line causing the current path in the clay area for Pole-dipole array to be different from the Multiple Gradient array. Hence, this study has successfully shown the differences geological setting within the electrode currents influence the imaging results between the Pole-dipole array and the Multiple Gradient array protocol.
Acknowledgements
The authors would like to thank Ministry of Higher Education and Universiti Tun Hussein Onn Malaysia for their financial support on FRGS vot. K049 and TIER 1 vot H183 respectively.
REFERENCES
Szalai, S., & Szarka, L. (2008). On the classification of [1]
surface geoelectric arrays. Geophysical Prospecting, 56(2), 159–175. https://doi.org/10.1111/j.1365-2478.2007.00673. x
Szalai, S., Novák, A., & Szarka, L. (2011). Which [2]
geoelectric array sees the deepest in a noisy environment? Depth of detectability values of multielectrode systems for various two-dimensional models. Physics and Chemistry of the Earth, 36(16), 1398–1404. https://doi.org/10.1016/j.pce .2011.01.008
Syukri, M., & Saad, R. (2017). Seulimeum segment [3]
characteristic indicated by 2-D resistivity imaging method. NRIAG Journal of Astronomy and Geophysics, 6(1), 210– 217. https://doi.org/10.1016/j.nrjag.2017.04.001
Razafindratsima, S., & Lataste, J. F. (2014). Estimation of [4]
the error made in Pole-Dipole Electrical Resistivity Tomography depending on the location of the remote electrode: Modeling and field study. Journal of Applied Geophysics, 100, 44–57. https://doi.org/10.1016/j.jappgeo. 2013.10.008
Dahlin, T., Zhou, B. (2006). Multiple-gradient array [5]
measurement for multichannel 2D resistivity imaging. Near surface Geophysics, 4(2), 113-123
Hazreek, Z. A. M., Raqib, A. G. A., Aziman, M., Azhar, A. T. [6]
Method at Quaternary Deposits Area. IOP Conference Series: Materials Science and Engineering, 226(1). https://doi.org/10.1088/1757-899X/226/1/012042
Keller G.V. and Frischknecht F.C., 1996, Electrical methods [7]
in geophysical prospecting. Pergamon Press Inc., Oxford. Abidin, M. H. Z., Madun, A., Tajudin, S. A. A., & Ishak, M. [8]
F. (2017). Forensic Assessment on Near Surface Landslide Using Electrical Resistivity Imaging (ERI) at Kenyir Lake Area in Terengganu, Malaysia. Procedia Engineering, 171, 434–444. https://doi.org/10.1016/j.proeng.2017.01.35 Telford W M, Geldart L P and Sheriff R E 1976 Applied [9]
Geophysics (Cambridge: Cambridge University Press) Lee T S 2002. Slope Stability and Stabilization Methods [10]
(New York: John Wiley & Sons, Inc.)
Pandey, L. M. S., Shukla, S. K., & Habibi, D. (2015). [11]