Journal of Chemical and Pharmaceutical Research, 2014, 6(6):2867-2872
Research Article
CODEN(USA) : JCPRC5
ISSN : 0975-7384
Comparison of three tracking methods of white matter fiber bindles
based on diffusion MRI
Zhanxiong Wu
a* and Xun LI
ba
School of Electronic Information, Hangzhou Dianzi University, Hangzhou, China
bSchool of Computer Science and Technology, Hangzhou Dianzi University, Hangzhou, China
_____________________________________________________________________________________________
ABSTRACT
Diffusion MRI is based on the measurement of Brownian motion of water molecules. It is possible to use this diffusion property as a probe to study the structure of spatial order in living brain tissues noninvasively. This paper put forward with a unified tracking algorithm based on diffusion tensor imaging, diffusion spectrum imaging and Q-Ball imaging. By applying the three methods to the same DWI dataset, different tracking results were got. The DTI tracking is fastest, and the number of fiber bundles is least; the DSI tracking is slowest, and the number of bundles is most; the QBI tracking is faster than DSI, but slower than DTI, and the number is larger than DTI, but smaller than DSI. DTI cannot track crossing bundles, but DSI and QBI can.
Key words: diffusion tensor, diffusion spectrum imaging, white matter, fiber bundle
_____________________________________________________________________________________________
INTRODUCTION
White matter is mainly composed of nerve fibers, and does not contain nerve cell bodies. It is the connection channel of central nervous system, lying in the interior of the brain. The tracking of fiber bundles is of great significance not only to cognitive research but also to clinical diagnosis. High-resolution imaging of brain tissue can be got by traditional MRI (example for T1, T2, and PD), but this can only reflect one aspect of physiological characteristics of brain organization. Diffusion MRI can characterize water anisotropic diffusion properties at each picture element (pixel) of an image. Diffusion MRI has developed rapidly from 1980s[1].
Diffusion MRI exploits self-diffusion of water molecules in brain tissue by applying diffusion sensitive magnetic field gradient on it. Because it can noninvasively track fiber bundle, Diffusion MRI has wide application in the brain diseases diagnosis and connected neural network research. Actually, the construction of white matter fiber bundles is very complicated, and there are crossing fiber bundles in some imaging voxels. The tracking of crossing fiber bundles needs high angle resolution.
muscle fibers, white matter, etc.) by exploiting Brown motion of water molecules. DTI has been widely used in clinical diagnosis and brain function research.
Apparent diffusion coefficient (ADC) of DTI, macroscopically reflects the random motion trend (stochastic displacement) of all water molecules in a voxel. For anisotropic diffusion, tensor is needed to characterize diffusion coefficient. The coefficient implies the microstructure information of brain physiological tissue including tortuosity and ratio of extracellular space. In short, DTI reconstructs the images of brain tissues through measuring T2-weighted attenuated signal because of Brown motion of water molecules. According to Stejskal-Tanner equation (1), diffusion tensor
D
was calculated.T 0
= exp(-
)
1, 2, , 6
i i i
S S
bg Dg
=
i
⋅⋅⋅
(1)where
S
i is T2-weighted attenuated signal,S
0 is original signal,b
is diffusion factor,D
is diffusion tensor,i
g
is diffusion magnetic field gradient. The each side of equation (1) was applied by the logarithmic function,equation (2) was gotten. Because there are six unknown factors in (
D
is a symmetric positive definite 3x3 matrix), at least six magnetic field gradients must be applied in six different directions [2].T 0
ln (
S
i)= ln (
S
)-
b g
iD g
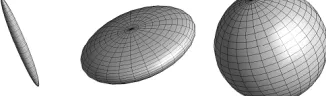
i (2) [image:2.595.225.388.445.493.2]Diffusion tensor usually is expressed as ellipsoid geometry, as shown in figure 1. There are three different types. First is long cylindrical, indicating that water molecules can only freely diffuse in a certain direction and cannot in others; Second is flat shape, indicating that water molecules can only freely diffuse in a certain plane; Third is spherical, indicating that water molecules can freely diffuse in all directions (isotropic diffusion) [3].
Fig. 1 Ellipsoids denoting three type diffusion tensors
DSI
As a form of diffusion MRI, DSI is able to image living organ non-invasively by applying diffusion sensitive magnetic gradients. In q-space attenuated signals are collected, DSI images are gotten using Fourier transform. This imaging technique was invented by Wedeen in the year of 2000[4]. According the theory of Einstein, probability density function is used to describe the diffusion displacement. In 1991, Paul Callaghan proved that MRI signal can be calculated from q-space datasets using Fourier transform.
At present, DSI is a more complex kind of diffusion MRI imaging technique, and is able to provide most detailed anisotropic information of physical structure.
DTI cannot reflect the local maximum probability of anisotropic diffusion in a voxel. But DSI could describe multiply diffusion directions in a voxel by calculating the according local maximums of diffusion probability function. The contrast of DTI and DSI is shown as figure 2, (a)
λ
1、2
λ
、2
Fig. 2 The contrast of DTI and DSI, (a) three eigenvectors of DTI, (b) ellipsoid of DTI, (c) diffusion displacement probability of DSI
If
S
∆ is the attenuated signal andS
0is the signal without diffusion-sensitive magnetic gradients, the equation (1) is:0 i
S
∆=
S
e
q r⋅ (1)Where is average operator,
∆
is diffusion time,r
is displacement vector,q
=
γδ
g
(γ
is gyromagnetic ratio,δ
is the duration of magnetic gradient,g
is gradient vector) [6]. Because that the average of diffusion displacement of water molecules in a voxel equals toE e
(
iq r⋅)
, equation (2) was derived:3 0 3 0
(
)
( )
i i RS
S E e
S
p
e
d
⋅ ∆ ⋅ ∆
=
=
∫
q r q rr
r
(2)Where
p
∆( )
r
is diffusion probability density function, R3is the voxel space. From equation (2), we can infer equation (3):3
1 3 3
0
( )
(2 )
iR
p
∆r
=
S
−π
−∫
S e
∆ − ⋅q rd
r
(3)Where
p
∆( )
r
is called as diffusion spectrum function [7].QBI
The reconstruction method of QBI was proposed by Tuch, and it has two key parameters: the width of the Guassian smoothing kernel, the width of the interpolation kernel. This method just need the sampling points on the sphere surface in q-space, and then QBI images are calculated through Funk-Radon transform [8]. But DSI must collect the all points in whole q-space in order to get diffusion images. Because the number of sample points of QBI is smaller than DSI, the reconstruction of QBI is time-saving. The radius of sphere could be selected randomly, and QBI need less strict configuration of magnetic gradients than DSI.
The mapping between Cartesian and spherical coordinates systems may introduce Cartesian artifacts in the ODF. Cartesian coloration of the ODF may be a particular problem at the coarse Cartesian resolution typically used for QSI. Further, the radial projection is highly inefficient since the projection discards a considerable fraction of the acquired data. The efficiency of QSI is also hampered by the strong pulsed field gradients needed to satisfy the Nyquist condition for the diffusion PDF in cerebral white matter. It is substantially more efficient to measure the diffusion ODF by directly sampling the diffusion signal on a spherical shell in diffusion reciprocal space [6].
The QBI reconstruction is based on the FRT, also known as the spherical Radon transform or simply the Funk transform.
2)As to DTI, we calculated the principal eigenvectors of each voxel. As to DSI, we calculated the local maximums of diffusion probability density function. As to QBI, we calculated the local maximums of orientation distribution function;
3)Setup the tracking parameters of step size, angle(equation 5), and length(equation 6) of fiber bundle;
1 2
1 2
arccos
θ
=
⋅
⋅
v v
v
v
(5)
min max
L
≤ ≤
L
L
(6) 4)Select ROIs, then find the smooth curves among all diffusion directions according to the local maximums.
[image:4.595.171.447.324.483.2]As shown in figure 3, the tracking of single fiber bundle and of crossing fiber bundle was described: (a) the tracking based on DTI, (b)the tracking based on DSI. One DTI voxel has only one diffusion vector, and one DSI voxel may have several diffusion vectors. The dark blue line denotes a tracking line, and the red line denotes another crossing tracking line.
Figure 3 Tracking of nerve fiber bundles, (a) Tracking based on DTI, (B) Tracking of crossing fiber bundles based on DSI and QBI
RESULTS
Figure 4 Tracking results within whole brain region, the first low is of DTI, the middle one is of DSI, The third one is of QBI
The first column is of sagittal view, the middle one is of coronal view, the third one is of axial view.
[image:5.595.109.507.398.501.2] [image:5.595.103.506.545.659.2]Corpus callosum locates at the bottom of the two spheres, which is the largest commissural fiber bundles. The fiber crosses the midline, and goes into the gyri forming the radiation of connection.
Figure 5 Tracking results of corpus callosum fiber bundles, (a)ROI, (b)DTI, (c)DSI, (d)QBI
The ROI is shown as figure 5, including the constructions of corpus callosum, thalamus, and medulla.
Figure 5 Tracking results of the local region fiber bundles, (a)ROI, (b)DTI, (c)DSI, (d)QBI
CONCLUSION
[1] D Bihan, JF Mangin, C Poupon. Diffusion tensor imaging: concepts and applications[J], Journal of Magnetic
Resonance Imaging, 2001, 13(4):534-546.
[2] LW Kuo, JK Chen, VJ Wedeen. Optimization of diffusion spectrum imaging and q-ball imaging on clinical MRI system [J]. Neuroimage, 2008, 41:7-18.
[3] PJ Basser , J Mattiello , D LeBihan. MR diffusion tensor spectroscopy and imaging[J]. Biophysical Journal,
1994, 66: 259-267.
[4] GK Deutsch, RF Dougherty, R Bammer. Children’s reading performance is correlated with white matter structure measured by diffusion tensor imaging [J]. Cortex, 2005, 41(3): 354-363.
[5] VJ Wedeen, P Hagmann, WY Tseng.2005. Mapping complex tissue architecture with diffusion spectrum magnetic resonance imaging [J], Magnetic Resonance in Medicine, 2005, 54:1377-1386.
[6] T Henrietta, T Róbert, Z Marianna. Complex fiber visualization [J]. Annales Mathematicae et Informaticae,
2007, 34(1): 103-109.
[7] JS Campbell, K Siddiqi, VV Rymar. Flow-based fiber tracking with diffusion tensor and q-ball data: validation and comparison to principal diffusion direction techniques[J]. Neuroimage, 2005, 27(4): 725–736.
[8] M Wiegell, D Tuch, H Larson. Automatic segmentation of thalamic nuclei from diffusion tensor magnetic resonance imaging [J]. NeuroImage, 2003, 19: 391–402.
[9] S Mori, PC Zijl. Fiber tracking: principles and strategies-atechnical review [J]. NMR in Biomedicine, 2002, 15: 468-480.